NOAA Updates its Four Season Outlook on August 17, 2023

On the third Thursday of the month right on schedule NOAA issued their updated Seasonal Outlook which I describe as their Four-Season Outlook because it extends a bit more than one year into the future. The information released also included the Mid-Month Outlook for the following month plus the weather and drought outlook for the next three months.  I present the information issued by NOAA and try to add context to it. It is quite a challenge for NOAA to address the subsequent month, the subsequent three-month period as well as the twelve successive three-month periods for a year or a bit more. A seasonal drought outlook is also issued.

Take a look at September and the three-month period that includes September. The first row in this graphic is the Mid-Month forecast for September. The bottom row shows the outlook for the next three months including September.

The full NOAA Seasonal Outlook extends through August/September/October of 2024. All the maps are in the body of the article.

NOAA provides an excellent discussion to support the maps and the changes (which are minimal) from what was issued a month ago.  It is best to read the full discussion but here are some of the highlights:

Re ENSO:

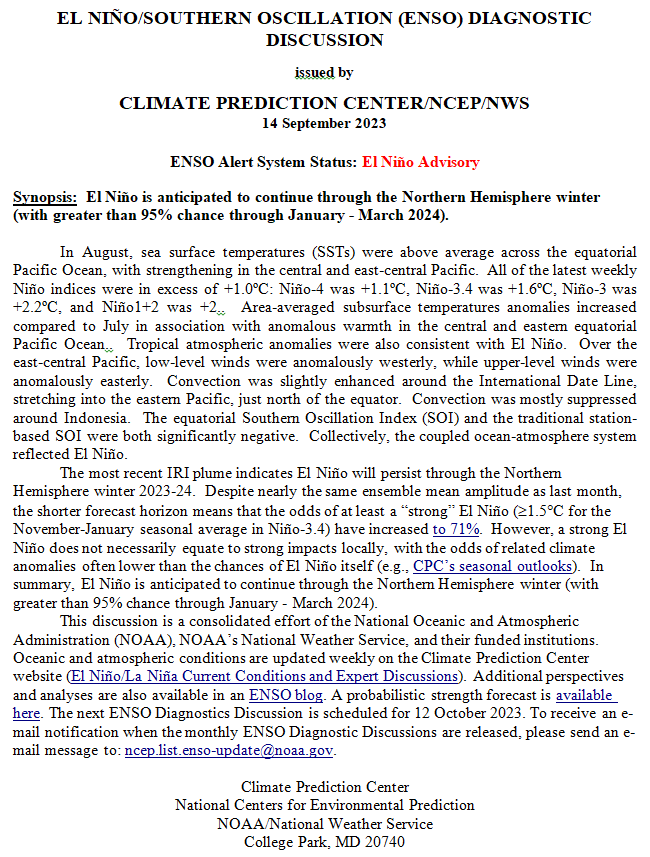
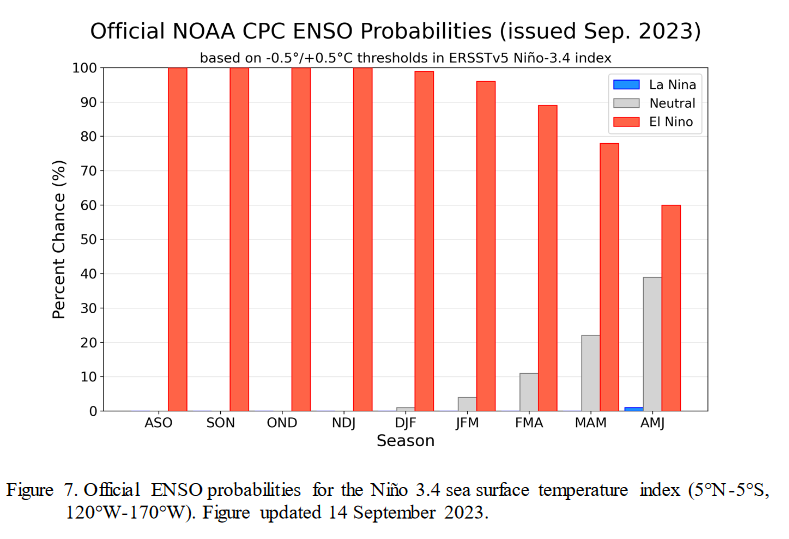
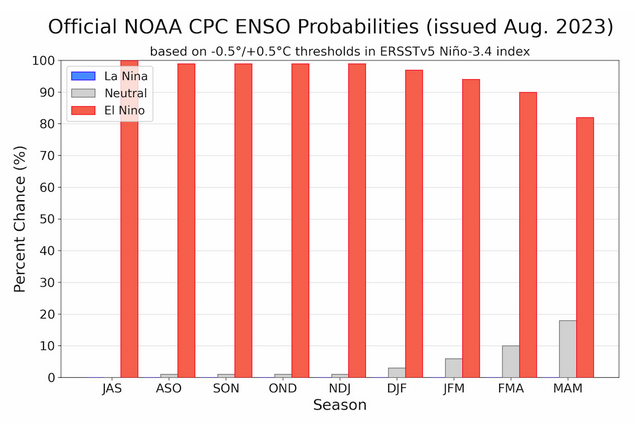
  • The median North American Multi-Model Ensemble (NMME) consolidation forecast exceeds +1.5 degrees C at its peak in late autumn and early winter before decreasing at longer leads with greater uncertainty.
  • The CPC consensus ENSO outlook indicates greater than a 90 percent chance that El Niño will continue through winter, with greater than a 60 percent chance that the strength of the Niño 3.4 anomaly will exceed +1.5 degrees C at its peak.

[Editor’s Note: How do we define the strength of El Nino? It is very informal but over 1.0 is considered moderate versus weak, over 1.5 is considered strong and over 2.0 is considered very strong.) It is a logical approach since the warmer the temperature anomaly the more we expect the Walker Circulation to be impacted. But it does not work out that way in all cases for all areas and some think the rate of change of the Nino 3.4 reading is also very important]

For September:

  • Above normal temperatures are favored for most of the western CONUS, consistent with anomalous ridging.
  • The strongest probabilities (greater than 50 percent) of above-normal temperatures are indicated near the Four Corners region.
  • However, probabilities of warmer than normal conditions are tempered across much of the northwestern CONUS for the weeks 3-4 period, which includes most of the first half of September. [Editors’ Note: Remember this Outlook was issued on August 17 so three to four weeks from then is early September]
  • Farther to the south and east, enhanced above-normal temperature probabilities are indicated across the Southern Plains, Lower Mississippi Valley, and parts of the Southeast.
  • Equal chances (EC) of above, near, and below normal temperatures are indicated for the remainder of the eastern CONUS.
  • Above-normal temperatures are favored for southern, eastern, and northern Alaska.
  • Above-normal precipitation is favored across the Southeast northward to the Mid-Atlantic and westward to parts of the Tennessee and Ohio Valleys
  • Conversely, below-normal precipitation is favored farther to the north and west for the western Great Lakes and Upper Mississippi Valley
  • Latest weeks 3-4 guidance from the ECMWF and GEFS depict a wet signal across the Baja Peninsula and the Gulf of California, suggestive of potential tropical cyclone (TC) activity. This potential TC activity leads to a slight tilt toward above-normal precipitation for parts of the southwestern CONUS.
  • Farther to the north, above-normal precipitation is favored for western Alaska
  • A weak tilt toward below-normal precipitation is indicated for Southeast Alaska due to weeks 3-4 guidance

For SON 2023

  • Above-normal temperatures are favored across Alaska and the western CONUS in the SON and OND 2024 temperature outlooks.
  • The greatest probabilities exceed 50 percent for northern Alaska and parts of the Southwest, due to decadal trends.
  • Above-normal temperatures are also favored eastward across the southern Contiguous United States (CONUS) into the Southeast and northward through the eastern CONUS into the eastern Great Lakes region, consistent with the consolidation of tools.
  • Decadal trends lead to higher probabilities of above-normal temperatures over the Northeast.
  • Potential El Niño impacts for the SON and OND seasons include cooler temperatures over much of the central CONUS, leading to weaker probabilities for above-normal temperatures
  • During SON 2023, above-normal precipitation is favored for western and northern Alaska and the southeastern CONUS,
  • Below-normal precipitation is favored for the Pacific Northwest, a small area of the Southwest, and the western Great Lakes region.
  • Enhanced probabilities of above-normal precipitation for parts of Alaska are supported by dynamical and statistical tools.
  • Below-normal precipitation for the Pacific Northwest and Great Lakes and above-normal precipitation for the Southeast are consistent with El Niño impacts, and largely persist through the next several leads.
  • Below-normal precipitation for parts of the Southwest in the SON season is consistent with the persistence of a weaker-than-normal Southwest monsoon, while the outlook for the month of September favors above-normal precipitation in areas of southern California, Nevada and Arizona to the west due to shorter-term moisture flow from the East Pacific.

Beyond SON 2023:

  • From the NDJ 2023-24 to the FMA 2024 seasons, as the leads extend through autumn into winter, increasing probabilities of above-normal temperatures are forecast from the Pacific Northwest across the northern tier of the CONUS into the Midwest and Northeast, consistent with increasing impacts of a strengthening El Niño.
  • Equal chances of above, near, and below normal temperatures (EC) is forecast across the southern tier of the CONUS with a tendency towards cooler temperatures arising from El Niño impacts.
  • For MAM 2024 and longer leads through SON 2024, the outlooks relied heavily on the ENSO-OCN tool, and decadal trends provide most of the available climate signals.
  • The seasonal temperature outlooks evolve toward a similar pattern at the longest leads (MAM 2024 through SON 2024), and the forecasts generally depict a u-shaped pattern of enhanced probabilities of above-normal temperatures over the CONUS, and EC in the northern central CONUS into the central Mississippi valley.
  • Below-normal precipitation is forecast across much of the northern tier of the CONUS from parts of the Pacific Northwest to the Great Lakes region from NDJ 2023-24 to FMA 2024, due to the expected strengthening El Niño.
  • The enhanced probabilities of above-normal precipitation for the Southeast increase and extend westward incrementally across the Southern Plains into the Southwest for these leads, also consistent with a strengthening El Niño.
  • For the MAM 2024 season and longer leads, areas of above- and below-normal precipitation coincide with signals due to decadal trends, including enhanced probabilities for below-normal precipitation in areas of the northwestern CONUS and enhanced probabilities for above-normal precipitation in the lower Mississippi Valley and Mid-Atlantic region.

Tonight, Tomorrow, Next Day, Five Days, and Intermediate-Term Outlooks for the U.S. and a Six-Day Forecast for the World: posted August 18, 2023

Here is what we are paying attention to in the next 48 to 72 hours. The article also includes weather maps for longer-term outlooks and a five-day World weather outlook.

We start with the U.S. Information. You can update this section here but these are 48 to 72-hour forecasts so if I have not been able to update this area twice daily, what is shown is still valid and the images in the body of the article update automatically but sometimes they are a bit slow to update.

Short Range Forecast Discussion
NWS Weather Prediction Center College Park MD
Fri Aug 18 2023
Valid 12Z Fri Aug 18 2023 – 12Z Sun Aug 20 2023

…Heavy rainfall and flash flooding becoming more likely over parts of
the Southwest…

…Critical fire conditions expected from the Northwest to the northern
High Plains today…

…Dangerous heat redeveloping over the central U.S…..


Crop Report August 17, 2023 – Corn and Soybeans have made remarkable recoveries.

This article is based primarily on the August 15, 2023, USDA Crop Bulletin which covers the week ending August 13, 2023. The USDA report usually becomes available on Tuesdays. I have omitted a number of graphics that are available in the full USDA Crop Bulletin which can be accessed HERE.

It now seems like an average crop especially given the recovery of the corn and soybean crops as the drought in the important growing area for those two crops let up.

The article includes a short international review of agricultural conditions. I wanted to include a report on technology use in farming but the August version does not come out until later today so I will add it then.

We begin with the National Agriculture Summary.  The Tables below the summary have additional data. The boxes with my comments may be incomplete so for crops of interest check the data out yourself to be sure.

Tonight, Tomorrow, Next Day, Five Days, and Intermediate-Term Outlooks for the U.S. and a Six-Day Forecast for the World: posted August 17, 2023

Here is what we are paying attention to in the next 48 to 72 hours. The article also includes weather maps for longer-term outlooks and a five-day World weather outlook.

We start with the U.S. Information. You can update this section here but these are 48 to 72-hour forecasts so if I have not been able to update this area twice daily, what is shown is still valid and the images in the body of the article update automatically but sometimes they are a bit slow to update.

Short Range Forecast Discussion
NWS Weather Prediction Center College Park MD
Thu Aug 17 2023
Valid 12Z Thu Aug 17 2023 – 12Z Sat Aug 19 2023

…Hot/record temperatures to shift focus out of the Northwest and into
the central U.S.; Critical Risk of Fire Weather in the Northwest…

…Showers, thunderstorms, and an increasing risk of flash flooding for
the Southwest...

…Scattered shower and thunderstorm chances continue along the East
Coast…


Looking Back at the Global Climate in July 2013 – This past July seems to have been the warmest July on record.

Please note the title was meant to be Looking Back at the Global Climate in July 2023, not July 2013.

Every month, John Bateman sends me a nice email. Actually, he sends me two: one about the U.S. and one about the world.  I have already published an article based on his U.S.-focused email and you can find it HERE. Two days ago he sent me the email for the world. Since they are emails, I usually can not provide a link to what he sent me. He is a spokesperson (not sure that is the right description of his job) for NOAA both NCEI and other parts of NOAA.  For this monthly article, all of the information in his email comes from the NOAA National Centers for Environmental Information so the information he includes in his email and much more can be found HERE.

Since he is a very good writer I use a lot but not all of his material and supplement it with some additional material from the NCEI website or other NOAA websites. I have not indicated what I took from his letter and what I added but if someone has questions on that I can explain it.

Obviously the headline this month is that it looks like July has been the warmest July since this data has been collected.

This is the record of July-only land and ocean temperature anomalies and this July appears to have set a new record high. It is just speculation on my part but I think it is the stepwise rise in temperature we get with an El Nino.


Tonight, Tomorrow, Next Day, Five Days, and Intermediate-Term Outlooks for the U.S. and a Six-Day Forecast for the World: posted August 16, 2023

Here is what we are paying attention to in the next 48 to 72 hours. The article also includes weather maps for longer-term outlooks and a five-day World weather outlook.

We start with the U.S. Information. You can update this section here but these are 48 to 72-hour forecasts so if I have not been able to update this area twice daily, what is shown is still valid and the images in the body of the article update automatically but sometimes they are a bit slow to update.

Short Range Forecast Discussion
NWS Weather Prediction Center College Park MD
400 AM EDT Wed Aug 16 2023

Valid 12Z Wed Aug 16 2023 – 12Z Fri Aug 18 2023

…Dangerous Heat Wave continues over the Pacific Northwest/Northern
Rockies as heat builds back in over Texas Thursday…

…Severe thunderstorms possible for the Upper Midwest Wednesday…

…Showers, thunderstorms, and isolated flash flooding will continue
across the Four Corners region…


Tonight, Tomorrow, Next Day, Five Days, and Intermediate-Term Outlooks for the U.S. and a Six-Day Forecast for the World: posted August 15, 2023

Here is what we are paying attention to in the next 48 to 72 hours. The article also includes weather maps for longer-term outlooks and a five-day World weather outlook.

We start with the U.S. Information. You can update this section here but these are 48 to 72-hour forecasts so if I have not been able to update this area twice daily, what is shown is still valid and the images in the body of the article update automatically but sometimes they are a bit slow to update.

Short Range Forecast Discussion
NWS Weather Prediction Center College Park MD
Tue Aug 15 2023
Valid 12Z Tue Aug 15 2023 – 12Z Thu Aug 17 2023

…Dangerous heat continues across the Pacific Northwest into the Northern
Rockies as much of the South sees a brief reprieve from recent oppressive
heat…

…Flash flooding and severe thunderstorms possible for portions of the
coastal Mid-Atlantic and Carolinas Tuesday…

…Monsoonal showers continue across the Four Corners region with some
locally heavy downpours possible…


Tonight, Tomorrow, Next Day, Five Days, and Intermediate-Term Outlooks for the U.S. and a Six-Day Forecast for the World: posted August 14, 2023

Here is what we are paying attention to in the next 48 to 72 hours. The article also includes weather maps for longer-term outlooks and a five-day World weather outlook.

We start with the U.S. Information. You can update this section here but these are 48 to 72-hour forecasts so if I have not been able to update this area twice daily, what is shown is still valid and the images in the body of the article update automatically but sometimes they are a bit slow to update.

Short Range Forecast Discussion
NWS Weather Prediction Center College Park MD
Mon Aug 14 2023

Valid 12Z Mon Aug 14 2023 – 12Z Wed Aug 16 2023

…Flash flooding and severe thunderstorms possible for the Great
Lakes/Ohio Valley/Mid-Atlantic Monday, lingering along the coast into
Tuesday…

…Portions of the South to see a brief reprieve from the heat mid-week as
a heat wave intensifies across the Pacific Northwest into the Northern
Rockies…

…Monsoonal showers continue across the Four Corners region with some
locally heavy downpours possible…


Tonight, Tomorrow, Next Day, Five Days, and Intermediate-Term Outlooks for the U.S. and a Six-Day Forecast for the World: posted August 13, 2023

Here is what we are paying attention to in the next 48 to 72 hours. The article also includes weather maps for longer-term outlooks and a five-day World weather outlook.

We start with the U.S. Information. You can update this section here but these are 48 to 72-hour forecasts so if I have not been able to update this area twice daily, what is shown is still valid and the images in the body of the article update automatically but sometimes they are a bit slow to update.

Short Range Forecast Discussion
NWS Weather Prediction Center College Park MD
Sun Aug 13 2023
Valid 12Z Sun Aug 13 2023 – 12Z Tue Aug 15 2023

…Flash flooding and severe thunderstorms possible for portions of the
Plains/Mississippi Valley Sunday, shifting to the Great Lakes/Ohio
Valley/Mid-Atlantic Monday…

…Dangerous heat persists across much of the South while another heat
wave begins across the Pacific Northwest Sunday…

…Monsoonal showers continue across the Four Corners region with some
locally heavy downpours possible…


World Agriculture Production and More: August 12, 2023

Once a month USDA issues two reports on World Agriculture Production. The primary statistical report is issued by the USDA Chief Economist and the USDA Foreign Agricultural Service issues a companion report with is not as extensive but contains maps and other information that is always very interesting. I do not publish this article every month since it is difficult to prepare but this is a time of the year when the information is very relevant and important in terms of:

A. How it might be impacted by Global Warming and

B. The impact on the World GeoPolitical situation.

I am publishing it tonight and I may add some commentary tomorrow.

People like maps and graphs so we will start with those provided by USDA. It does not provide a total picture of World Production but many of what I will provide I think is interesting. There are so many that we will provide them without additional commentary. I am providing all of the maps and graphics but here is the LINK to the report.  This will be followed by the summary from the World Agricultural Supply and Demand Estimates Report which is called WASDE. Here is the LINK to that report.  It contains a lot more information but in table form with no maps and graphics.