Updated at 6:32 p.m. EST Monday, December 19, 2022 (Our regular evening report will be published tonight).
Once a week we show many of the actual forecast maps not just provide the links to these maps. This makes it easier for the reader. Our report provides a separate forecast for Days 1 and 2, Days 1-5, Days 6 -10, Days 8 – 14, and weeks 3 and 4. We also include a next-day and 10-Day Global Average Temperature and Cumulative Precipitation Forecast. This provides information that is useful to readers in terms of planning their activities for the weekend and the next 28 days. Over the weekend and into Monday there will be frequent updates of the short-term forecast.
Looking out 28 days, what we see is:
- For Temperature: The previous colder-than-normal air mass that entered the Northwest is moving east and being replaced by warmer-than-normal air from west to east.
- For Precipitation: The evolution of the predicted Southern Tier drought for the first part of 2023.
We have also included the January 2023 and the JFM 2023 Outlook from the NOAA Seasonal Outlook issued on December 15, 2023.

Plus we start with a short excerpt from the NOAA Four-Season Forecast. We will just show here the January 2023 and the next Season (JFM 2023) Outlooks. Our full Article can be accessed HERE. You can return to this article by clicking on the return arrow at the upper left side of your screen or returning to Econcurrents.com
First, let’s Take a Look at the Mid-Month Outlook for January

Combination Mid-Month Outlook for January and the Three-Month Outlook

The top row is what is now so-called the Mid-Month Outlook for January which will be updated at the end of December. There is a temperature map and a precipitation map. The second row is a three-month outlook that includes January. I think the outlook maps are self-explanatory. What is important to remember is that they show deviations from the current definition of normal which is the period 1991 through 2020. So this is not a forecast of the absolute value of temperature or precipitation but the change from what is defined as normal or to use the technical term “climatology”.
| So the above looks out both one month and three months. The full article looks out more than a year. Again the link for that article is HERE. |
Now back to the regular format of our weekend report. We will be doing selected updates all weekend. Links are generally provided so the reader can update any of the graphics themselves (plus often you will end up with a lot of additional information).
48-Hour Forecast
Daily weather maps can be updated by clicking Here for Day 1 and Here for Day 2. I will be doing the updating during the period described in the title of the article but if you happen to read this article later you can get updates via the links provided.
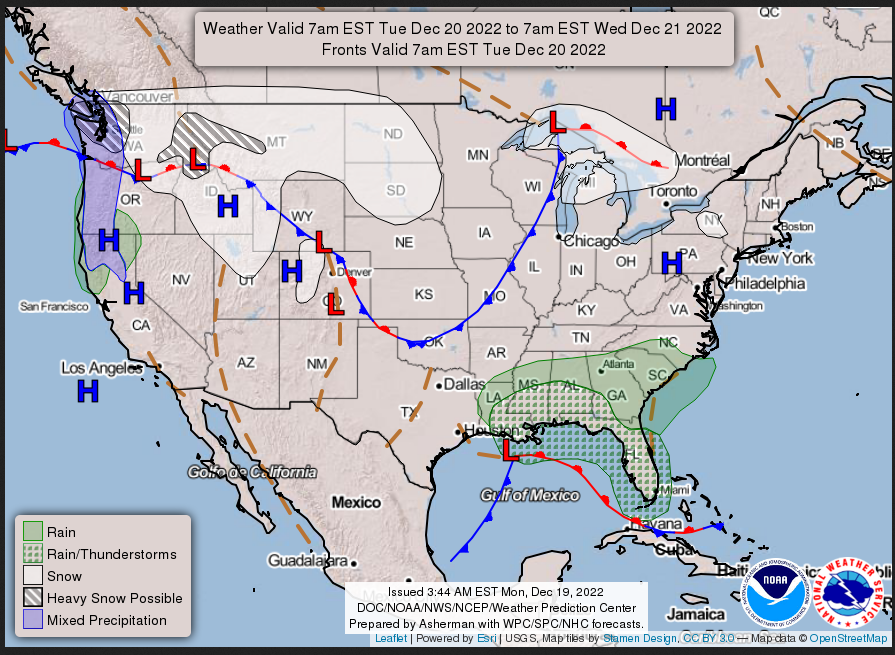
MONDAY AFTERNOON THROUGH TUESDAY MORNING

TUESDAY
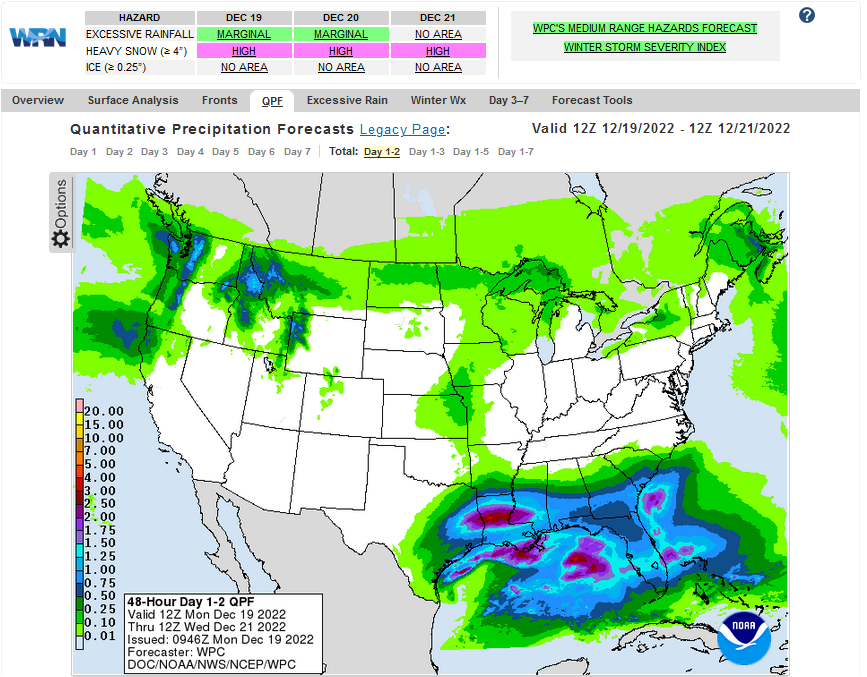
Below is the current two-day cumulative forecast of precipitation (Updates can be found HERE) Later we show a similar map that shows five days of cumulative precipitation. The images in the article are frozen but notice that if you go to the link provided you can get a variety of forecasts. That is true for many of the links provided in this article.
Here is the NWS Short Range Forecast (It is updated by NWS twice a day (a.m. and p.m) and these updates can be found here. We post at least one of those updates daily, over the weekend we usually post both.
Short Range Forecast Discussion
NWS Weather Prediction Center College Park MD
234 PM EST Mon Dec 19 2022

Valid 00Z Tue Dec 20 2022 - 00Z Thu Dec 22 2022

...Arctic air and dangerous wind chills to remain entrenched across the
Northern Plains over the next several days...

...Heavy snows likely across the Northern Rockies, Washington Cascades and
Olympic Range...

...Arctic air to surge southward Wednesday and Thursday into the Central
to Southern Plains and Upper to Middle Mississippi Valley along with
dangerous wind chills...

..Heavy rains possible along the Central to Eastern Gulf Coast...

A very active weather pattern on tap for the upcoming holiday week across
large portions of the nation.  The greatest impacts early in the week will
be across the northwestern quarter of the nation from the Northern Rockies
into the  Northern Plains.  Arctic air will remain entrenched over the
next two days across the Northern Plains where high temperatures will
remain below zero across much of Montana, North Dakota, South Dakota and
most of Minnesota and morning low temperatures will be in the -10s to -30
degree range.  In addition to the brutally cold temperatures, dangerous
wind chill values of 35 to 55 degrees below zero are possible into the end
of the week across these areas. Wind chill warnings and advisories are
currently in effect across these areas for most of the week.  In addition
to the cold temperatures and dangerous wind chills, heavy snows are also
possible along the arctic front as it sinks southward through the Northern
Rockies.  Heavy snows also likely from the Washington Cascades into the
Olympic Range.

This arctic air will begin to surge to the southeast on Wednesday and
Thursday across the Central and Southern Plains and into the Middle to
Upper Mississippi Valley.  Very large temperature changes likely in the
wake of this arctic front with temperatures 35 to 40 degrees colder
Thursday than on Wednesday across the Central Plains.  Similar to areas
farther to the north, dangerous wind chill values will spread southward
with this arctic air, with wind chill watches up across all of the Central
Plains into portions of the Southern Plains.

For at least the first half of this week, above average temperatures
expected across the southern and eastern U.S. before the upstream arctic
air spreads east by the end of the week.  Heavy rains are possible Monday
night into Tuesday across the Central to Eastern Gulf coastal regions as
an area of low pressure moves eastward across the northern to eastern Gulf
of Mexico.
This animation shows how things may play out over the next 60 hours. To update click here.
| Temperature (Maximum or Minimum Anomaly) for Days 3 – 7 |
Precipitation (Five days of cumulative precipitation) |
| https://www.wpc.ncep.noaa.gov/medr/medr_mean.shtml | https://www.wpc.ncep.noaa.gov/qpf/day1-7.shtml |
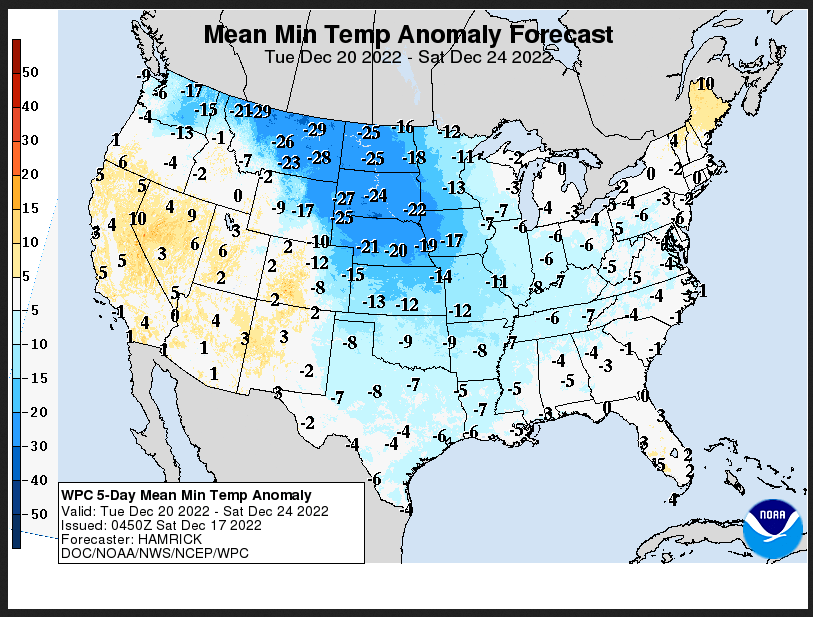
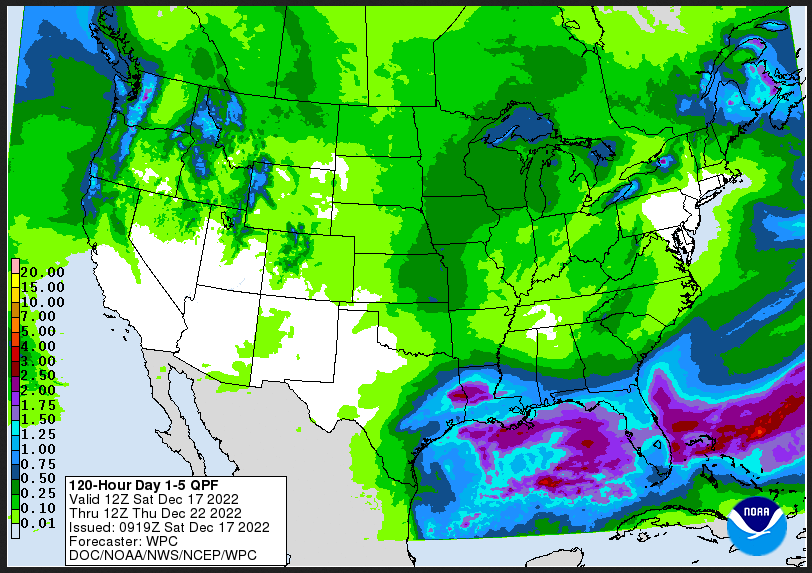
| Notice the warm minimums in the Great Plains in advance of a cold air intrusion. It is wet in most places in terms of the five-day cumulative. |
ATMOSPHERIC RIVERS
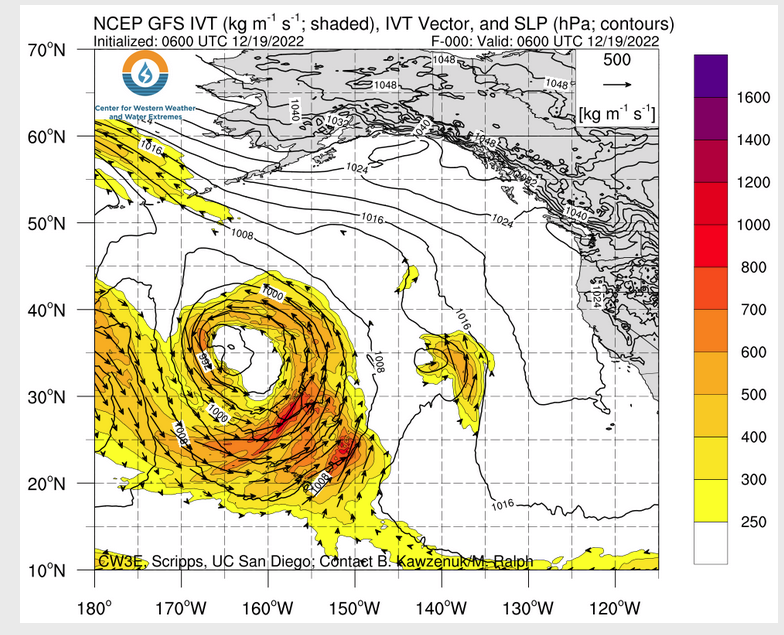 Click HERE to update. Here is some useful information about Atmospheric Rivers.
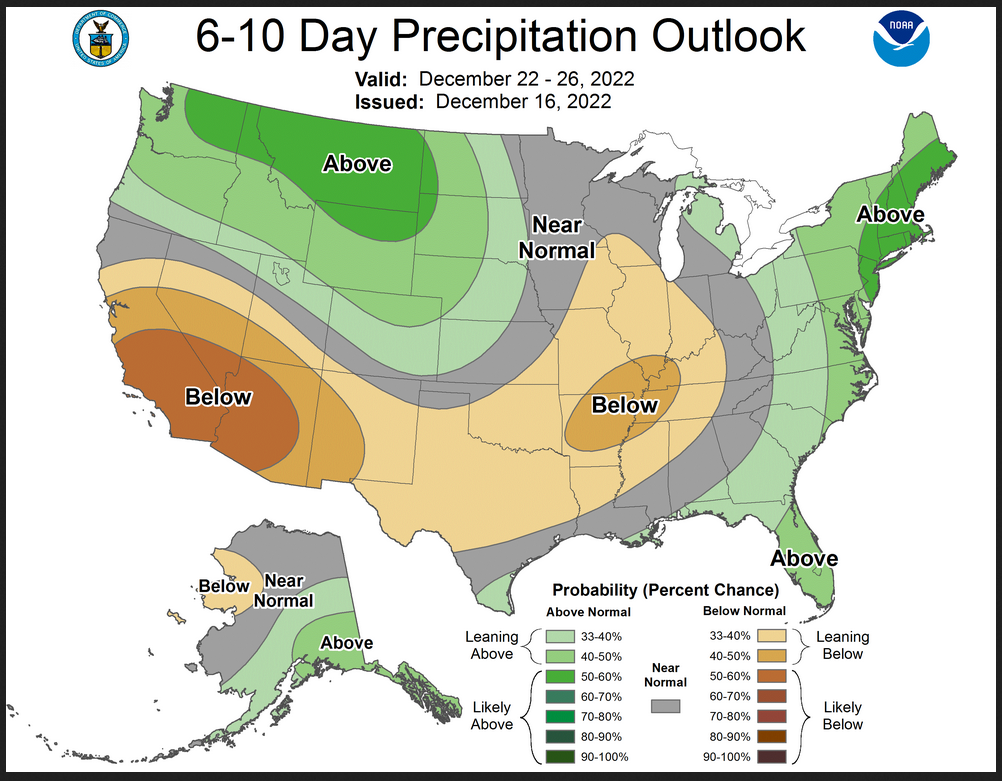
Now we look at Intermediate-Term “Outlook” maps for three time periods. Days 6 – 10, Days 8 – 14, and Weeks 3 and 4. An outlook differs from a forecast based on how NOAA uses these terms in that an “outlook” presents information as deviation from normal and the likelihood of these deviations.
I have provided the maps so you do not need to click to get them. But they do not update daily. But you can get the current images simply by clicking on the links provided. Then hit the return arrow at the upper left of your screen to return to the article. There is no need to do that right away since what is published today is up to date as of the original publish date so they can be updated during the weekend if you want. It is probably not necessary to do that. The Week 3 – 4 Outlook only updates on Fridays.
Below are the links to obtain updates and additional information. They are particularly useful if you happen to be reading this article significantly later than when it was published. I always try to provide readers with the source of the information in my articles.

 –
–
| Look at that cold air anomaly! Two connected dry areas. |
Looking at Weeks 8 – 14 Day
Now Precipitation
| Cold air moderates a bit. The dry areas remain in the same place. |
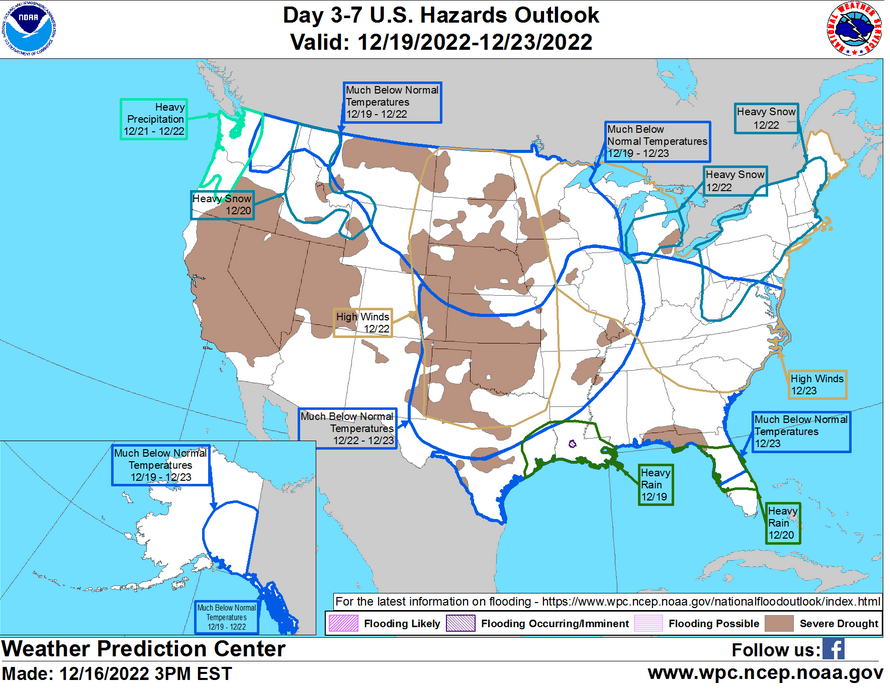
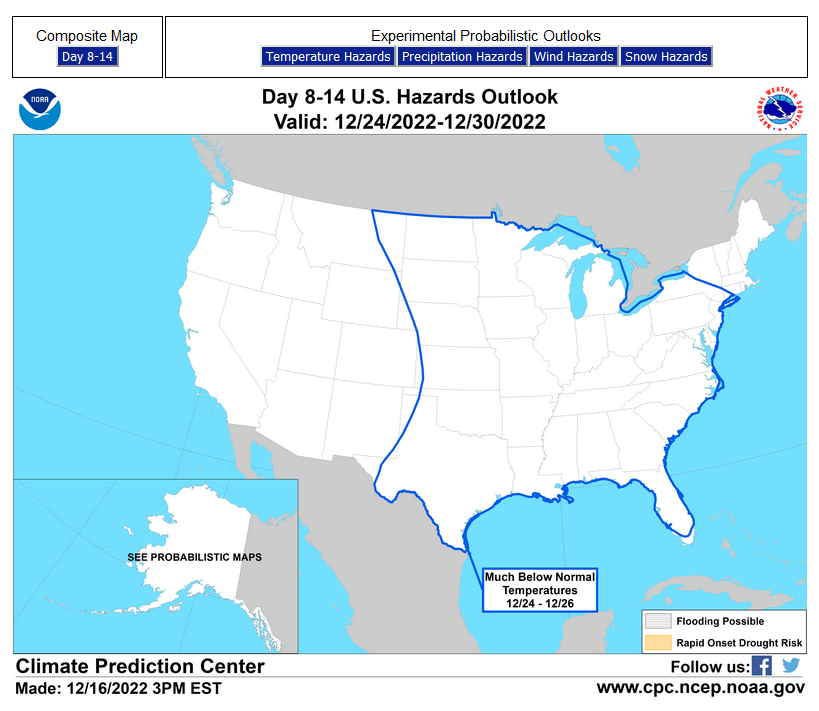
HAZARDS OUTLOOKS
Click here for the latest complete Day 3 -7 Hazards forecast which updates only on weekdays. Once a week probably Monday or Tuesday I will update the images. I provided the link for readers to get daily updates on weekdays. Use your own judgment to decide if you need to update these images.
Now we address Weeks 3 and 4. This is a time frame that is very important. It is half of the 28-Day forecast period. That is why we include the discussion that accompanies the maps.
–
Warming from the west. Precipitation assumes a north/south divide. –
Here is the discussion releases with the maps.
La Niña conditions are currently present with below average sea surface temperatures (SSTs) across most of the tropical Pacific Ocean. Low-level easterly wind anomalies were evident across most of the equatorial Pacific Ocean, while upper-level westerly wind anomalies were observed over most of the equatorial Pacific. The Real-time Multivariate Madden Julian Oscillation (RMM) index indicates an eastward propagation of the intraseasonal signal and potential Rossby wave interference in the last week. Over the next two weeks, dynamical models depict a weaker MJO signal. The Week 3-4 Temperature and Precipitation Outlooks are based primarily on operational dynamical guidance including the GEFSv12, CFSv2, ECMWF, JMA, and experimental guidance from the Subseasonal Experiment (SubX) multi-model ensemble (MME) prediction systems, with additional considerations for Madden Julian Oscillation (MJO) states, the El Niño Southern Oscillation (ENSO), decadal climate trends, and the evolution of the pattern from the Week-2 forecast .
Dynamical model 500-hPa height anomaly forecasts during Week 3-4 show a consistent evolution from the Week-2 forecast. A blend of the CFSv2, ECMWF, and GEFSv12 500-hPa height pattern forecast, plus a small contribution from the Multivariate Linear Regression (MLR) height forecast based on the RMM index, La Niña, and decadal trends, predicts an anomalous trough over the eastern CONUS. Anomalous ridging and positive 500-hPa height anomalies are also forecast over the western CONUS. Troughing with below-normal 500-hPa heights are predicted over the Aleutians and mainland Alaska, while above-normal 500-hPa heights are forecast over the Alaskan Panhandle. Most dynamical guidance features above normal 500-hPa heights over the Hawaii islands.
The Week 3-4 Temperature Outlook favors enhanced probabilities of above normal temperature over the western and central CONUS and is consistent with a forecast ridging pattern over the western CONUS. The highest probability of above normal temperatures (70-80%) are forecast for the Alaska Panhandle beneath a strong anomalous ridge. Elevated probabilities of above normal temperature are also favored for parts of Maine, where decadal trends and dynamical guidance support a tilt toward above normal temperature. Enhanced probabilities of below normal temperatures are favored over most of the eastern CONUS under a predicted mean troughing pattern and below normal 500-hPa heights. Elevated probabilities of above normal temperature are indicated over Alaska as indicated by most dynamical model forecast tools (ECMWF, CFS, GEFS and JMA).
The Week 3-4 Precipitation Outlook favors above median precipitation over the Pacific Northwest and toward the Northern Rockies to the western Northern Plains, consistent with most of the dynamical precipitation forecast tools. Increased probabilities of above normal precipitation are also favored for parts of the northeastern CONUS in association with the troughing predicted over the region. Enhanced probabilities of near to below median precipitation over the southern tier of the CONUS is supported by most model guidance. Troughing over the Aleutian Islands favors increased onshore flow over Alaska, leading to increased probabilities for near to above normal precipitation.
Above-average sea surface temperatures are currently observed in the vicinity of Hawaii.The SubX MME probabilistic temperature forecast favors above average temperatures over Hawaii during the Week 3-4 outlook period. Dynamical model guidance from the SubX MME shows increased probabilities for above median precipitation over Kahului and Honolulu, while EC is favored over Hilo and Lihue given inconsistent model signals.
–
| It is important to note that the Week 3 -4 Outlook is prepared by a different team than the 6 -10 and 8 – 14 day Outlooks as well as the update of the monthly outlook. |
Month to Date Information (I have included it even though it only shows one day of information, next week it will show 8 days so to avoid confusion I included it but it is not very useful this week.)
Temperature month to date can be found at https://hprcc.unl.edu/products/maps/acis/MonthTDeptUS.png
Precipitation month to date can be found at https://hprcc.unl.edu/products/maps/acis /MonthPNormUS.png
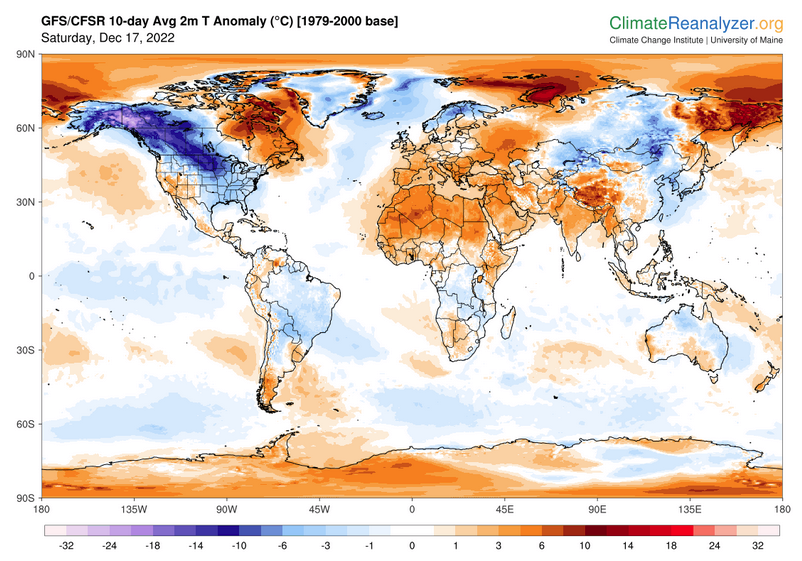
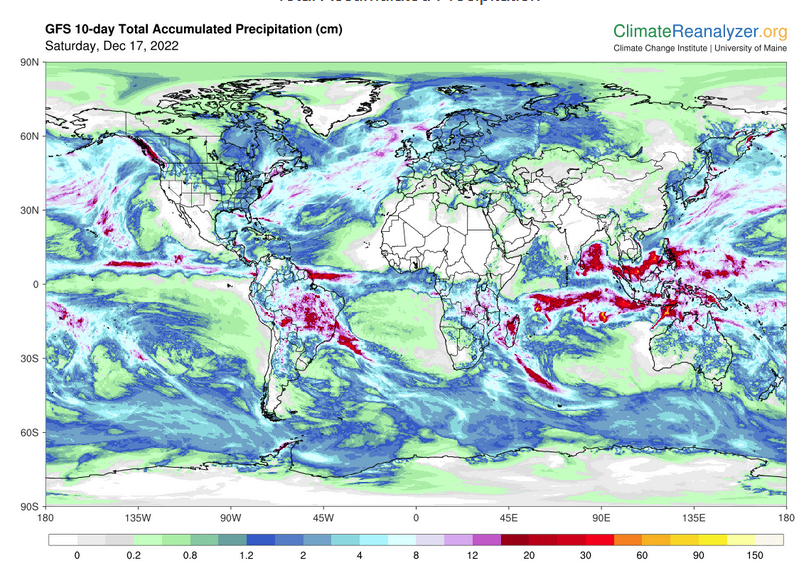
World Forecast
Below are the current precipitation forecast and the 10-Day forecasts for temperature and precipitation. Updates and additional information can be obtained HERE
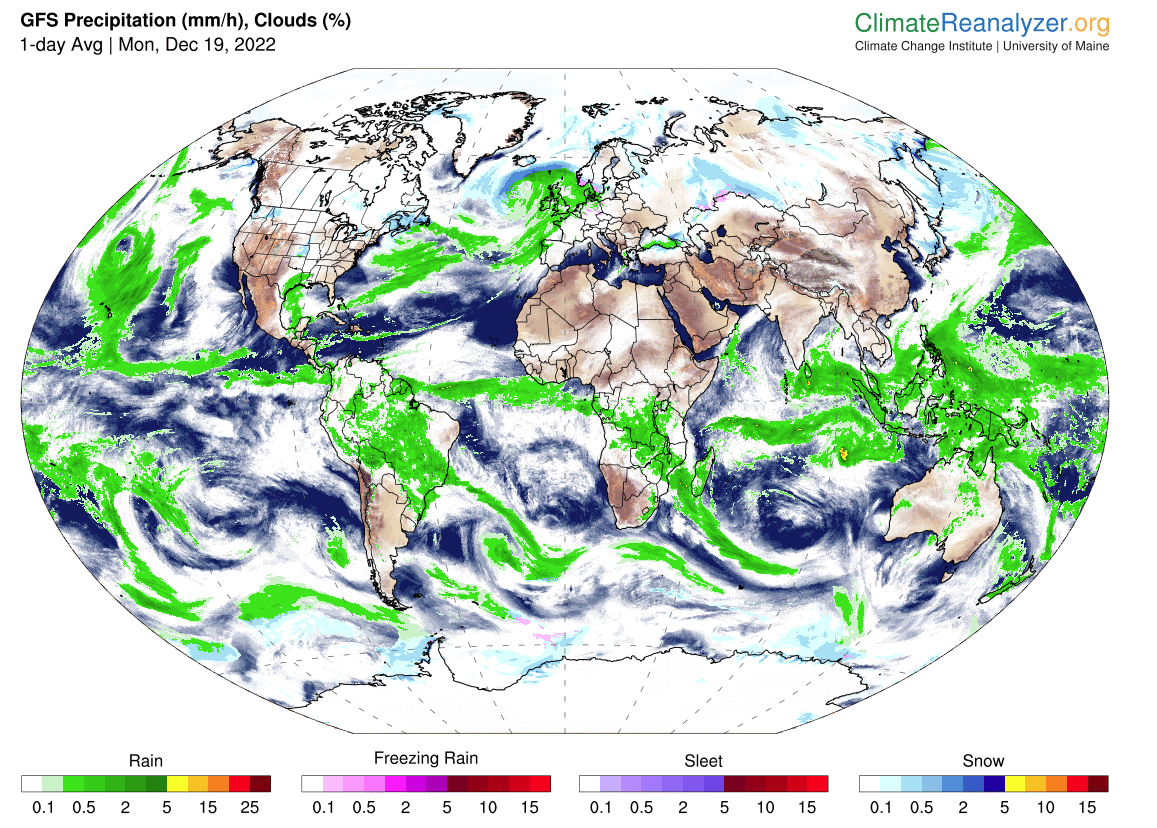
. Much of this information is provided by the University of Maine. They draw upon many different sources.
Worldwide Tropical Forecast (This is a NOAA Product)
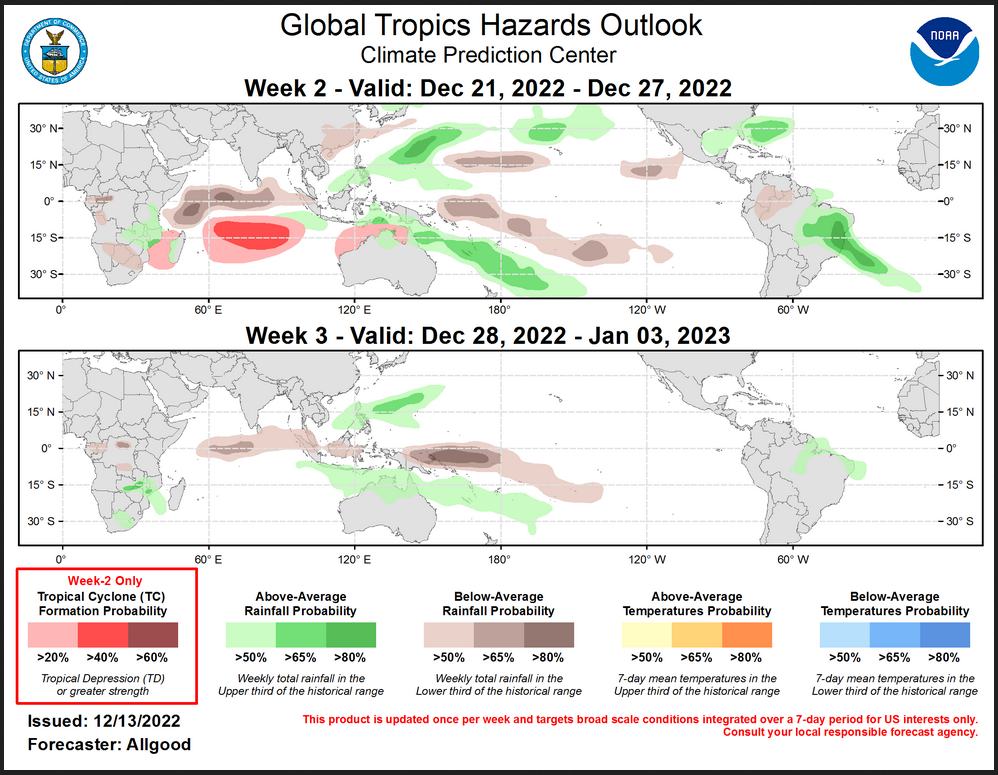
This graphic updates on Tuesdays) If it has not been updated, you can get the update by clicking here Readers will only have to do that if they are reading this article much later than the date of it being published.
| I hope you found this article interesting and useful. |