Updated at 4:40 p.m. EST on December 5, 2022
Once a week we show many of the actual forecast maps not just provide the links to these maps. This makes it easier for the reader. Our report provides a separate forecast for Days 1 and 2, Days 1-5, Days 6 -10, Days 8 – 14, and weeks 3 and 4. We also include a next-day and 10-Day Global Average Temperature and Cumulative Precipitation Forecast. This provides information that is useful to readers in terms of planning their activities for the weekend and the next 28 days. I will update the article with more recent short-term forecasts: Saturday through Monday
We see the expected movement of cold air from west to east of the pattern described in our prior Friday article and perhaps the area impacted shrinking in Weeks 3 and 4. It is quite similar to the overall Outlook predicted when the December Outlook was updated on Wednesday. Precipitation is expansive at first but the southern tier drought pattern gets started in Weeks 3 and 4. We had concerns about the 28-Day Outlook last week and did an experiment where we added the daily updates of the 6 – 10 and 8 – 14 day forecasts each day through Monday. We did not learn too much but I think we are seeing that the forecast last week may have been just a little bit early with its forecast as the flow seems smoother this week. But it may be that they actually nailed it last week. The maps are easy to read. But the maps reflect compromises by the forecasters. They are dealing with conflicting results from their various tools. But they can only produce one map (or that is all they issue). There is a discussion for the 6 – 10 day and 8 – 14 day maps but I do not include them to keep the size of the article reasonable. The links provided would take you to those discussions except on weekends as they are not issued on weekends. I could update those maps on Mondays (like I did last week) but it is a lot of work for me and most readers would not come back on Monday to see the comparison and I am not always available to do an update when NOAA issues their Monday version of the maps with their discussions until later in the day. But the links are there for the curious.
When we publish on Friday night, it provides a 28-day view of the future. What is important is that this is a longer-term view than one that is typically available in the Media and online. The amount of information about weather provided to the general public is quite limited. It is available to the public. But most do not have the time or level of interest to seek it out. My articles are at an intermediate level between what is generally available from the Media (ten-day forecasts and a good explanation for the first couple of days and the information used by meteorologists to produce these forecasts for general distribution. So I focus on longer timeframes and more depth into why the forecasts are what they are.

We will be doing selected updates all weekend. Links are generally provided so the reader can update any of the graphics themselves (plus often you will end up with a lot of additional information).
–
This weekend you can again also look at the recent NOAA End of Month update of the December Outlook. That report can be accessed HERE.In many ways, the Friday 28-Day Outlook is more useful than the Monthly Update especially when it is published within a few days of the next Month’s Outlook. It is more up-to-date and provides more detail in terms of dividing the month into a number of different time periods, but the End of Month Outlook contains other very useful information. It is best to look at both even though there is a lot of overlap. Later in the month, the 28-Day outlook really overrides the end of monthly Outlook because it is more up-to-date. Forecasting is a process and NOAA has a pretty good system for issuing updates on a regular basis with three major Updates during the month namely: A. The Update on the status of ENSO which is issued on the Second Thursday, B. The new Four-Season Outlook which also included the Mid Month outlook for the subsequent month C. The End-of-Month Outlook issued on the last day of the month contains the updated Outlook for the Subsequent Month plus a drought outlook for the Subsequent month. I add a lot of additional information in my article reporting on what NOAA issues at the end of the Month. |
48-Hour Forecast
Maps that relate the forecast to geography can be updated by clicking Here for Day 1 and Here f or Day 2. I will be doing the updating during the period described in the title of the article but if you happen to read this article later you can get updates via the links provided.
Monday

Tuesday
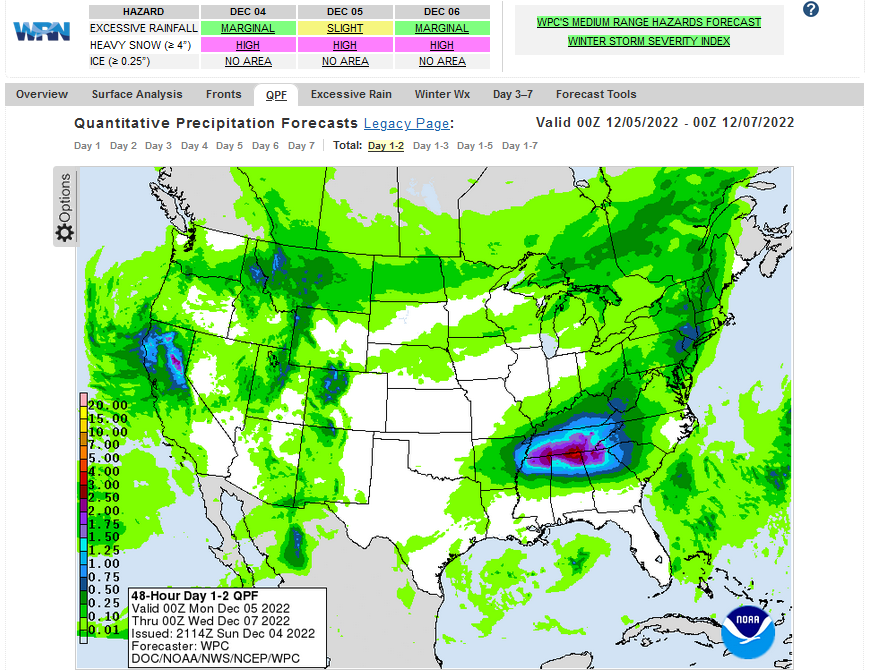
Below is the current two-day cumulative forecast of precipitation (Updates can be found HERE) Later we show a similar map that shows five days of cumulative precipitation. The images in the article are frozen but notice that if you go to the link provided you can get a variety of forecasts. That is true for many of the links provided in this article.
Here is the NWS Short Range Forecast (It is updated by NWS twice a day (a.m. and p.m) and these updates can be found here. We post at least one of those updates daily, over the weekend we usually post both.
Short Range Forecast Discussion
NWS Weather Prediction Center College Park MD
216 PM EST Mon Dec 05 2022

Valid 00Z Tue Dec 06 2022 - 00Z Thu Dec 08 2022

...Heavy rain and isolated flash flooding possible from the Southern
Appalachians/Tennessee Valley region into the Lower Mississippi Valley...

...Much above average temperatures on tap from the Central and Southern
Plains, eastward into the east.  Below average temperatures expected
across areas west of the Rockies and across the Northern Plains...

...Accumulating snows possible across the Northern Plains and through
portions of the Rockies...

There is a heavy rain threat with isolated flash flooding over the next
few days across a large portion of the nation from the Southern
Appalachians/Tennessee Valley region, west southwestward into the Lower
Mississippi Valley.  A slow moving surface frontal boundary
will remain across these areas for the next few days, helping to pool
above average levels of moisture near this front, supporting  heavy rains
and the potential for isolated flash flooding.  The first round of
potentially heavy rains along this front will be from this afternoon into
early Tuesday across the Tennessee Valley into the Southern Appalachians.
This will be followed by a second round of heavy rain developing Wednesday
from the Southern Plains, across the Lower Mississippi Valley and into the
Tennessee Valley.  Portions of these regions have had above average
precipitation over the past few weeks, resulting in increasingly saturated
soils, with heavy rain potential on these saturated soils increasing the
flash flood threat.  While not as heavy as across the above mentioned
regions, wet weather also likely from the Mid-Atlantic into the Northeast
during Tuesday and Wednesday.

The overall pattern supporting the wet weather from the Southern Plains
into the Northeast will also support much above average temperatures over
the next few days from the Central to Southern Plains, eastward into the
east.  A few record high minimum temperatures possible Tuesday morning
across the Lower Mississippi Valley, with a  much more expansive area of
potentially record high minimum temperature possible Wednesday morning
across portions of the Southern Plains, Lower Mississippi Valley,
Tennessee Valley, Mid Atlantic and northeast.

Below average temperatures over the next few days are expected across
areas west of the Rockies and across the Northern Plains.  The greatest
below average temperatures are expected across the Northern Plains where
arctic air will keep temperatures 15-20 degrees below average from eastern
Montana, across the Dakotas and into Minnesota. There are, however, not
expected to be any record cold temperatures across this region over the
next two days.  This area will also see the threat of periods of
accumulating snows over the next two days.  Amounts are not expected to be
very heavy, generally in the 1 to 4 inch range. The heaviest snows over
the next few days expected through the Rockies of Colorado, northwest
Montana and northern Idaho where totals in excess of a foot are possible
This animation shows how things may play out over the next 60 hours. To update click here.
| Temperature (Maximum or Minimum Anomaly) for the next five days | Precipitation (Five days of cumulative precipitation) |
| https://www.wpc.ncep.noaa.gov/medr/me dr_mean.shtml | https://www.wpc.ncep.noaa.gov/qpf/day1-7.shtml |
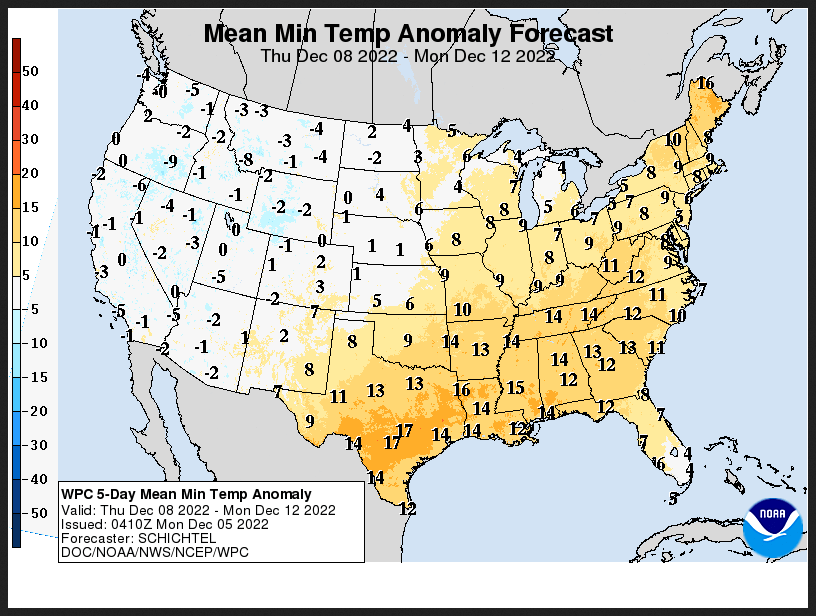
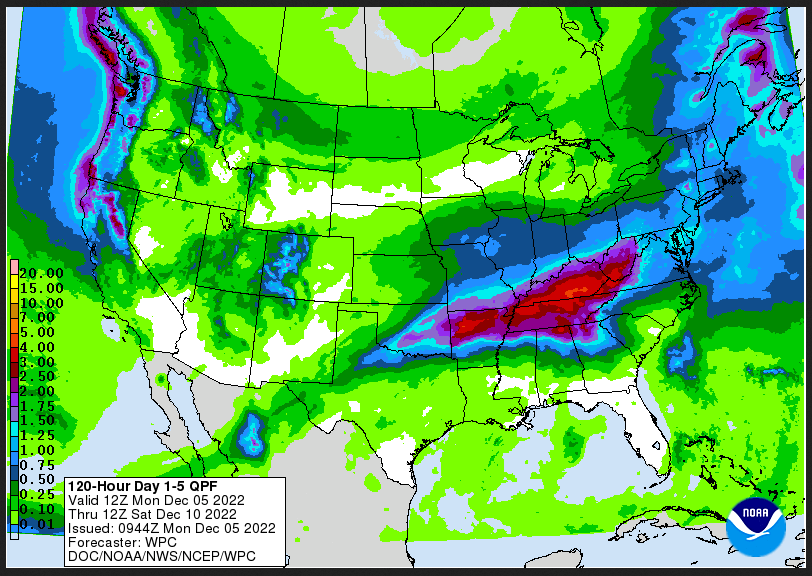
| The area of above-normal minimum temperatures is dramatic. Precipitation entering the Northwest and again impacting the Gulf Coast but more to the east than in recent days and more inland than in recent days. |
ATMOSPHERIC RIVERS
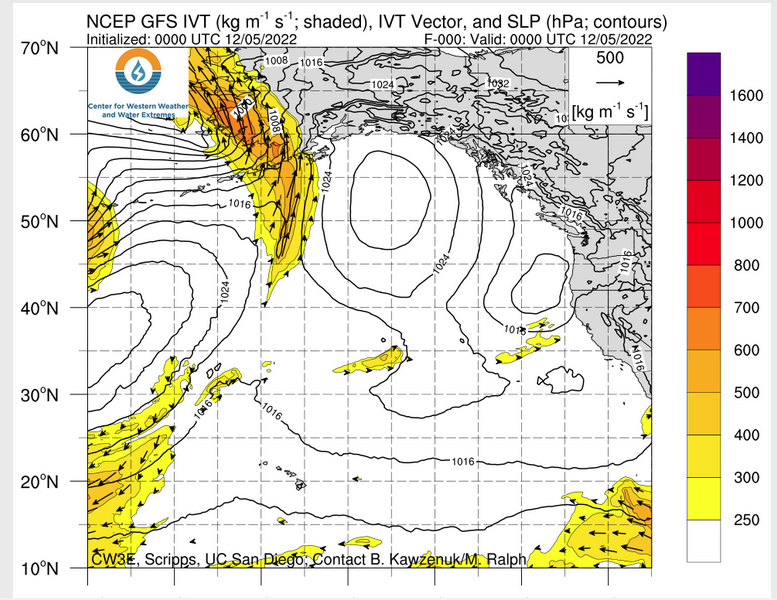
Click HERE to update. Here is some useful information about Atmospheric Rivers.
Now we look at Intermediate-Term “Outlook” maps for three time periods. Days 6 – 10, Days 8 – 14, and Weeks 3 and 4. An outlook differs from a forecast based on how NOAA uses these terms in that an “outlook” presents information as deviation from normal and the likelihood of these deviations.
I have provided the maps so you do not need to click to get them. But they do not update daily. But you can get the current images simply by clicking on the links provided. Then hit the return arrow at the upper left of your screen to return to the article. There is no need to do that right away since what is published today is up to date as of the original publish date so they can be updated during the weekend if you want. It is probably not necessary to do that. The Week 3 – 4 Outlook only updates on Fridays.
Below are the links to obtain updates and additional information. They are particularly useful if you happen to be reading this article significantly later than when it was published. I always try to provide readers with the source of the information in my articles.
–
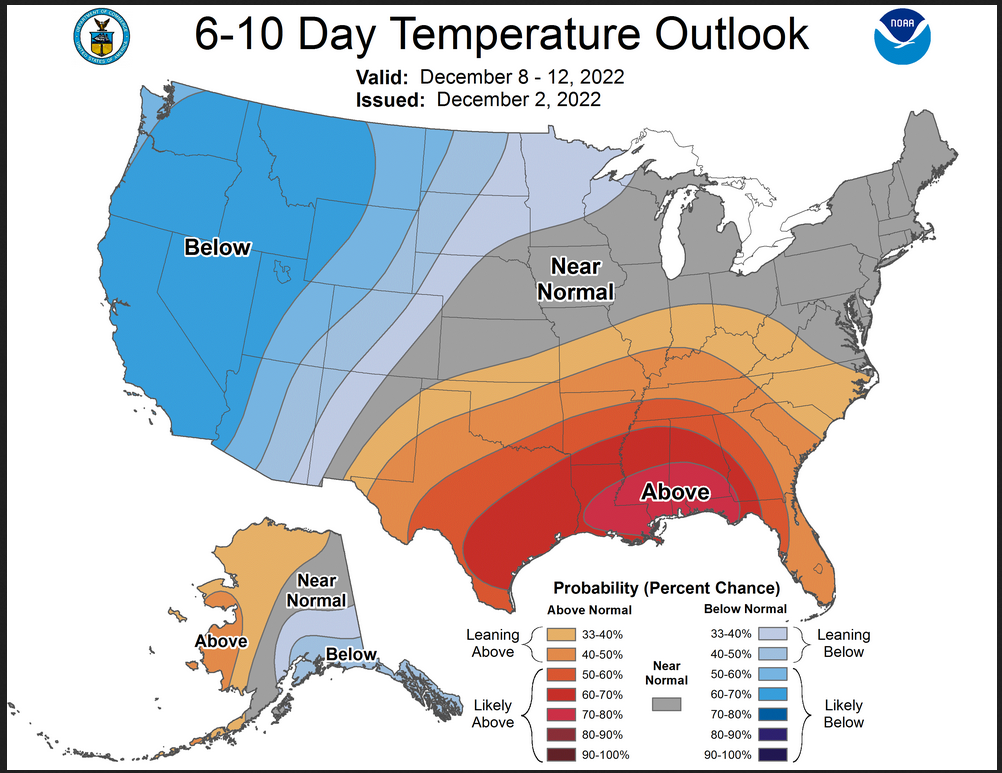
| This seems to be a continuation of the pattern that has been in place for while. We expect that pattern to change in the second half of the month. |
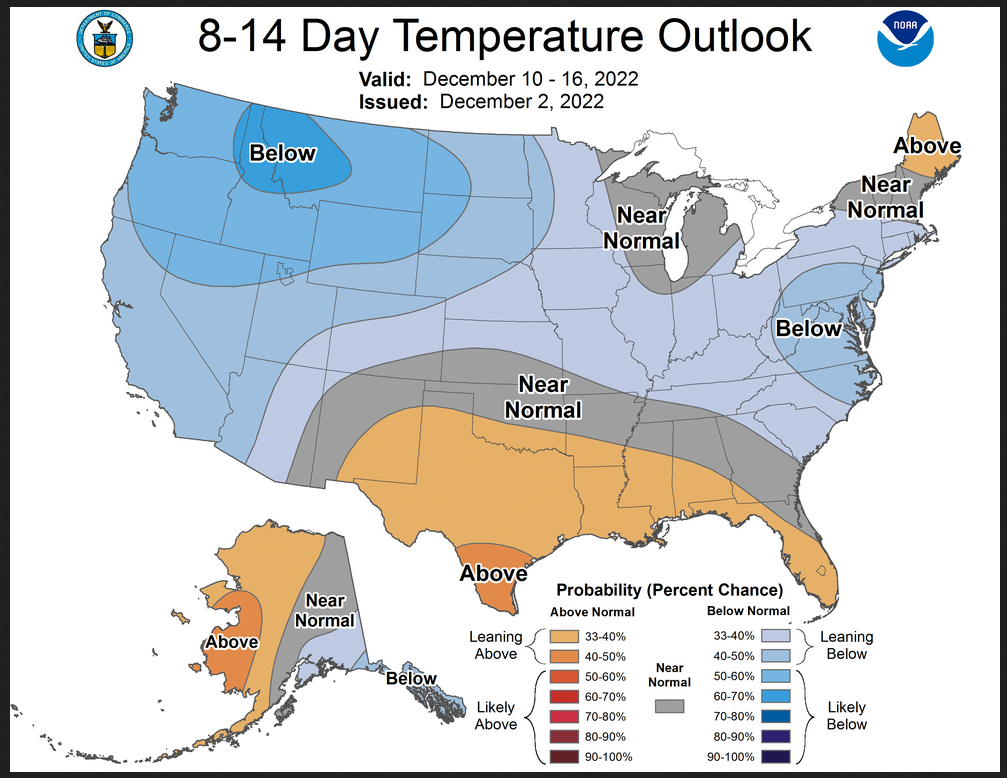
Looking at Weeks 8 – 14 Day
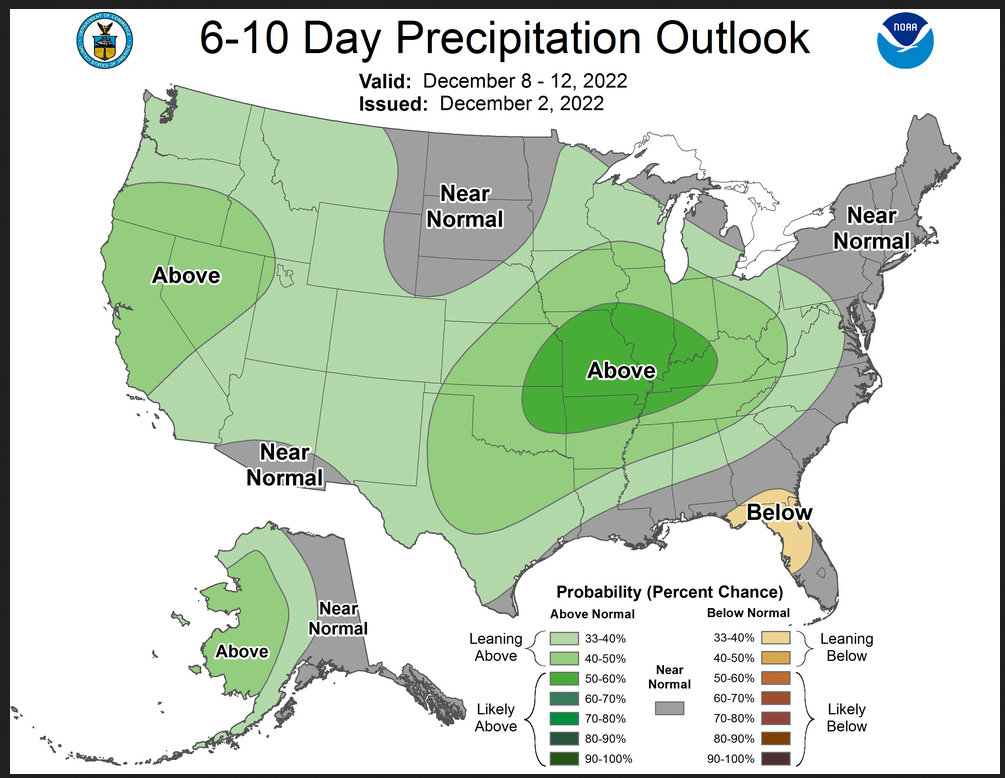
Now Precipitation
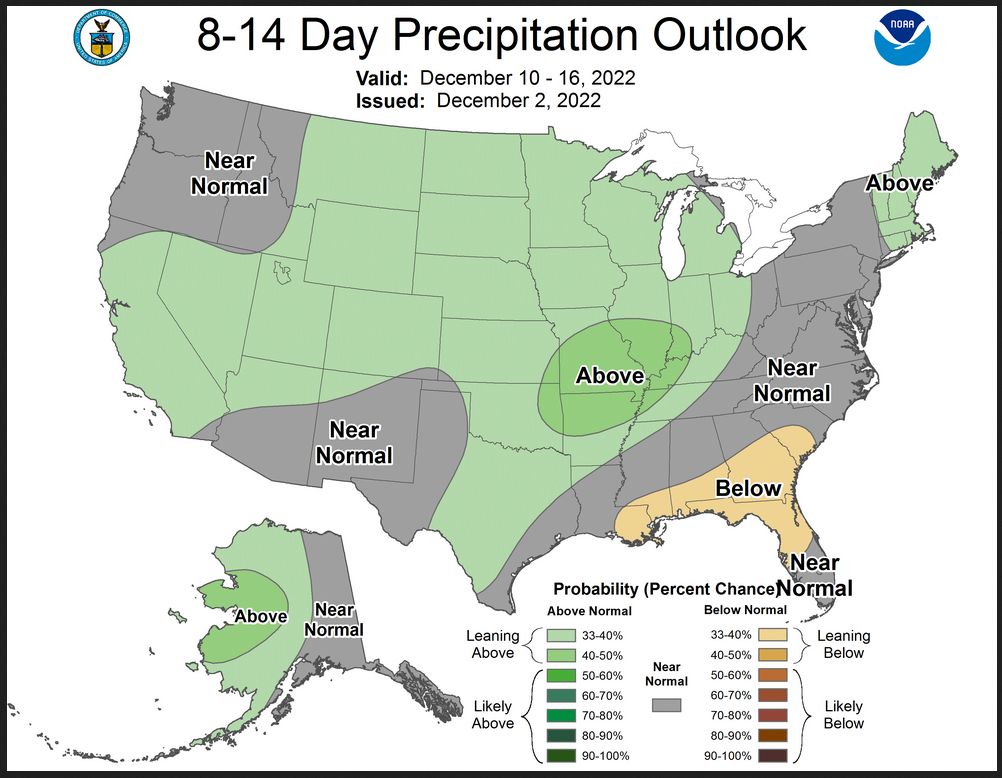
| The cold air extends east and the precipitation pattern slowly becomes less wet. |
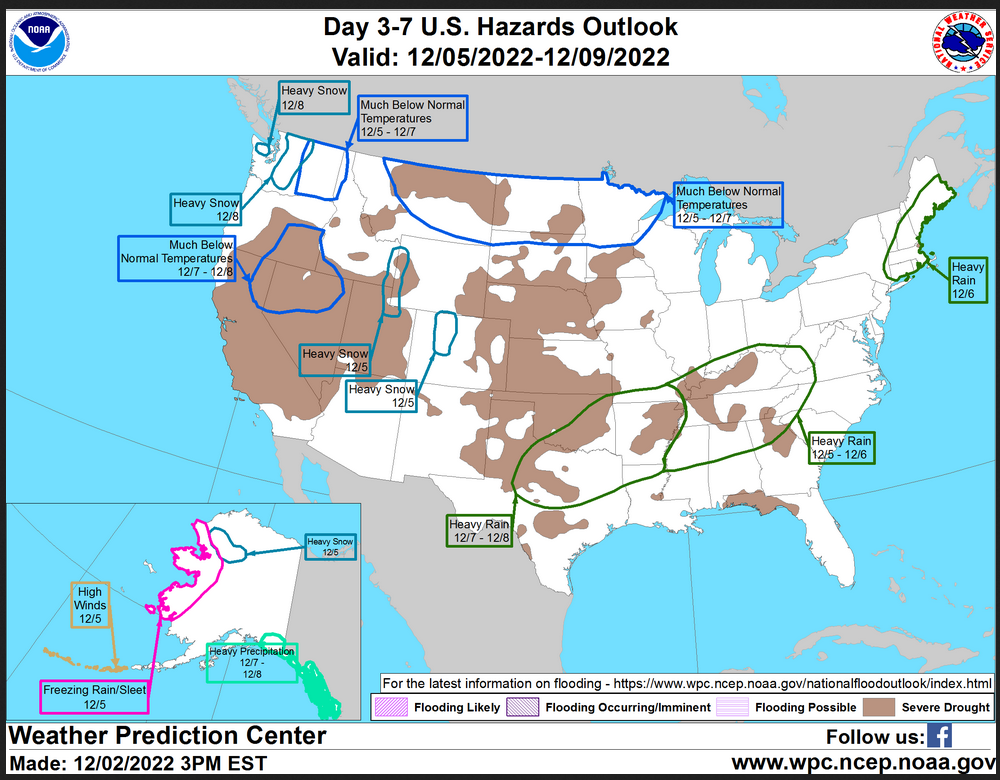
HAZARDS OUTLOOKS
Click here for the latest complete Day 3 -7 Hazards forecast which updates only on weekdays. Once a week probably Monday or Tuesday I will update the images. I provided the link for readers to get daily updates on weekdays. Use your own judgment to decide if you need to update these images.
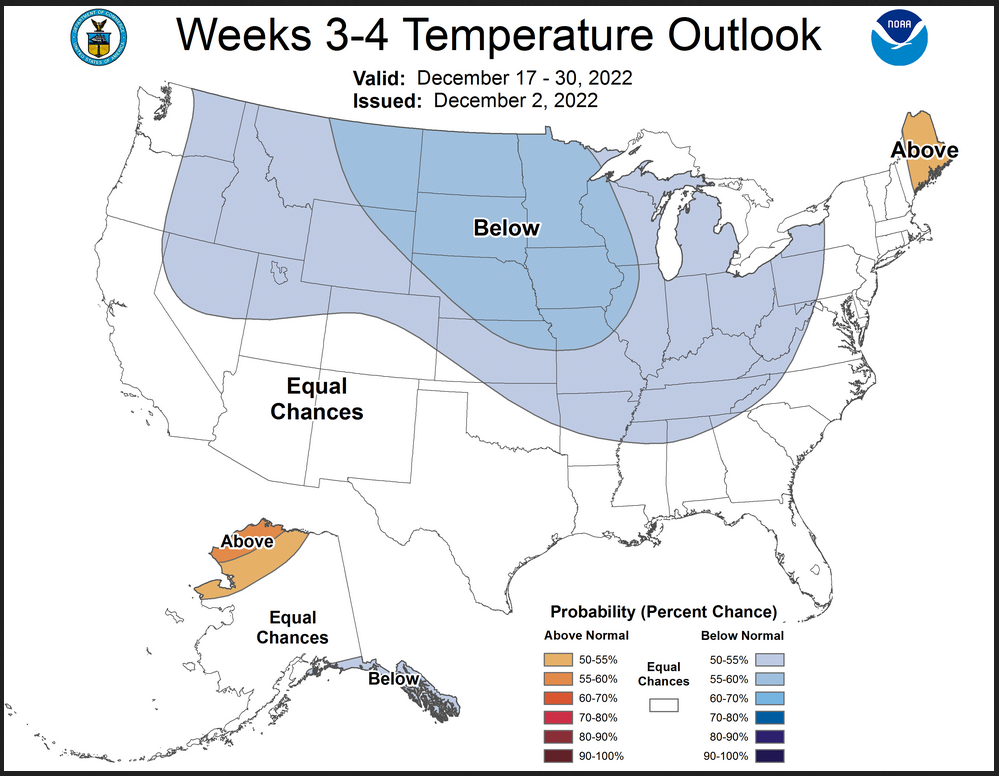
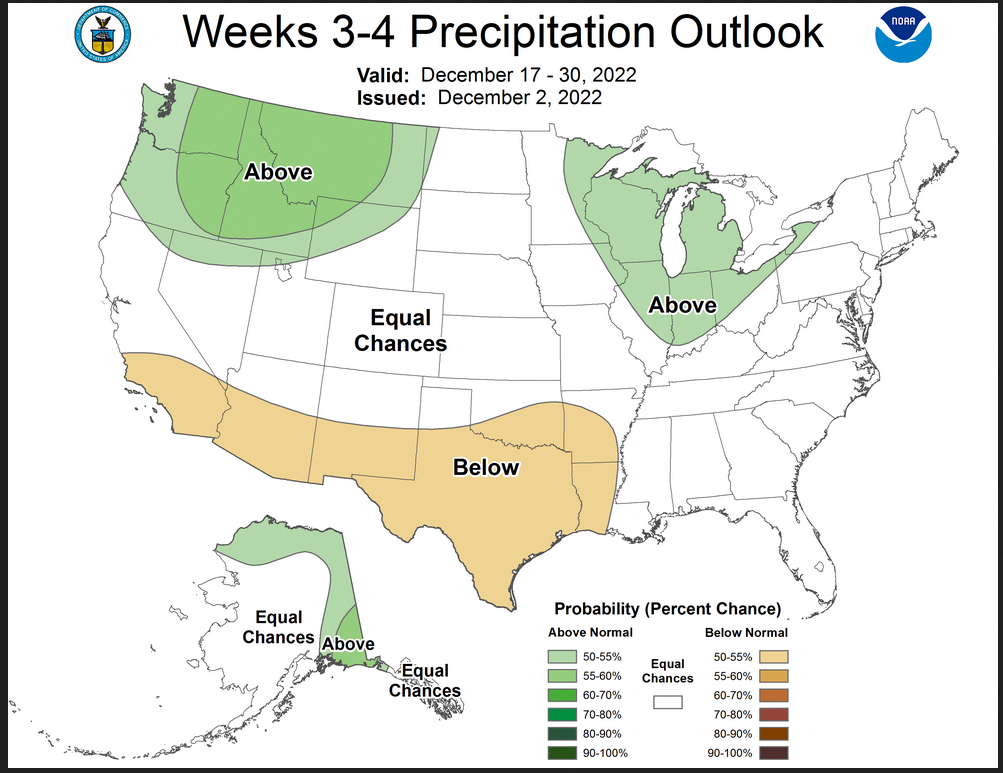
Now we address Weeks 3 and 4. This is a time frame that is very important. It is half of the 28-Day forecast period. That is why we include the discussion that accompanies the maps.
–
The cold air intrusion receded a bit and the pricted southern tier drought begins to materialize. –Prognostic Discussion for Week 3-4 Temperature and Experimental Precipitation Outlooks
NWS Climate Prediction Center College Park MD
300PM EST Fri Dec 02 2022Week 3-4 Forecast Discussion Valid Sat Dec 17 2022-Fri Dec 30 2022
Dynamical model guidance broadly agrees on an amplified wave-like pattern in the anomalous 500-hPa height field that features a ridge over the North Pacific Ocean followed by a trough over CONUS and a ridge centered west of Greenland. Some features of this wave train resemble a negative Arctic Oscillation (AO) teleconnection pattern, which is forecast to remain in a negative phase for the next two weeks leading up to the forecast period. Across the guidance for the anomalous 500-hPa height field there are also indications of a negative North Atlantic Oscillation (NAO) as well as a negative Pacific North American (PNA) teleconnection pattern, though the latter is trending neutral. In addition to these teleconnection signals, this forecast is influenced by the climate signals from the persisting La Niña conditions in the Tropical Pacific Ocean. [Author’s Note: This is similar to the discussion from last week and again suggests a moderation of these external drivers]
A blend of dynamical and statistical guidance favor colder than normal temperatures across much of northern CONUS with a maxima in the North Central Plains. It is worth noting that the aforementioned anomalous troughing could usher in significantly cold air during the outlook period. The CFSv2 forecast indicates the strongest departures from average for a broad region of CONUS while the GEFSv12 keeps the coldest anomalies contained to the Northern Plains and the ECMWF has moderate below average anomalies across the northern tier of CONUS. The guidance disagrees on the westward and southward extent of cold temperatures. As noted, CFSv2 favors a colder 14-day averaged outlook across nearly all of CONUS including the West Coast and Southeast. ECMWF also indicates a colder than average outlook for much of CONUS but tilts toward a warmer than average outlook for the West Coast and Southwest. GEFSv12 agrees with ECMWF on a colder outlook for the North Central Plains and Tennessee Valley but is bullish with a warmer than average outlook for the Southern Plains, the Southwest and across the Rocky Mountains to the West Coast. Given the disagreement across model guidance, Equal Chances is forecast for the West Coast and southern tier of CONUS. Blended guidance has the strongest signals for above average temperatures along the North Slope in Alaska and a below average outlook along the Panhandle. However it should be noted that temperature guidance was mixed across the tools with some experimental tools indicating a warmer outlook state-wide for Alaska.
Blended guidance of dynamical and statistical models favors an above average precipitation outlook for the Northwest region as well as the Great Lakes region. Below average rainfall is forecast across the Southwest extending from southern California to Louisiana. Equal Chances for above or below precipitation is indicated for the East Coast where model probabilities are low and mixed. Above average rainfall is forecast for the northern and eastern most regions of Alaska.^M
The SubX multi-model ensemble forecast for Hawaii indicates strong probabilities of above-average temperatures and above-average rainfall for all islands.
| It is important to note that the Week 3 -4 Outlook is prepared by a different team than the 6 -10 and 8 – 14 day Outlooks as well as the update of the monthly outlook. |
Month to Date Information (I have included it even though it only shows one day of information, next week it will show 8 days so to avoid confusion I included it but it is not very useful this week.)
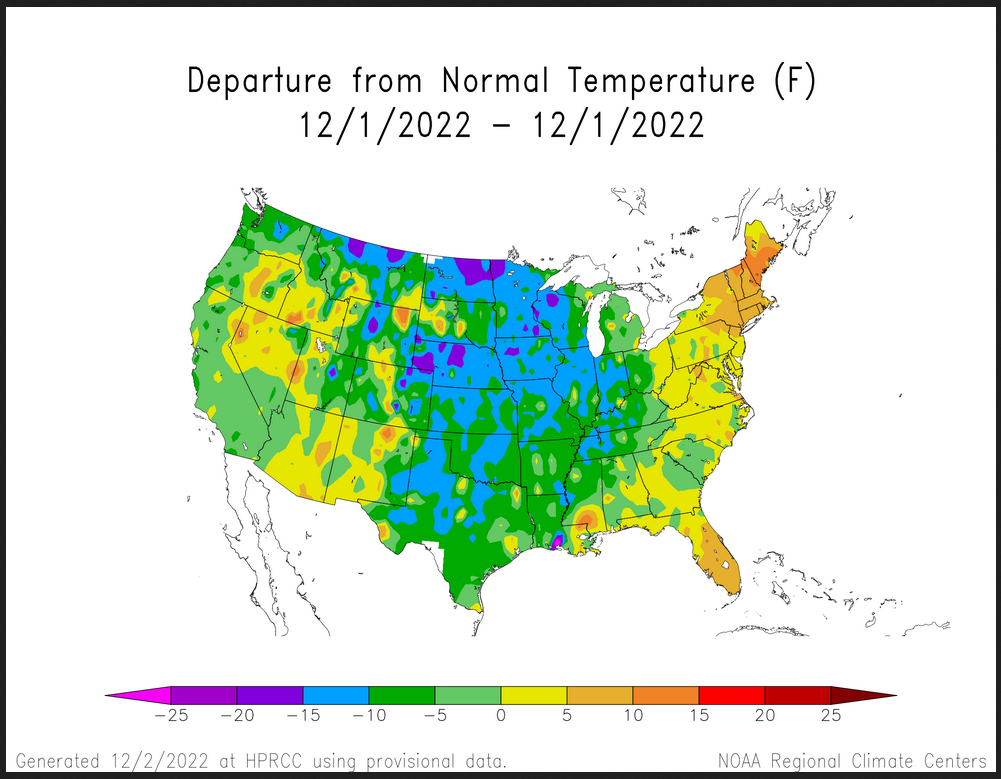
Temperature month to date can be found at https://hprcc.unl.edu/products/maps/acis/MonthTDeptUS.png
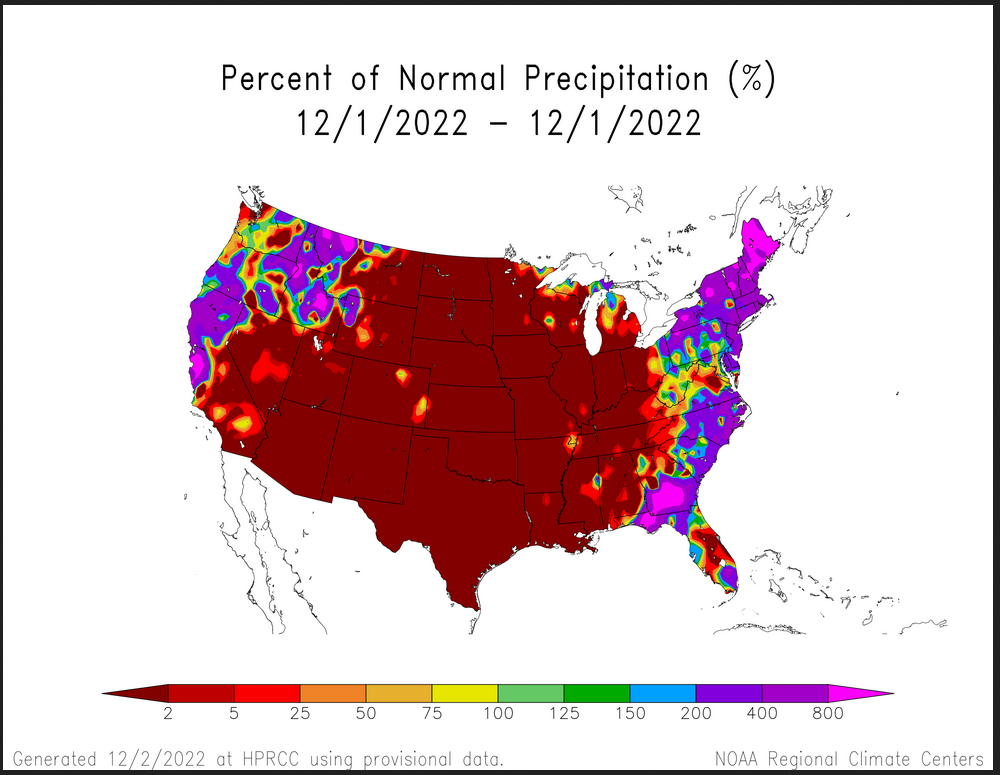
Precipitation month to date can be found at https://hprcc.unl.edu/products/maps/acis/MonthPNormUS.png
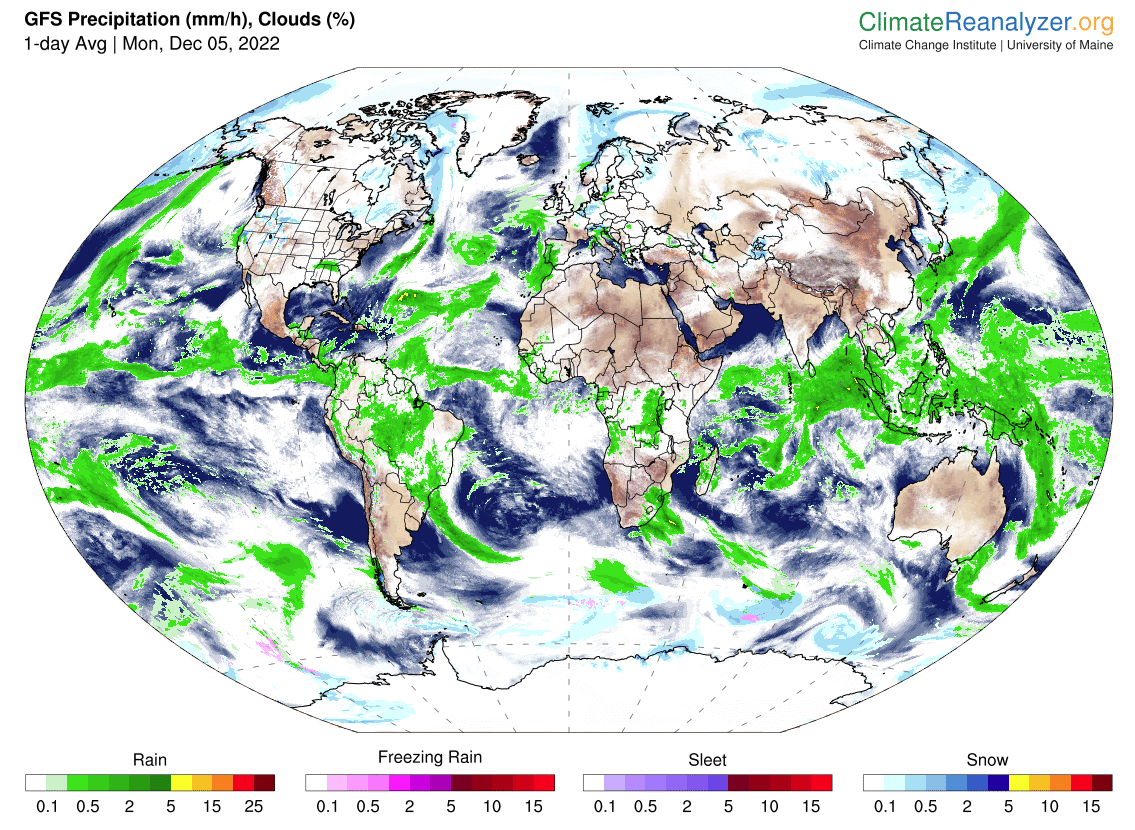
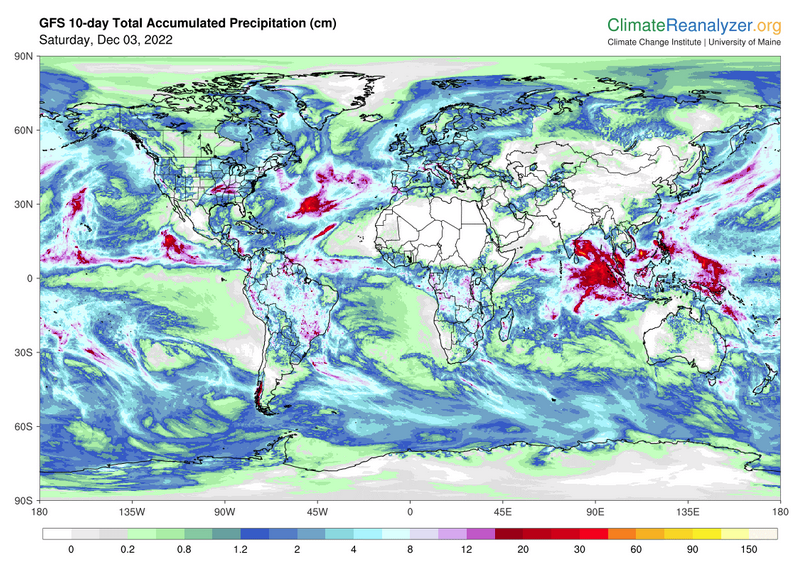
World Forecast
Below are the current precipitation forecast and the 10-Day forecasts for temperature and precipitation. Updates and additional information can be obtained HERE. Much of this information is provided by the University of Maine. They draw upon many different sources.
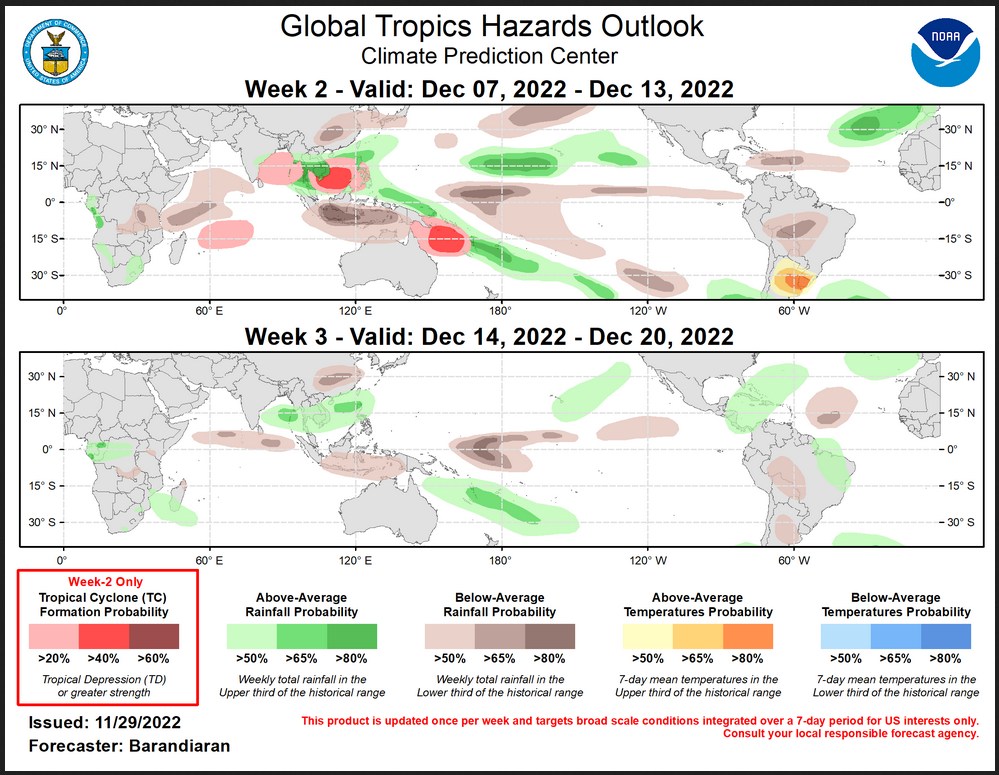
 Worldwide Tropical Forecast (This is a NOAA Product)
This graphic updates on Tuesdays) If it has not been updated, you can get the update by clicking here Readers will only have to do that if they are reading this article much later than the date of it being published.