Here is what we are paying attention to this evening and the next 48 hours from this evening’s NWS Forecast.
...Wintry precipitation will continue in northern New England through this
evening as a coastal low tracks northeast...

...Major lake effect snow event downwind of the Great Lakes likely to
begin tonight and continue through the weekend...

...Anomalous cold will continue for most of the CONUS through the end of
the week...

...Strong Santa Ana winds across southern California will relax tonight...
Continuation of the NWS Short Range Forecast (It is updated twice a day and these updates can be found here.
A coastal low continues to track northeast along the east coast while
intensifying. Widespread precipitation is expected to continue across New
England through this evening, with rain falling near the coast and a mix
of snow, sleet, and freezing rain falling at inland and high elevation
locations. Winter Weather Advisories and Winter Storm Warnings remain in
effect for northern Maine where the highest accumulations of wintry
precipitation are expected. In the warning area, storm total snow
accumulations could reach 6 to 11 inches and sleet accumulations could
reach up to one tenth of an inch. Precipitation will decrease from south
to north late tonight as the system pushes out of the region into the
Canadian Maritimes.

Behind the departing coastal low pressure system, cold west-northwesterly
flow will funnel into the Great Lakes region, triggering the start of a
likely significant lake effect snow event. Heavy snowfall downwind of the
lakes is expected to intensify tonight, and periods of heavy snow will
continue through the weekend. The most intense snowfall is expected to
occur Thursday and Friday and will be especially pronounced downwind of
lakes Erie and Ontario. At times, thunder and lightning may accompany
heavy snowfall with rates exceeding two inches per hour. Visibility will
drop to near zero at times and roadways will be covered with snow making
travel hazardous to nearly impossible. Snow accumulations in excess of 12
inches are likely in many locations east and southeast of the Great Lakes,
and several feet of snow will be possible with the heaviest snowfall in
the Buffalo, New York metro area and far northwest Pennsylvania. Lake
Effect Snow Warnings are in effect downwind of lakes Eerie and Ontario,
and Winter Storm Watches and Winter Storm Warnings are in effect downwind
of lake Michigan.

The next system to impact the CONUS will arrive Thursday as low pressure
tracks southeast across southern Canada towards the Great Lakes. This
system will bring another cold front southeast across the central U.S.
Thursday, then the front will push towards the East and Gulf Coasts on
Friday. This front will bring a chance of snow to the Great Plains and
heavy snow will be possible in the northern and central Rockies and nearby
High Plains. Cold arctic air will move in behind the front, continuing the
stretch of below normal temperatures across most of the CONUS. High
temperatures are forecast to be 10-20 degrees below normal for much of the
nation through Sunday. Sub-freezing highs will be common in the Central
U.S. Thursday through Saturday, and highs along the northern Gulf Coast
will struggle to reach the mid-to-upper 50s.

Impactful weather is expected to stay out of the West through the end of
the week, aside from the Santa Ana winds in southern California that will
begin to relax tonight. High winds warnings and Wind Advisories remain in
effect for portions of southern California and are set to expire this
evening. High pressure will remain in place across much of the region
through the day on Thursday, then a dry cold front will move south across
the region Thursday night and Friday. Strong high pressure will build
again after the frontal passage.
Current forecast of heavy precipitation (Updates can be found HERE)
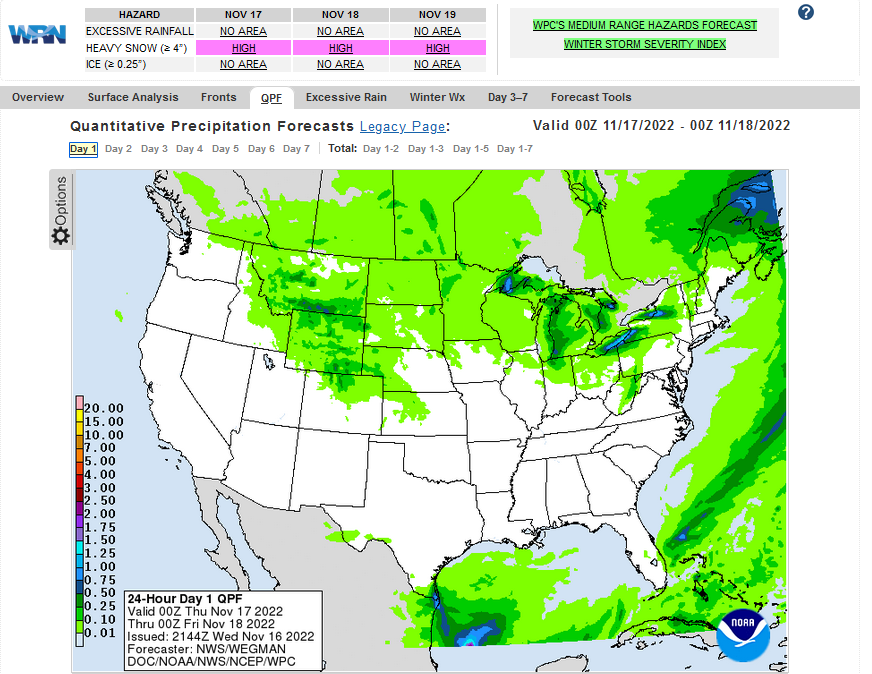
Maps that relate the forecast to geography can be found by clicking Here for Day 1 and Here for Day 2.
Here is a 60-hour animated forecast map that shows how the short-term forecast is expected to play out
If it needs to be updated click here.
ATMOSPHERIC RIVERS
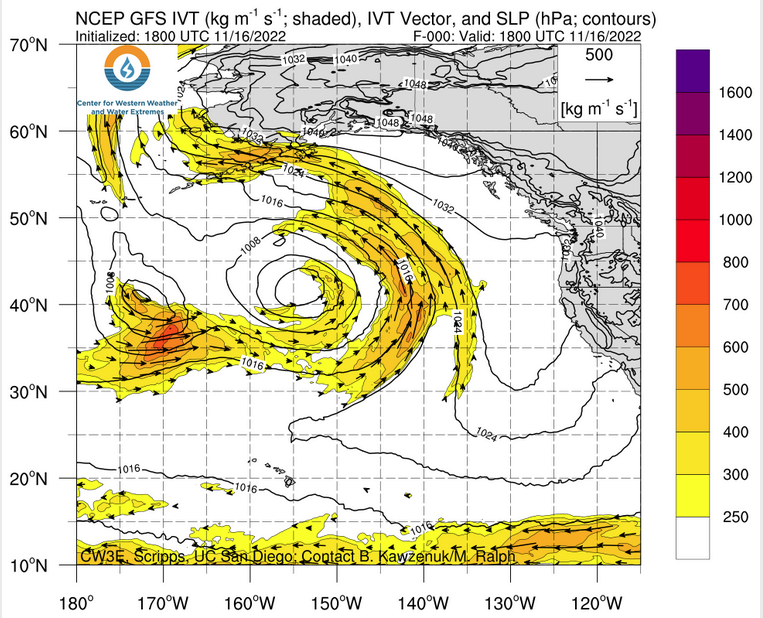
Click HERE to update. Here is some useful information about Atmospheric Rivers.
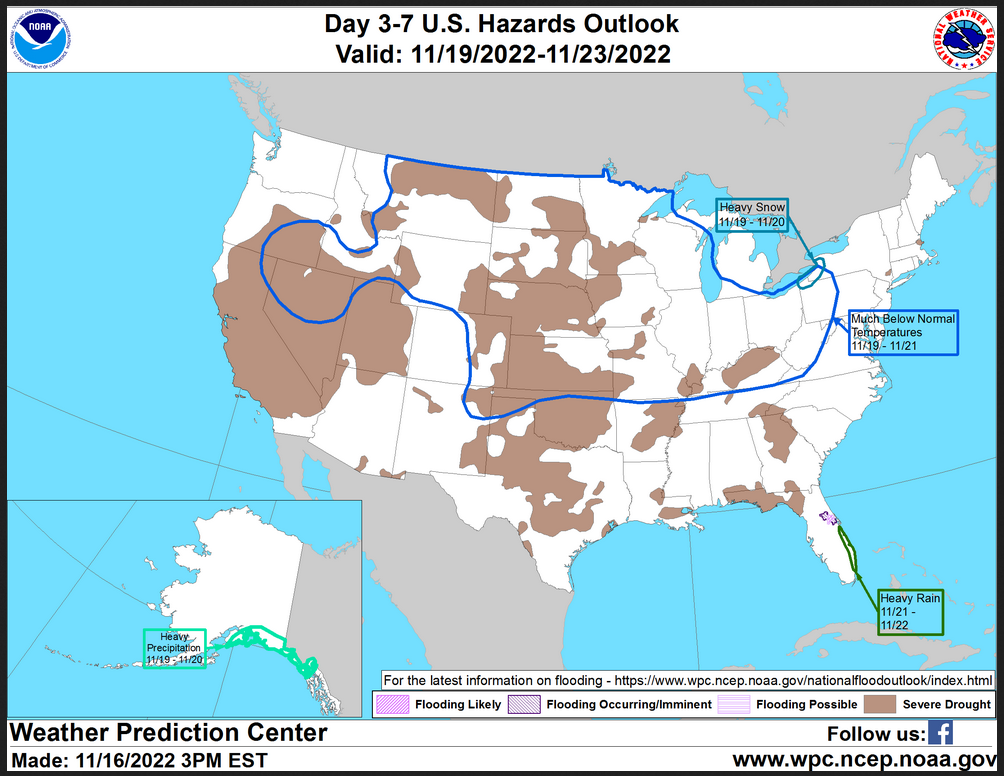
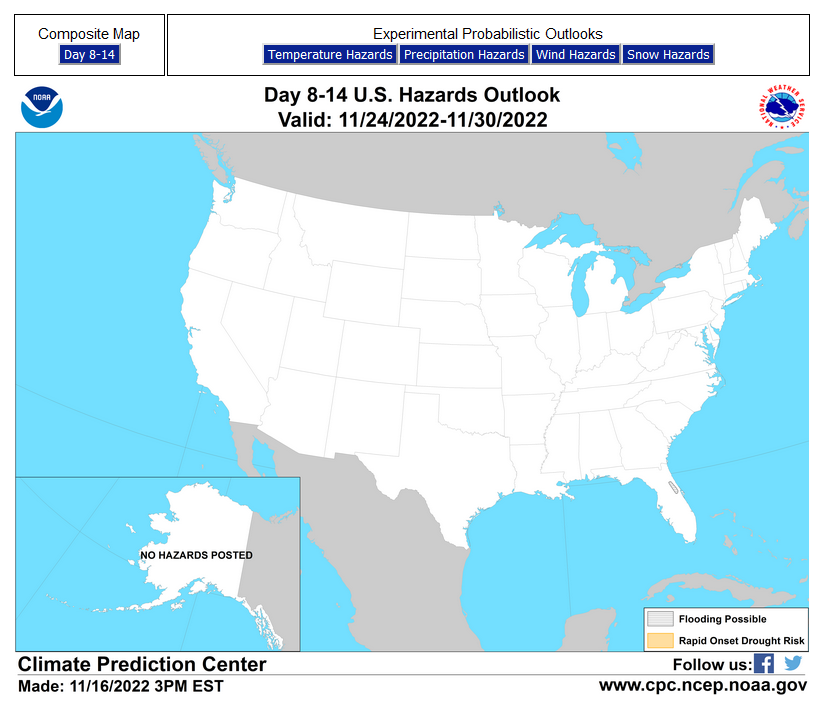
HAZARDS OUTLOOKS
Click here for the latest complete Day 3 -7 Hazards forecast which updates only on weekdays. Once a week probably Monday or Tuesday I will update the images. I provided the link for readers to get daily updates on weekdays. Use your own judgment to decide if you need to update these images.
Worldwide Tropical Forecast
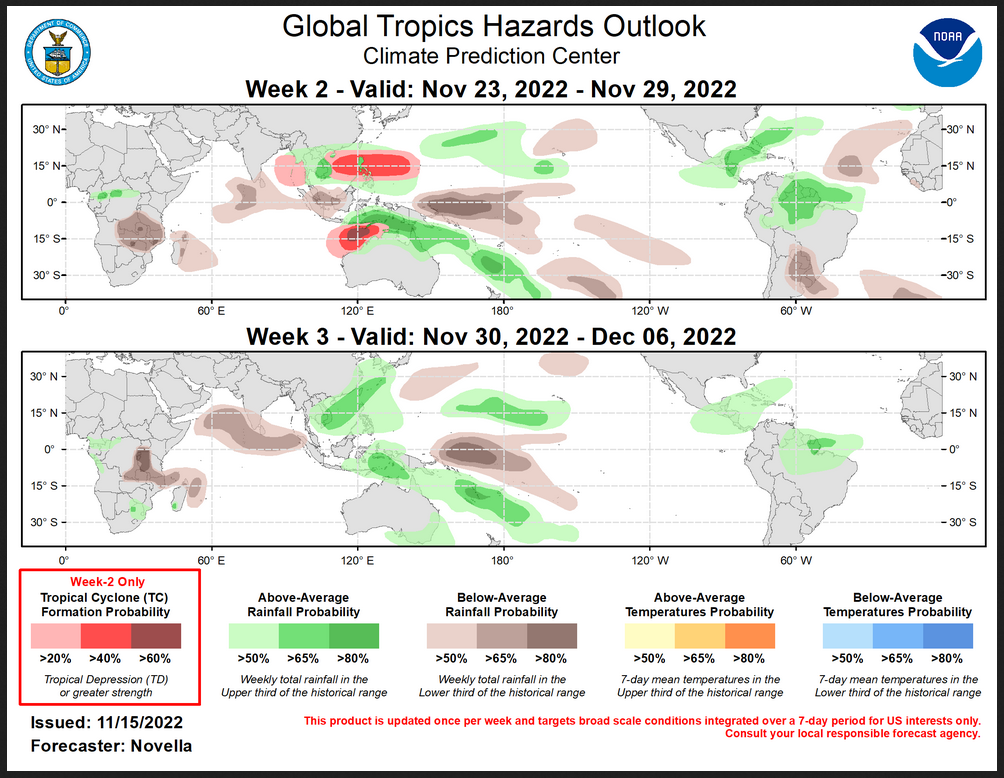
(This graphic updates on Tuesdays) If it has not been updated, you can get the update by clicking here This is a new approach and covers weeks 2 and 3 not weeks 1 and 2. It has more information but I am having trouble getting used to it. As usual, it comes with a discussion which is below
Detailed Maps and Reports for the Western Atlantic and the Pacific Oceans
Below are four maps that summarize the situation for the Atlantic, Eastern, Central Pacific, and Western Pacific. Additional information can be accessed by clicking HERE
First the Atlantic
Click to view the forecast map and have access to additional information https://www.nhc .noaa.gov/gtwo.php?basin= atlc&fdays=5
Then Eastern Pacific
Click to view the forecast map and have access to additional information https://www.nhc.noaa.gov/gtwo.php?basin=epac&fdays=5
Then Central Pacific
Click to view the forecast map and have access to additional information https://www.nhc.noaa.gov/gtwo.php?basin=cpac&fdays=5
And the Western Pacific
Click to view the forecast map and have access to additional information https://www.metoc.navy.mil/jtwc/jtwc.html
Some Intermediate-Term Outlooks
Links to “Outlook” maps and discussions for three time periods. Days 6 – 10, Days 8 – 14, and Weeks 3 and 4. An outlook differs from a forecast based on how NOAA uses these terms in that an “outlook” presents information from deviation from normal and the likelihood of these deviations.
You have to click on the links because they do not update automatically and I do not want to have stale images in the article. But it is not difficult to click on a link and you get a large image plus a discussion. On Fridays in a separate article, we will show the images and provide a link in this article that article. But remember what you will see is the images as of Friday. But here you can get the current images simply by clicking on them. Then hit the return arrow at the upper left of your screen to return to the article. You will not find this information easily anywhere else.

Right now you can find these maps here (We show them every Friday there but you can click above and find them).
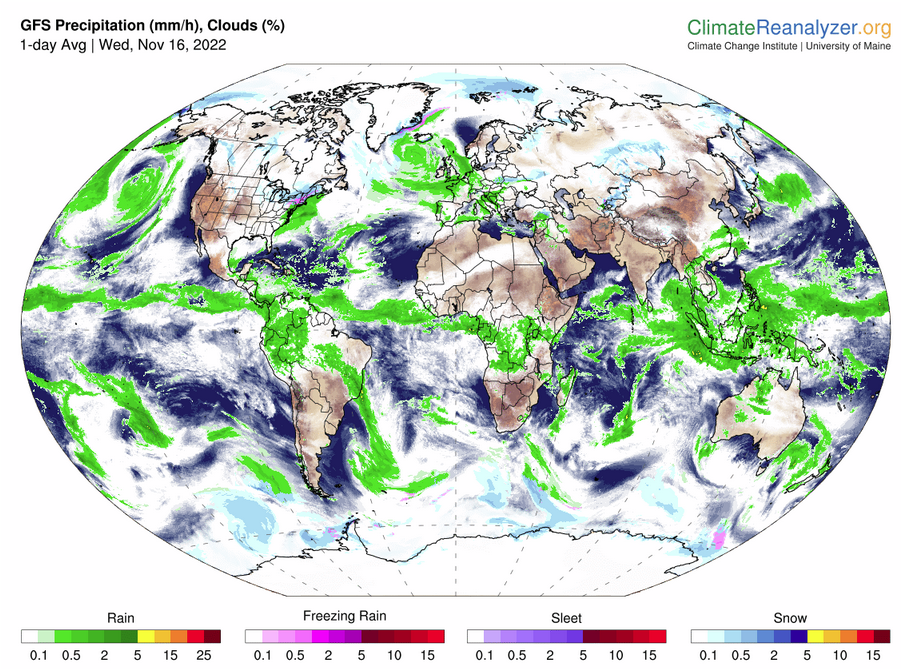
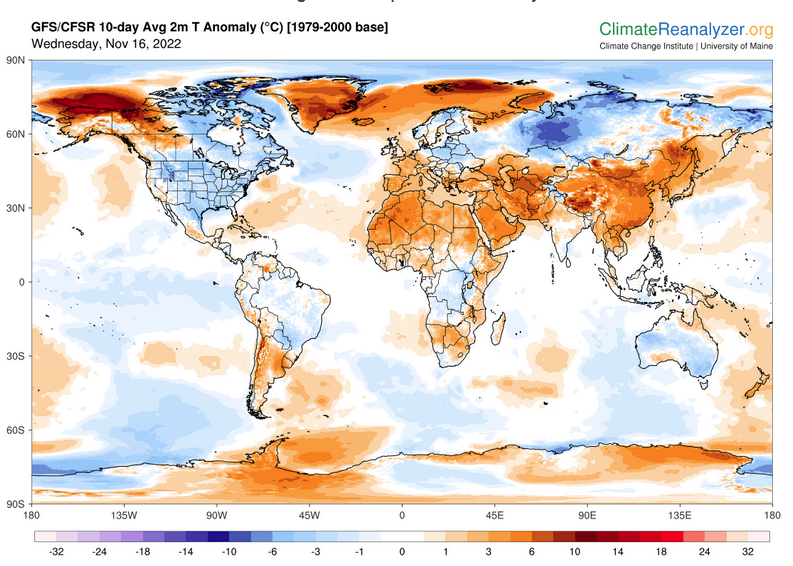
Worldwide Weather
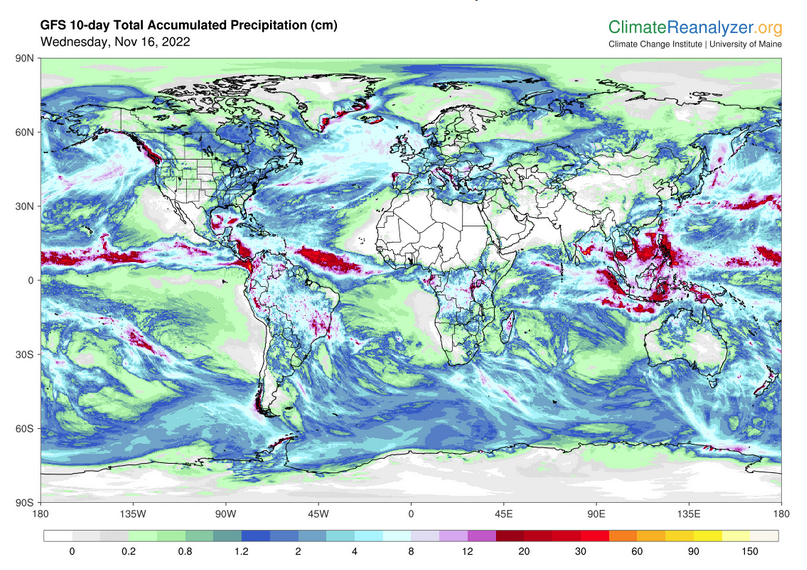
Below is the current or short-term precipitation forecast which can be updated by clicking HERE Additional maps can be obtained HERE.
Month to Date Information
Month to date Temperature can be found at https://hprcc.unl.edu/products/maps/acis/MonthTDeptUS.png
Month to date Precipitation can be found at https://hprcc.unl.edu/products/maps/acis/MonthPNormUS.png