Here is what we are paying attention to this morning and the next 48 hours from this morning’s NWS Forecast.
...Light snow accumulations across the mid-Missouri Valley and Midwest
through Tuesday morning...

...Coastal rain; inland mixed precipitation on Tuesday evening into
Wednesday across Northeast and Mid-Atlantic as coastal low develops and
moves up coast...

...Anomalously cold air will continue to grip the lower 48 through the
work week...

...Strong Santa Ana winds return across Southern California on Tuesday;
High Wind Warnings in effect...
Continuation of the NWS Short Range Forecast (It is updated twice a day and these updates can be found here.
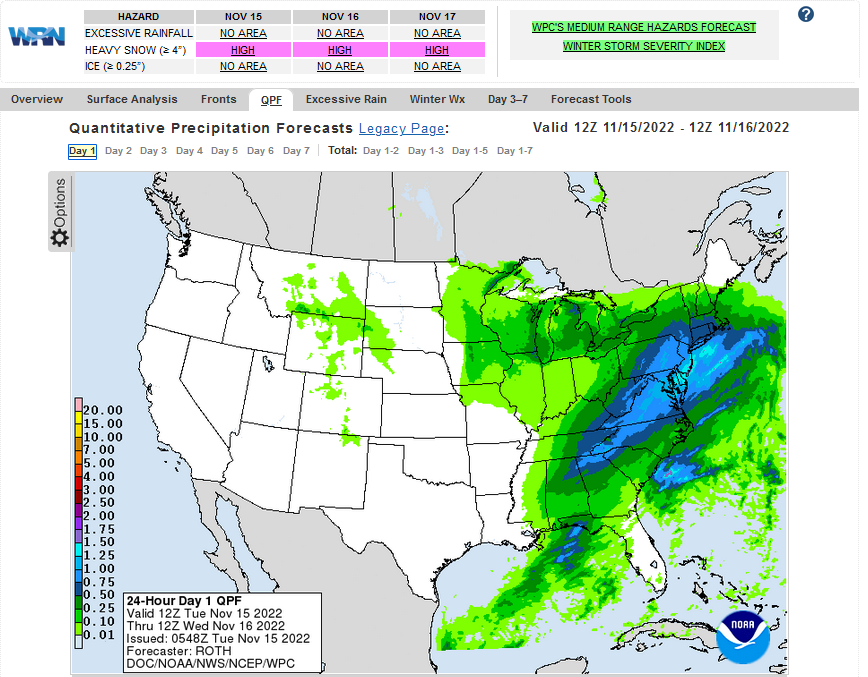
A deep upper-level trough swinging through the eastern U.S. will drive an
active start to the work week as a developing storm system produces
multiple weather hazards. Across eastern Kansas, the mid-Missouri Valley,
and the southern Midwest, the first widespread light snowfall of the
season is ongoing and expected to continue through Tuesday, with snow
ending from west to east as a shortwave ejecting out of the Plains moves
through the region. Winter Weather Advisories have been issued for much of
the area, with a general 1-3" of snow possible through Tuesday.

Further south, a low-pressure system developing along the Texas Gulf Coast
is forecast to track along the coastline, producing rainfall across the
Mississippi Valley and Southeast on Tuesday as moist air streams northward
from the Gulf of Mexico. While precipitation is forecast to remain light
to moderate, some locally heavier rainfall rates will be possible along
the immediate coastline in the warm sector of the system, especially in
the early Tuesday morning hours. As the upper-level energy progresses
northeastward into the Mid-Atlantic late Tuesday, a coastal low will
develop offshore the Carolinas before intensifying, and moving up the
coast, producing widespread precipitation across the region. On Tuesday
afternoon, areas of rain/freezing rain are expected to develop over parts
of the Central Appalachians, with higher elevations receiving snow, before
expanding northeastward into the Mid-Atlantic and Northeast as the system
tracks up the coast. Interior portions of the Northeast and New England
may receive accumulating snow Tuesday night before changing over to mixed
precipitation and even rain during the early Wednesday morning hours,
while higher elevations are forecast to remain snow for a longer time.
However, uncertainty surrounding precipitation types is still high, as the
track of the system and temperature profiles will dictate where the
rain/snow line sets up and how long snow lasts. Regardless, widespread
Winter Weather Advisories have been issued for the Appalachians, central
Pennsylvania, and upstate New York through early Wednesday, as wintry
precipitation may cause hazardous travel conditions. Moreover, in coastal
sections of the Northeast and New England, up to an inch of rain is
forecast to fall through Wednesday before the system exits into the
Canadian Maritimes.

Furthermore, anomalously cold air continues to grip the nation as high
temperatures are forecast to remain 10-20 degrees below average through
the work week. Locations as far south as the Gulf Coast will experience
high temperatures dipping into the lower 50s and even the upper 40s on
Wednesday and Thursday. On the backside of the upper-level trough swinging
through the Plains, even colder air will filter in from Canada as highs
struggle to get above freezing during the daytime hours this week across
the central U.S.

Lastly, high-pressure building into the Great Basin region will lead to
strong Santa Ana winds across southern California beginning Tuesday
evening due to an increasing pressure gradient across the region. As a
result, High Wind Warnings have been issued for the Transverse Ranges
until Wednesday night, where winds may gust as high as 75 mph.
Current forecast of heavy precipitation (Updates can be found HERE)
Maps that relate the forecast to geography can be found by clicking Here for Day 1 and Here for Day 2.
Here is a 60-hour animated forecast map that shows how the short-term forecast is expected to play out
If it needs to be updated click here.
ATMOSPHERIC RIVERS
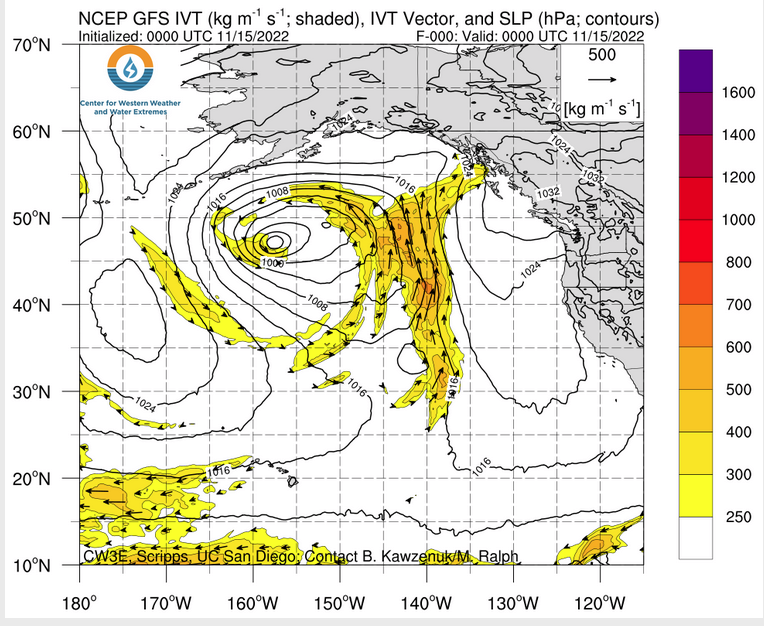
Click HERE to update. Here is some useful information about Atmospheric Rivers.
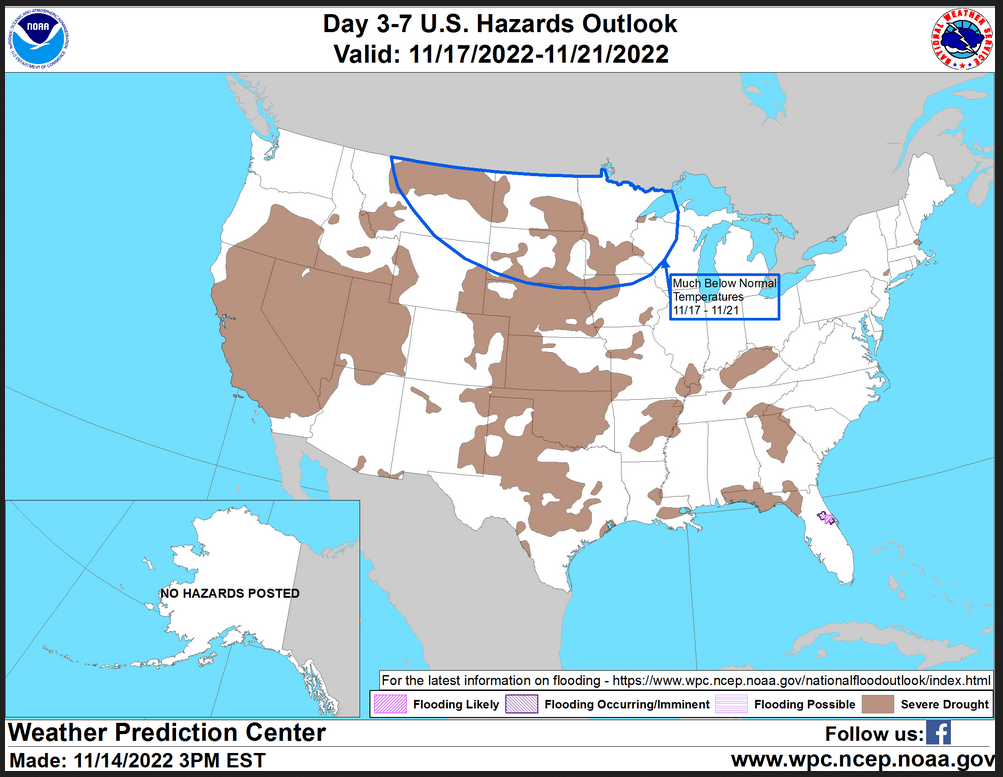
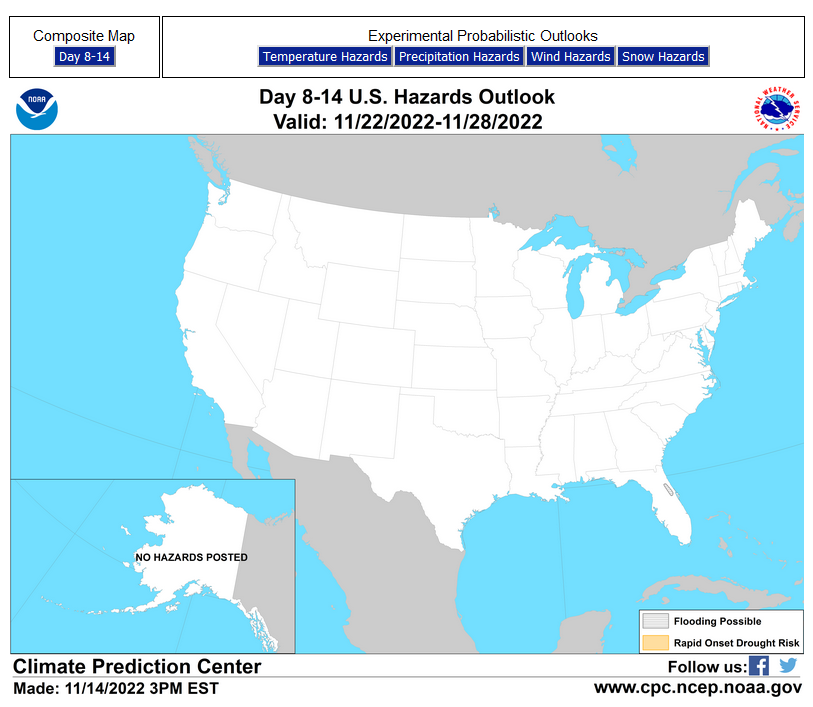
HAZARDS OUTLOOKS
Click here for the latest complete Day 3 -7 Hazards forecast which updates only on weekdays. Once a week probably Monday or Tuesday I will update the images. I provided the link for readers to get daily updates on weekdays. Use your own judgment to decide if you need to update these images.
Worldwide Tropical Forecast
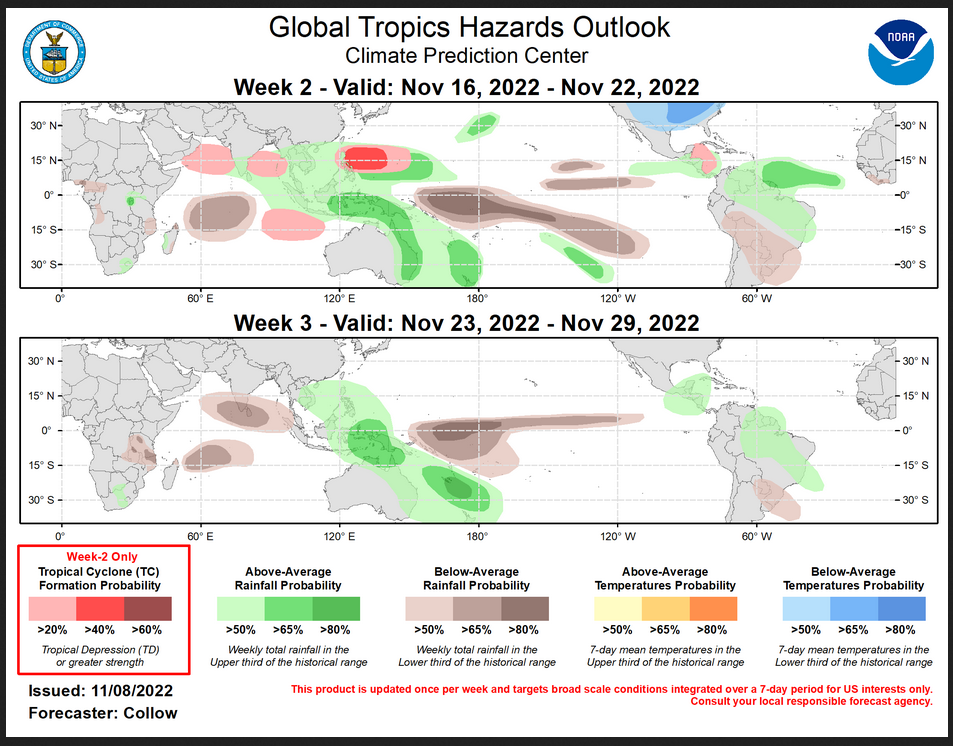
(This graphic updates on Tuesdays) If it has not been updated, you can get the update by clicking here This is a new approach and covers weeks 2 and 3 not weeks 1 and 2. It has more information but I am having trouble getting used to it. As usual, it comes with a discussion which is below
Detailed Maps and Reports for the Western Atlantic and the Pacific Oceans
Below are four maps that summarize the situation for the Atlantic, Eastern, Central Pacific, and Western Pacific. Additional information can be accessed by clicking HERE
First the Atlantic
Click to view the forecast map and have access to additional information https://www.nhc .noaa.gov/gtwo.php?basin= atlc&fdays=5
Then Eastern Pacific
Click to view the forecast map and have access to additional information https://www.nhc.noaa.gov/gtwo.php?basin=epac&fdays=5
Then Central Pacific
Click to view the forecast map and have access to additional information https://www.nhc.noaa.gov/gtwo.php?basin=cpac&fdays=5
And the Western Pacific
Click to view the forecast map and have access to additional information https://www.metoc.navy.mil/jtwc/jtwc.html
Some Intermediate-Term Outlooks
Links to “Outlook” maps and discussions for three time periods. Days 6 – 10, Days 8 – 14, and Weeks 3 and 4. An outlook differs from a forecast based on how NOAA uses these terms in that an “outlook” presents information from deviation from normal and the likelihood of these deviations.
You have to click on the links because they do not update automatically and I do not want to have stale images in the article. But it is not difficult to click on a link and you get a large image plus a discussion. On Fridays in a separate article, we will show the images and provide a link in this article that article. But remember what you will see is the images as of Friday. But here you can get the current images simply by clicking on them. Then hit the return arrow at the upper left of your screen to return to the article. You will not find this information easily anywhere else.

Right now you can find these maps here (We show them every Friday there but you can click above and find them).
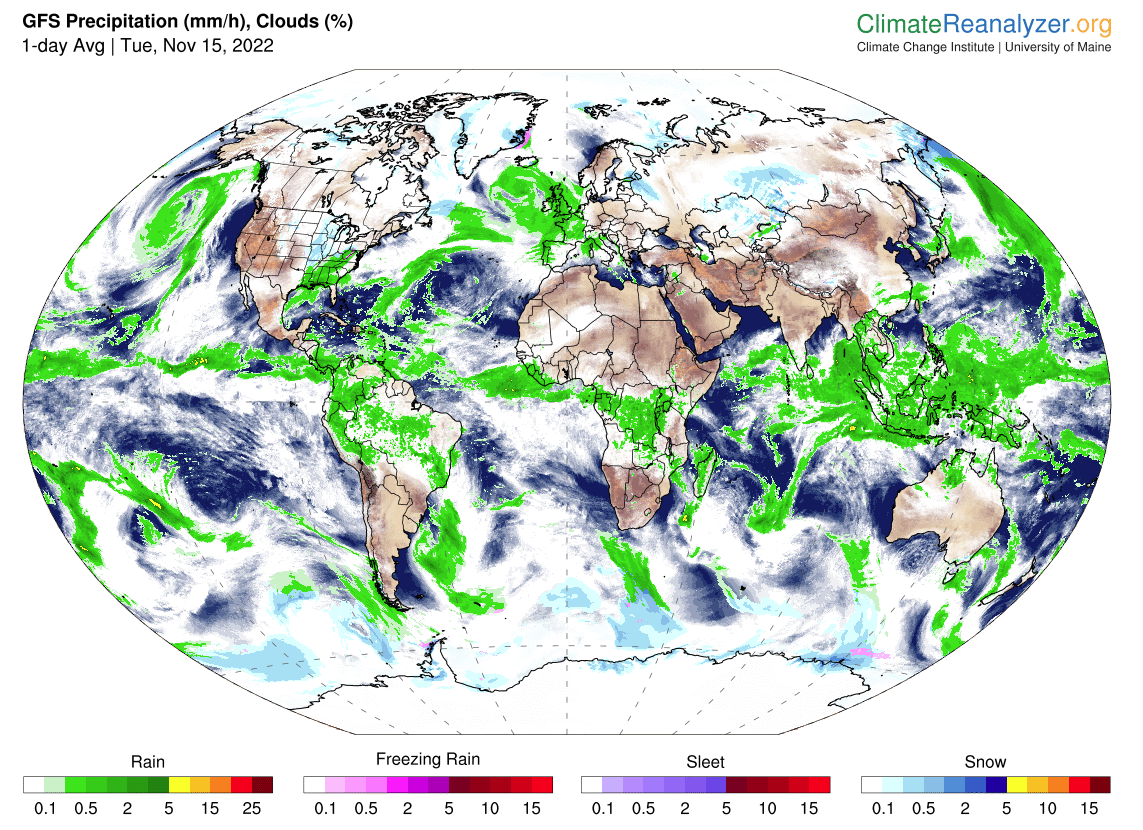
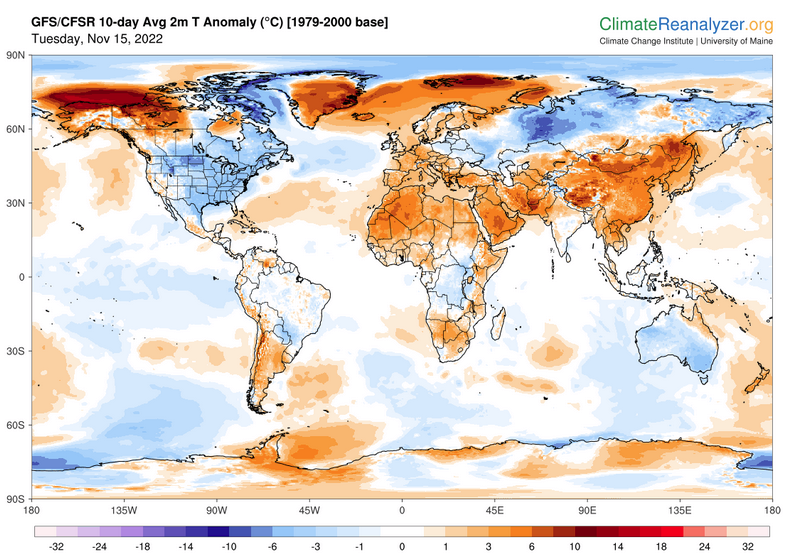
Worldwide Weather
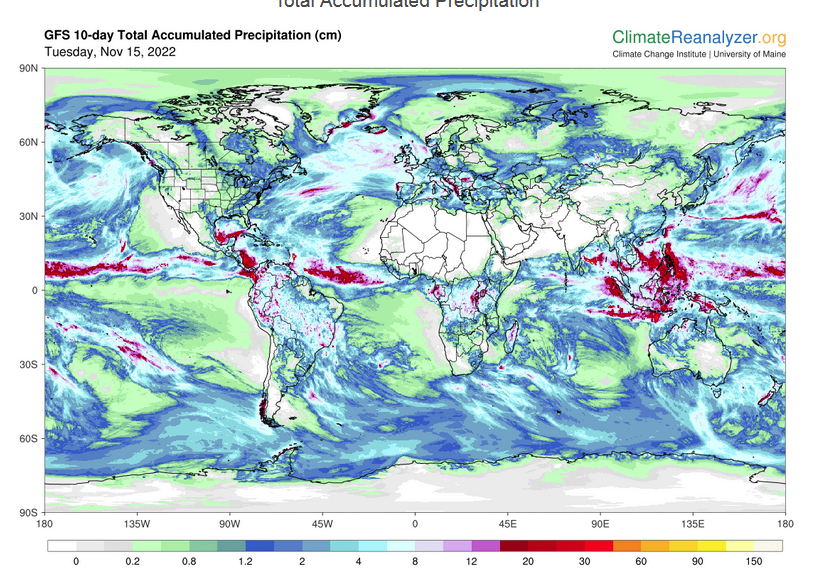
Below is the current or short-term precipitation forecast which can be updated by clicking HERE Additional maps can be obtained HERE.
Month to Date Information
Month to date Temperature can be found at https://hprcc.unl.edu/products/maps/acis/MonthTDeptUS.png
Month to date Precipitation can be found at https://hprcc.unl.edu/products/maps/acis/MonthPNormUS.png