Updated at 12:42 a.m. EST November 15, 2022
Taste of Early Winter but it only lasts for a couple of weeks
We provide a daily report which focuses on the shorter-term predictions but also has links to all the partial-month outlooks. Once a week we show many of the actual forecast maps not just provide the links to these maps. This makes it easier for the reader. Our report provides a separate forecast for Days 1 and 2, Days1-5, Days 6 -10, Days 8 – 14, and weeks 3 and 4. This provides information that is useful to readers in terms of planning their activities for the next 28 days.
The key dynamic for CONUS is the High Pressure over Alaska which brings cold air into the U.S. Northwest. We end up with cool and dry over most of CONUS which first moderates and later becomes a mostly warm and dry pattern as a new atmospheric-driven storm moves into the West Coast.
When we publish on Friday night, it provides a 28-day view of the future. What is important is that this is a longer-term view than one that is typically available in the media and online.
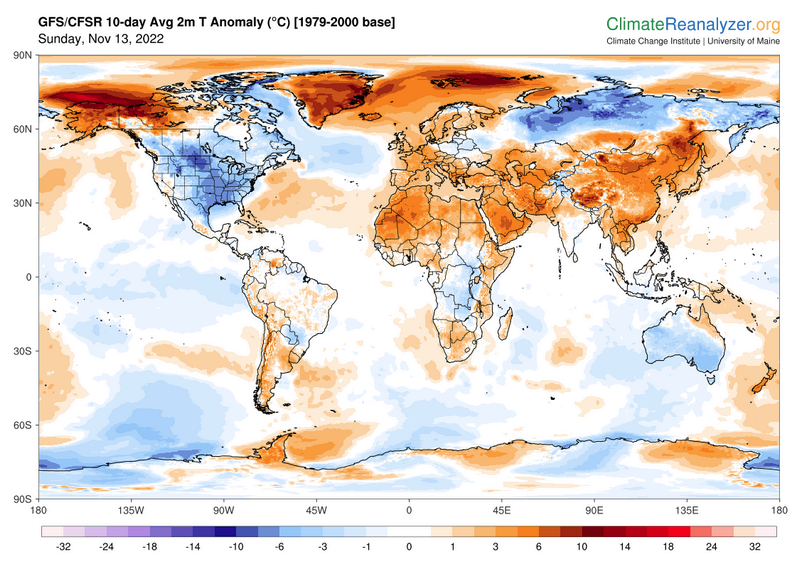
We also include a 10-Day World Temperature and Precipitation Forecast.

What NOAA is predicting for the next 28 days. (One may want to refer to the Monthly Outlook provided by NOAA which we reported on HERE.) Our Friday article provides more detail and shows how the monthly outlook changes as weather patterns evolve.
We will start with the short-term (today, tomorrow and five-day cumulative)- It is up to date as of today. If you look at this article after today you can click the links to update (plus you will end up with a lot of additional information)
Maps that relate the forecast to geography can be found by clicking Here for Day 1 and Here for Day 2.
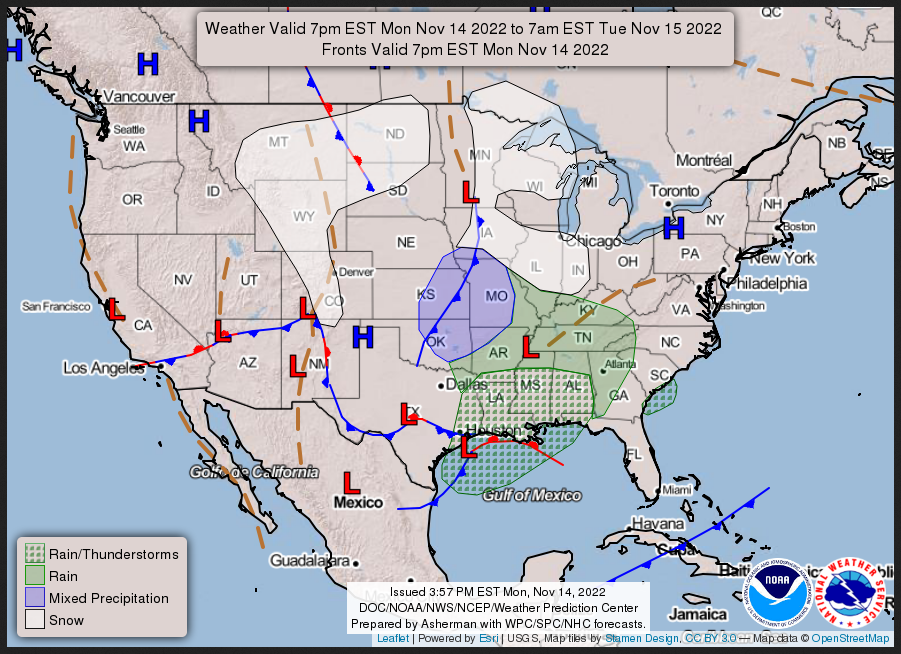
Monday Night Nov 14-15 2022
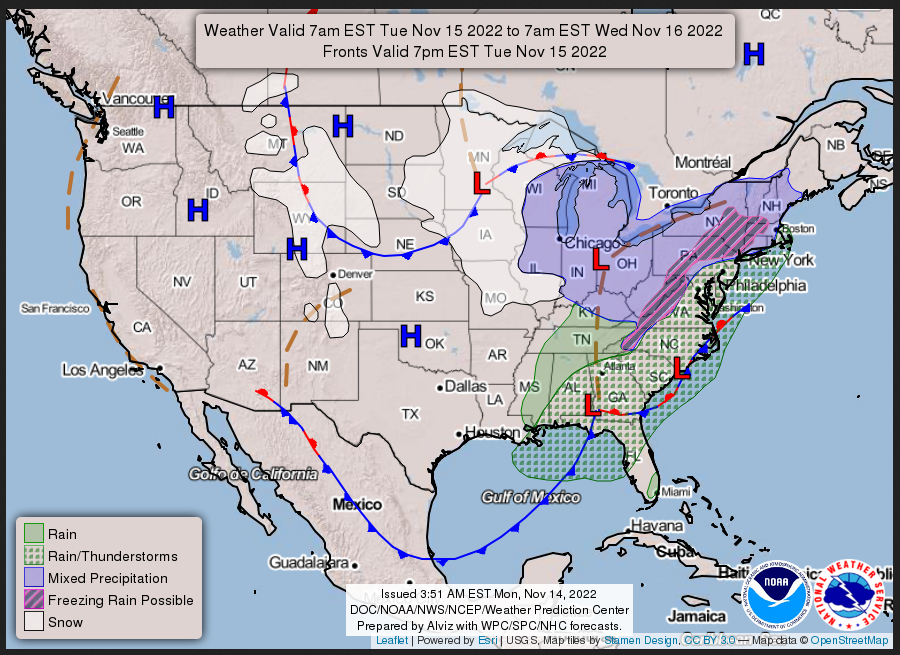
Tuesday, November 15, 2022
–
| Temperature (Maximum or Minimum Anomaly) for the next five days | Precipitation (Five days of cumulative precipitation) |
| https://www.wpc.ncep.noaa.gov/m edr/me dr_mean.shtml | https://www.wpc.ncep.no aa.gov/qpf/day1-7.shtml |
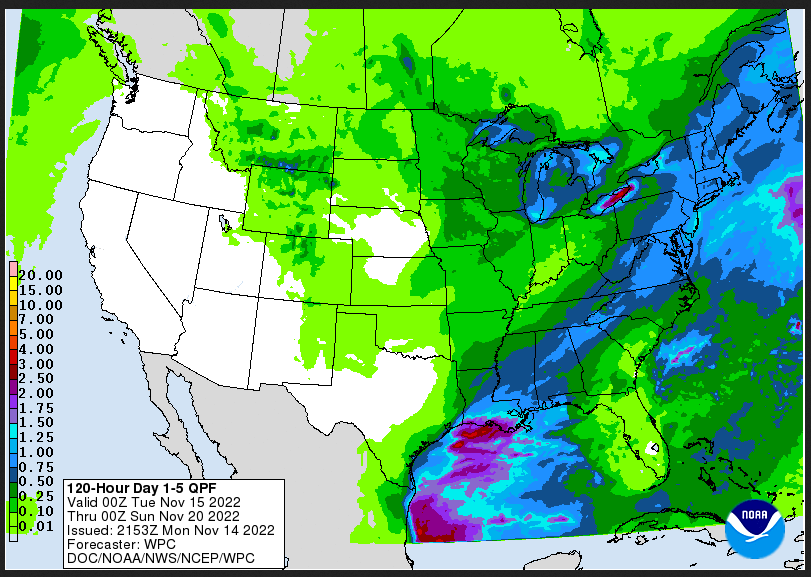
| The lows are below normal almost everywhere. Eastern half of CONUS is wet, Gulf States and East Coast very wet. |
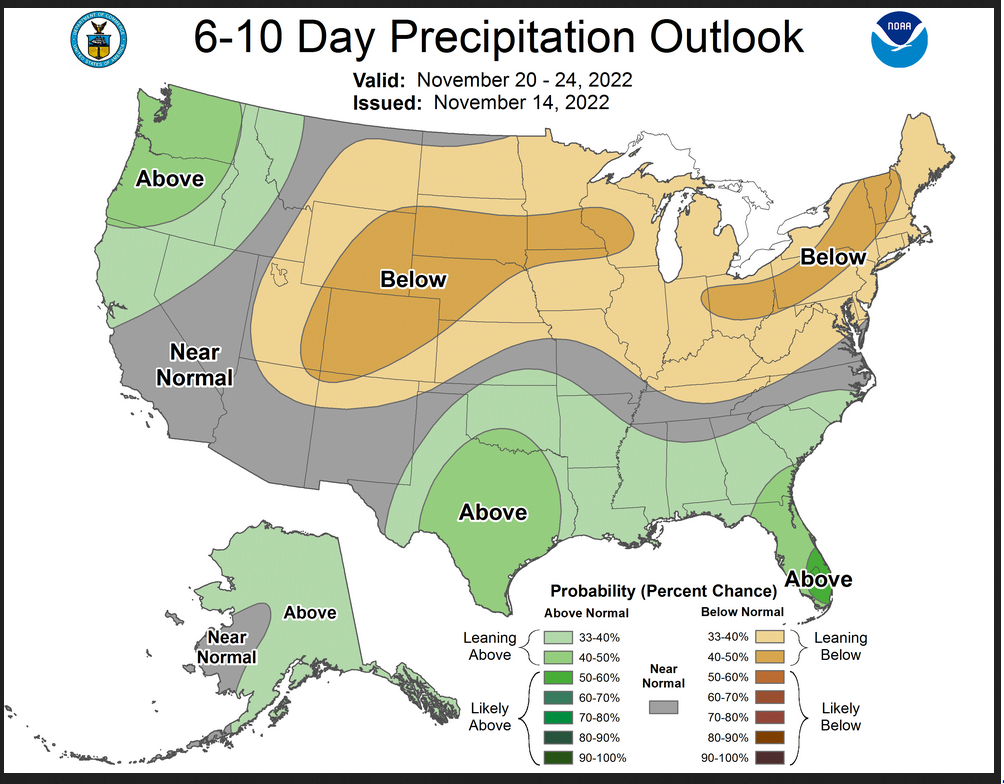
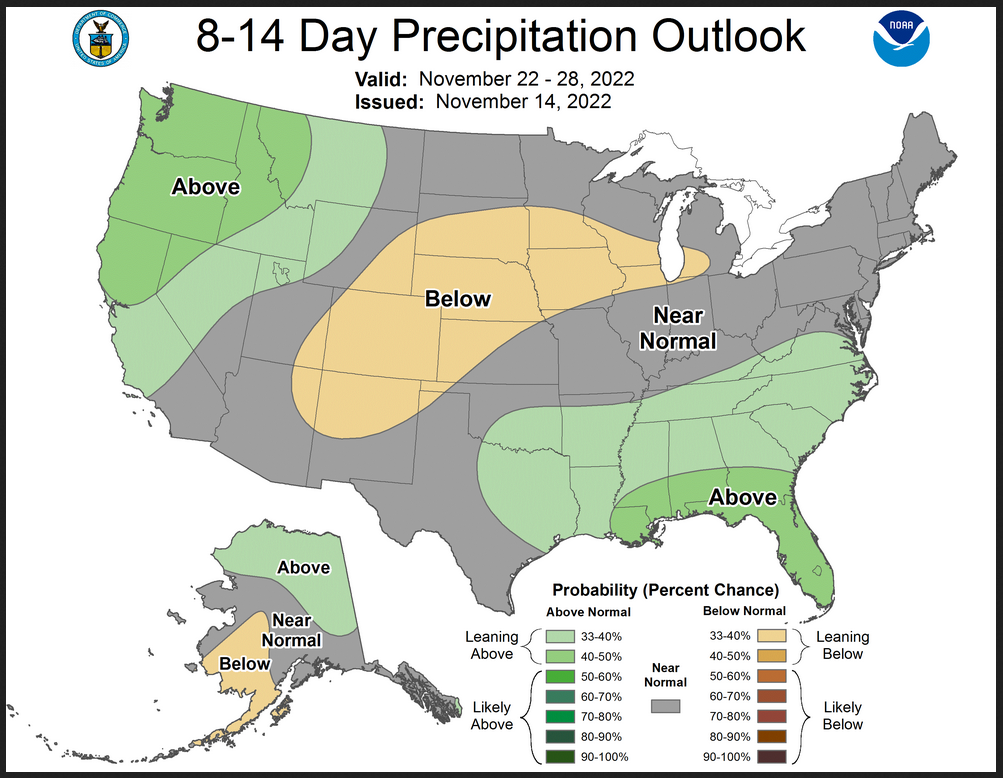
Now we look at Intermediate-Term “Outlook” maps for three time periods. Days 6 – 10, Days 8 – 14, and Weeks 3 and 4. An outlook differs from a forecast based on how NOAA uses these terms in that an “outlook” presents information as deviation from normal and the likelihood of these deviations.
I have provided the maps so you do not need to click to get them. But they do not update daily. But you can get the current images simply by clicking on the links provided. Then hit the return arrow at the upper left of your screen to return to the article. There is no need to do that right away since what is published today is up to date. The Week 3 – 4 Outlook only updates on Fridays.
Below are the links to obtain updates and additional information.
 –
–
| Mostly cool and dry but with a wet extreme southern tier. |
| Similar to Days 6 – 10 but the cool and dry anomalies moderate. A new atmospheric river storm system enters the West. |
Now we address Weeks 3 and 4. This is a time frame that is very important. It is half of the 28-Day forecast period. That is why we include the discussion that accompanies the maps.
–
A lot more llike Normal. Many places go from cool to warm. Read discusion below. –Prognostic Discussion for Week 3-4 Temperature and Experimental Precipitation Outlooks
NWS Climate Prediction Center College Park MD
300PM EST Fri Nov 11 2022Week 3-4 Forecast Discussion Valid Sat Nov 26 2022-Fri Dec 09 2022
La Niña conditions persist across the tropical Pacific and remain the dominant influence on anomalous convection throughout the global tropics. The Madden-Julian Oscillation (MJO) was active recently in phases 6 and 7 as indicated by the Realtime Multivariate MJO (RMM) index as a Kelvin wave crossed the Western and Central Pacific, but is now in an inactive state. Dynamical models forecast the RMM MJO index to emerge in phase 5 over the Maritime Continent in the next few days and propagate eastward once again into phase 6 and possibly 7. Therefore the MJO may influence the climate pattern in the Week 3-4 period and the dynamical model forecasts of temperature and precipitation for the Week 3-4 Outlook. Along with MJO composites and MJO and La Niña regressions, the week 3-4 temperature and precipitation outlooks are based on dynamical model forecasts from the CFS, ECMWF, GEFS, JMA, and SubX multi-model ensemble (MME) of experimental and operational ensemble prediction systems.
Dynamical models predict a shift in the Week 3-4 period from the pattern forecast for week 2, when an amplified trough is expected to bring much below normal temperatures to most of the CONUS. Dynamical model forecasts from the CFS, ECMWF, GEFS, JMA, and SubX MME for Week 3-4 are consistent in predicting negative 500-hPa height anomalies and troughing over the Pacific Northwest and positive 500-hPa height anomalies and ridging over the south-central CONUS. Positive 500-hPa height anomalies and an associated ridge are forecast to the southwest of Mainland Alaska in the manual blend of model forecasts, while negative 500-hPa height anomalies are predicted over the southeastern Mainland and the Alaska Panhandle.
Calibrated temperature forecasts from the ensemble model systems are relatively consistent favoring above normal temperatures for the Aleutian Islands and western and northern areas of the Alaska Mainland with a forecast of near to above normal mid-level heights and consistent with decadal temperature trends. Below normal temperatures are favored for southeastern Alaska under negative mid-level height anomalies. Below normal temperatures are favored from eastern Montana across the Northern Plains, consistent with continued influx of cold air under anomalous northerly flow, as well as lagged MJO composites based on an RMM index in phase 5 and convection over the Maritime Continent. Above normal temperatures are most likely across the south-central CONUS as well as the eastern CONUS, under slightly positive 500-hPa height anomalies and consistent with calibrated dynamical model forecasts.
Although the overall circulation pattern is consistent among the dynamical model forecasts for the Week 3-4 Outlook, there is significant uncertainty as the pattern changes relative to week 2. The uncertainty in the forecast is apparent in weaker signals in the Week 3-4 dynamical model precipitation tools. Weak signals over Alaska lead to a forecast of equal chances of above and below median precipitation for much of the state. Above median precipitation is slightly favored for northwestern Alaska consistent with most calibrated dynamical model forecasts and onshore flow. Probabilities of above median precipitation are somewhat enhanced for the northwestern CONUS, ahead of a predicted trough with probabilities in some areas exceeding 60 percent. Below median precipitation is favored from eastern areas of the Southwest into the Central Plains under a predicted ridge. Below median precipitation is also favored from the eastern Gulf Coast across the Southeast Atlantic coast, consistent with dynamical model forecasts and La Niña impacts.
The SubX MME depicts large probabilities above 90 percent for above normal temperatures throughout Hawaii consistent with positive SST anomalies surrounding the islands. The Week 3-4 precipitation outlook for Hawaii favors above median precipitation with slightly greater probabilities over southeastern islands, based on the SubX MME forecast and consistent with the ongoing La Niña.
| It is important to note that the Week 3 -4 Outlook is prepared by a different team than the 6 -10 and 8 – 14 day Outlooks as well as the update of the monthly outlook. |
Month to Date Information

Temperature month to date can be found at https://hprcc.unl.edu/products/maps/acis/MonthTDeptUS.png
Precipitation month to date can be found at https://hprcc.unl.edu/products/maps/acis/MonthPNormUS.png
World Forecast
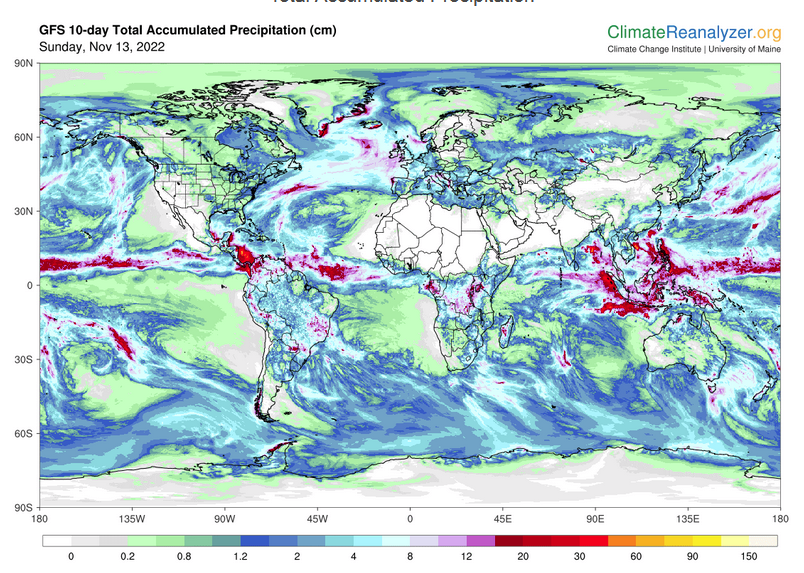
Below is the current or short-term precipitation forecast which can be updated by clicking HERE Additional maps for different time frames and other aspects of weather in addition to precipitation can be obtained HERE. The 10_Day information is shown for temperature and precipitation. Much of this information is provided by the University of Maine. They draw upon many different sources.

Worldwide Tropical Forecast (This is a NOAA Product)

(This graphic updates on Tuesdays) If it has not been updated, you can get the update by clicking here