Here is what we are paying attention to this evening and the next 48 hours from this evening’s NWS Forecast.
...Severe thunderstorms and isolated flash flooding possible across parts
of the southern Plains tonight and southeast Texas on Friday...

...Approaching frontal boundary to spread rain and high elevation snow
chances throughout the Pacific Northwest...
Continuation of the NWS Short Range Forecast (It is updated twice a day and these updates can be found here.
A closed upper-level low swinging over the southern Rockies this afternoon
is expected to reach the southern High Plains tonight and aid in producing
unsettled weather for the region. First, gusty winds and high elevation
snow are possible throughout parts of New Mexico and southern Colorado
this evening. Winter Weather Advisories and Wind Advisories have been
issued. As the system enters West Texas tonight, numerous showers and
thunderstorms are expected to develop along and ahead of a cold front from
the Texas Panhandle to the Edwards Plateau. A few storms may contain large
hail and isolated damaging wind gusts. A Slight Risk (level 2/5) of severe
weather is in effect for this area through early Friday. As the
upper-level low progresses eastward to end the workweek, increasing
atmospheric moisture content will allow for the potential of heavy rain to
extend towards southeast Texas on Friday. A Marginal Risk (level 1/4) of
Excessive Rainfall extends from the Dallas-Fort Worth metro region to the
western Gulf Coast. Since much of the region has experienced a relatively
dry last 30 days and with moderate to exceptional drought, any flash
flooding should remain localized and most likely near urban areas. Storms
could also turn severe as the approaching cold front interacts with a warm
and moist airmass entering from the western Gulf of Mexico, as highlighted
by a Slight Risk of of severe weather centered over the Middle/Upper Texas
Coast. By Saturday, the storm system will continue progressing eastward
and into the Lower Mississippi Valley and central Gulf Coast. Similarly,
an isolated chance for flash flooding and severe thunderstorms is
anticipated for the impacted areas.

Meanwhile, the only other area expected to see widespread precipitation
through early this weekend is the Pacific Northwest. A cold front entering
from the northeast Pacific will focus moderate rainfall and high elevation
snow across the Olympic Peninsula and northern Cascades through early
Friday. As the front pushes farther southward, moisture and showers are
expected to weaken, with only light amounts reaching western Oregon into
the weekend.

Elsewhere, the majority of the Lower 48 should enjoy tranquil weather
conditions as strong high pressure sets up over the Intermountain West and
Northeast. Above average high temperatures are forecast to span the
Northern Tier from the Plains to New England, with highs into the 50s and
60s through the final weekend of October.
Current forecast of heavy precipitation (Updates can be found HERE)

Maps that relate the forecast to geography can be found by clicking Here for Day 1 and Here for Day 2.
Here is a 60-hour animated forecast map that shows how the short-term forecast is expected to play out
If it needs to be updated click here.
ATMOSPHERIC RIVERS
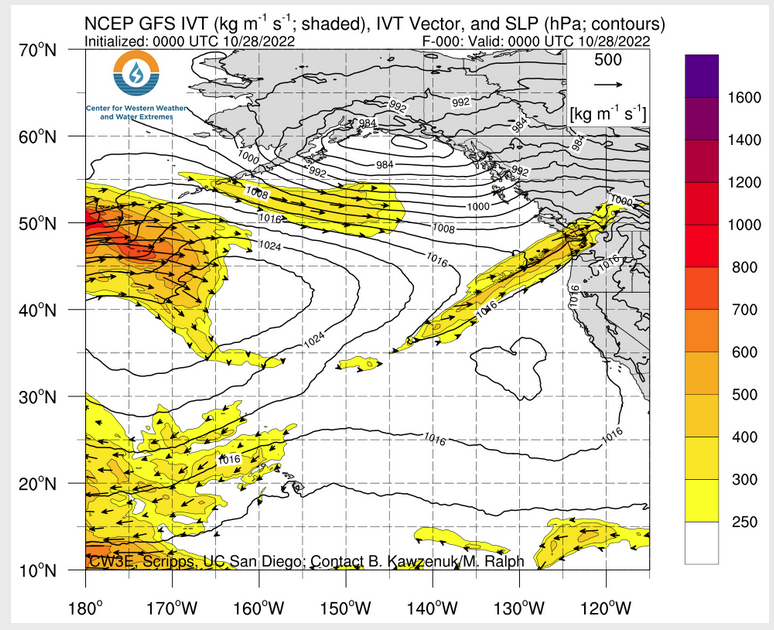 Click HERE to update. Here is some useful information about Atmospheric Rivers.
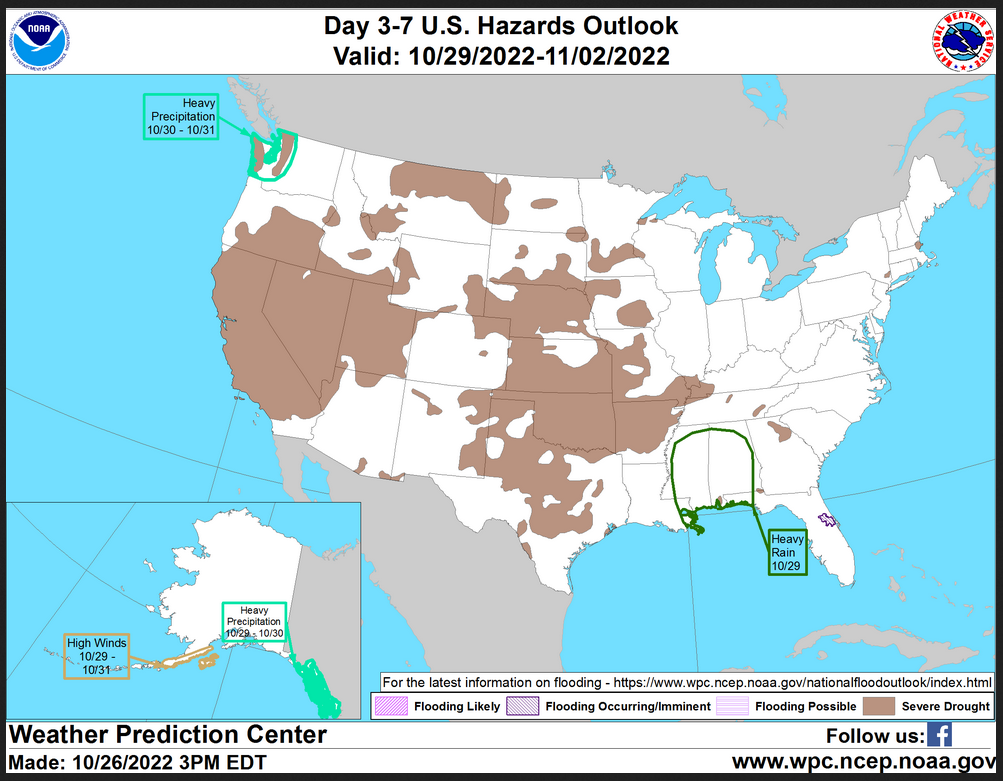
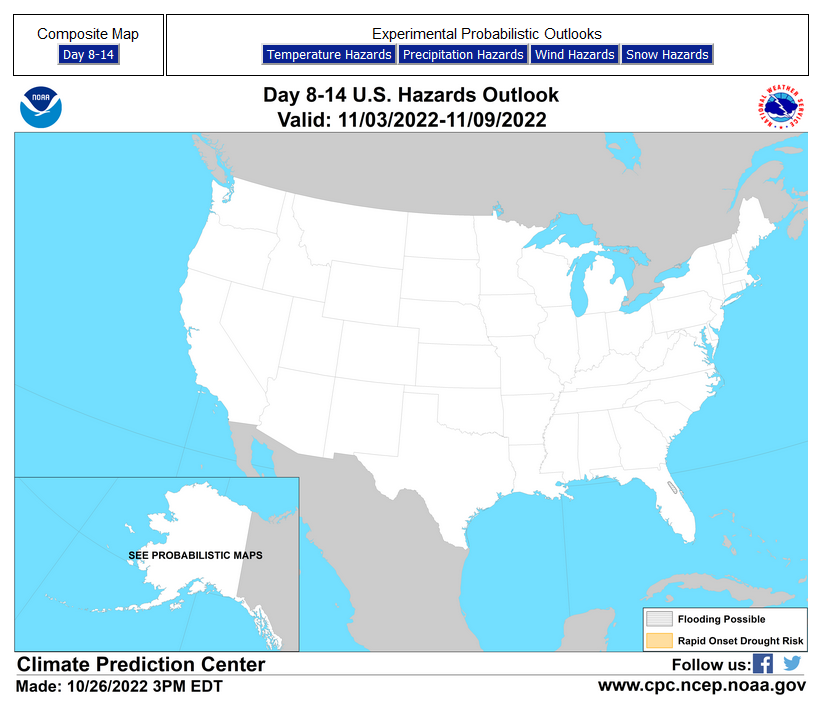
HAZARDS OUTLOOKS
Click here for the latest complete Day 3 -7 Hazards forecast which updates only on weekdays. Once a week probably Monday or Tuesday I will update the images. I provided the link for readers to get daily updates on weekdays. Use your own judgment to decide if you need to update these images.
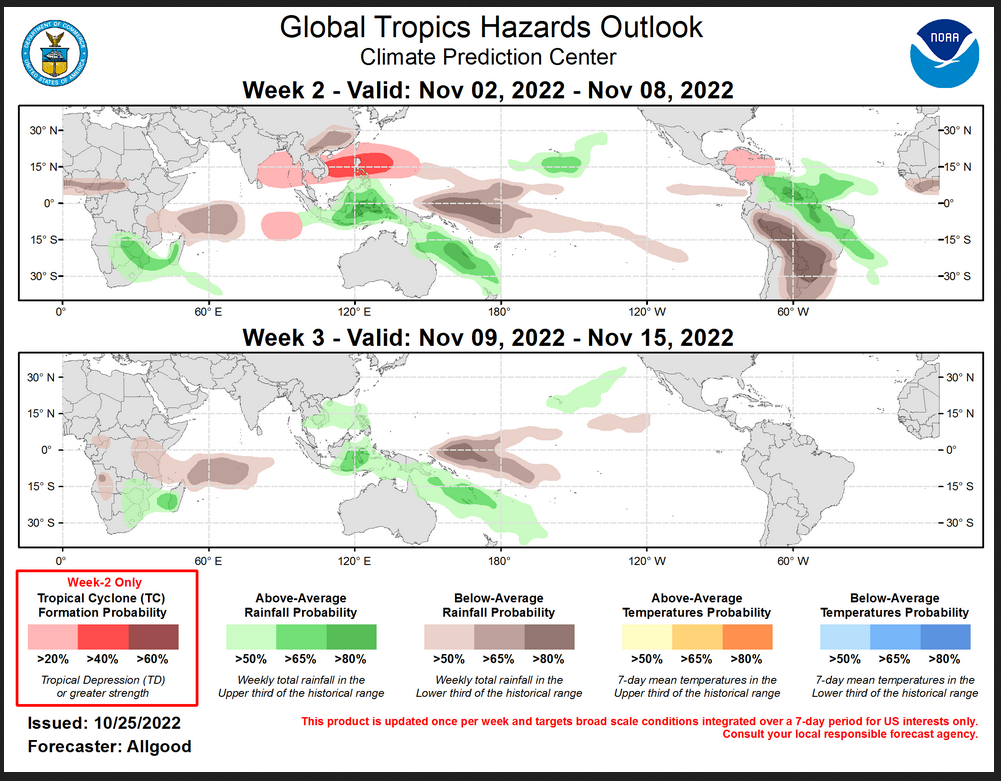
Worldwide Tropical Forecast
(This graphic updates on Tuesdays) If it has not been updated, you can get the update by clicking here This is a new approach and covers weeks 2 and 3 not weeks 1 and 2. It has more information but I am having trouble getting used to it. As usual, it comes with a discussion which is below
Detailed Maps and Reports for the Western Atlantic and the Pacific Oceans
Below are four maps that summarize the situation for the Atlantic, Eastern, Central Pacific, and Western Pacific. Additional information can be accessed by clicking HERE
First the Atlantic
Click to view the forecast map and have access to additional information https://www.nhc .noaa.gov/gtwo.php?basin= atlc&fdays=5
Then Eastern Pacific
Click to view the forecast map and have access to additional information https://www.nhc.noaa.gov/gtwo.php?basin=epac&fdays=5
Then Central Pacific
Click to view the forecast map and have access to additional information https://www.nhc.noaa.gov/gtwo.php?basin=cpac&fdays=5
And the Western Pacific
Click to view the forecast map and have access to additional information https://www.metoc.navy.mil/jtwc/jtwc.html
Some Intermediate-Term Outlooks
Links to “Outlook” maps and discussions for three time periods. Days 6 – 10, Days 8 – 14, and Weeks 3 and 4. An outlook differs from a forecast based on how NOAA uses these terms in that an “outlook” presents information from deviation from normal and the likelihood of these deviations.
You have to click on the links because they do not update automatically and I do not want to have stale images in the article. But it is not difficult to click on a link and you get a large image plus a discussion. On Fridays in a separate article, we will show the images and provide a link in this article that article. But remember what you will see is the images as of Friday. But here you can get the current images simply by clicking on them. Then hit the return arrow at the upper left of your screen to return to the article. You will not find this information easily anywhere else.

Right now you can find these maps here (We show them every Friday there but you can click above and find them).
Worldwide Weather
Below is the current or short-term precipitation forecast which can be updated by clicking HERE Additional maps can be obtained HERE.
Month to Date Information
Month to date Temperature can be found at https://hprcc.unl.edu/products/maps/acis/MonthTDeptUS.png
Month to date Precipitation can be found at https://hprcc.unl.edu/products/maps/acis/MonthPNormUS.png