Here is what we are paying attention to this evening and the next 48 hours from this evening’s NWS Forecast.
...A robust low pressure system will bring the first widespread wintry
weather event of the season across the Cascades, northern and central
Rockies as well as the northern High Plains through the weekend into
Monday...

...Much colder air will surge across the western U.S. while much above
normal temperatures surge north into the upper Midwest and the Great
Lakes...

...Fire weather risk is critical over parts of the central Plains...
Continuation of the NWS Short Range Forecast (It is updated twice a day and these updates can be found here.
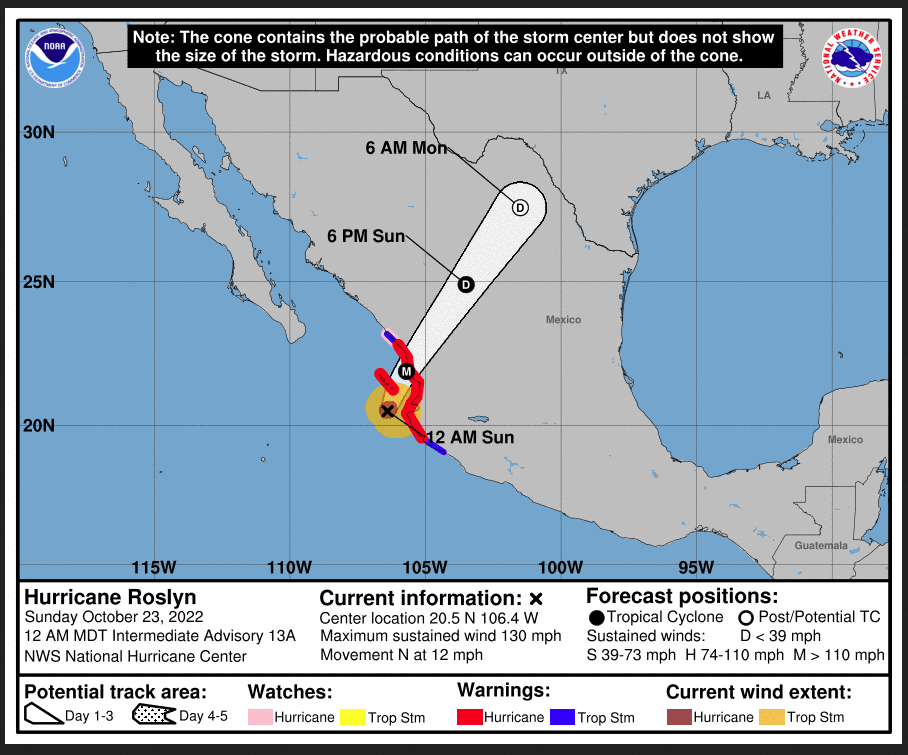
A major change in the upper-level pattern across the U.S. will be
manifested by a rapidly developing low pressure system moving across the
northern Rockies into the northern Plains through the weekend.  This
system will bring the first widespread wintry weather event of the season
across the Cascades, northern and central Rockies as well as the northern
High Plains through the weekend and into Monday.  Cold air surging
southward from western Canada will usher much below normal temperatures
all the way through the western U.S. and down into northern Mexico by
Monday.  Meanwhile, broad and deep southerly flow ahead of the
intensifying system will push very warm air northward into the northern
Plains through this weekend, where afternoon temperatures well up into the
80s are expected.  Warmest locations will likely be this afternoon over
the south-central Plains where highs will be into the low 90s.  Some of
these readings could challenge daily record high temperatures at some
locations.  The low pressure system is forecast to intensify rapidly as it
moves across the northern Plains on Sunday.  A band of moderate to heavy
rain is forecast to change over to moderate to heavy snow over the
northern High Plains as the system intensifies.  The storm is forecast to
approach peak intensity Monday morning as it tracks northeastward into
southern Canada.  Gale force winds are expected to accompany the storm in
addition to the change over from heavy rain to heavy snow from eastern
Montana to western North Dakota from Sunday night into Monday morning.
Conditions should begin to improve by Monday afternoon as the system
begins to move farther into southern Canada.  In the meantime,
increasingly gusty southerly winds in a dry environment will promote
critical fire danger across the central Plains through the weekend.  By
later on Sunday, the eastern part of the northern/central Plains into the
upper Midwest could be impacted by severe thunderstorms ahead of a potent
cold front.

Meanwhile, low pressure waves developing along a slow-moving front off the
East Coast will steer moisture closer to the coast, producing light rain
near the Mid-Atlantic coast by later on Sunday.  By Sunday night into
Monday, southeastern New England should see the rain moving into the
region and gradually spreading northeastward into Maine.

Hurricane Roslyn currently churning just off the west coast of Mexico is
forecast to make landfall and weaken rapidly over the mountainous terrain
of central Mexico on Sunday.  By Monday, higher level moisture associated
with the remnants of Roslyn is forecast to interact with the trailing cold
front associated with the deep cyclone over the northern Plains.  Rain and
thunderstorms are expected to quickly develop and expand across the
southern Plains toward the Mississippi Valley on Monday as a frontal wave
forms.  Meanwhile, moisture associated with the next Pacific system will
rapidly reach the Pacific Northwest Sunday night, bringing the next round
of rain for the lower elevation of the Pacific Northwest and
high-elevation snow from the Cascades to the northern Rockies, and then
the northern High Plains on Monday.
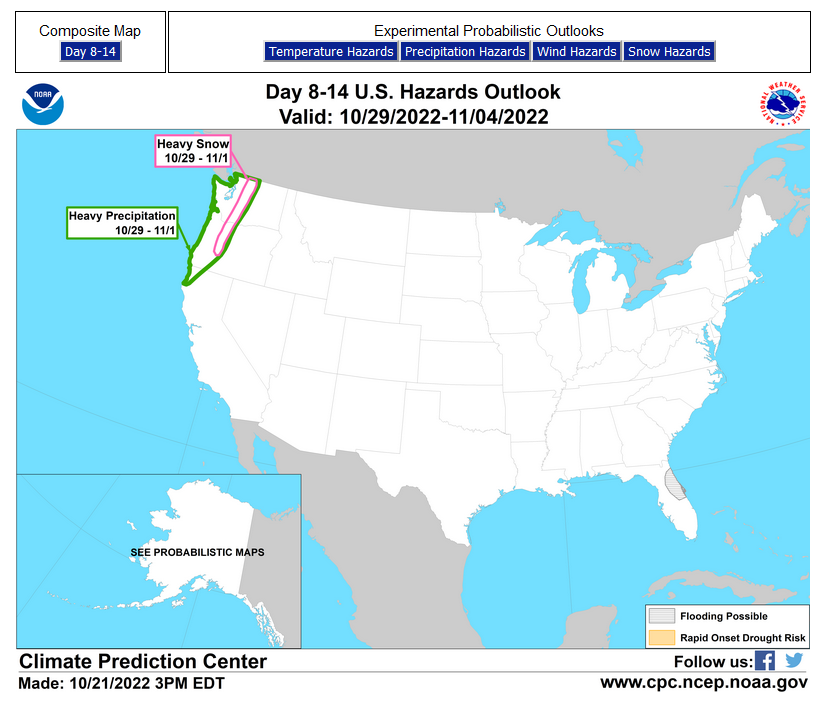
Current forecast of heavy precipitation (Updates can be found HERE)
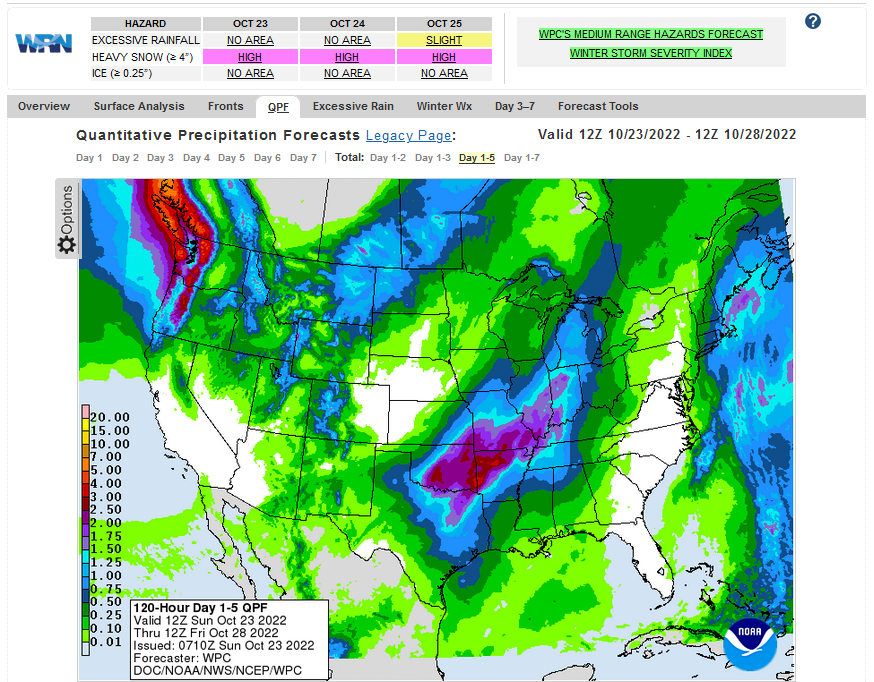
Maps that relate the forecast to geography can be found by clicking Here for Day 1 and Here for Day 2.
Here is a 60-hour animated forecast map that shows how the short-term forecast is expected to play out
If it needs to be updated click here.
ATMOSPHERIC RIVERS
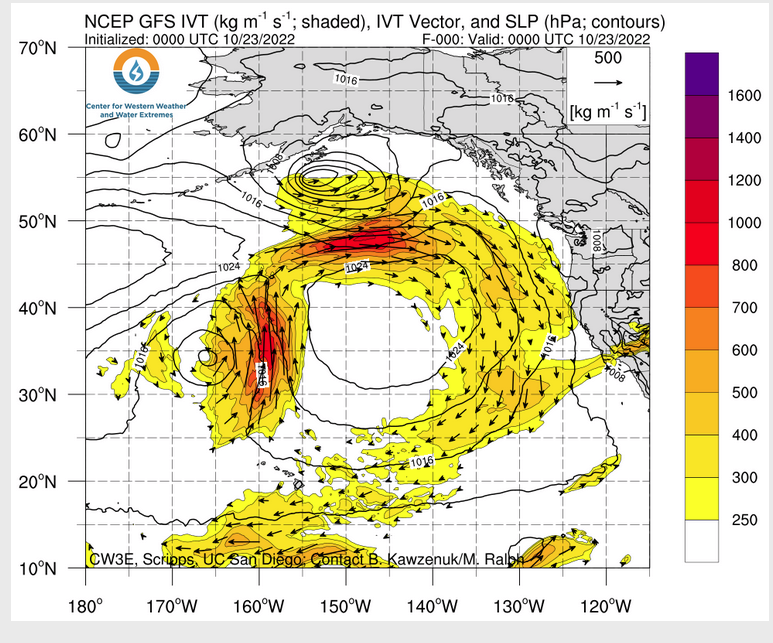
Click HERE to update. HERE is some useful information about Atmospheric Rivers.
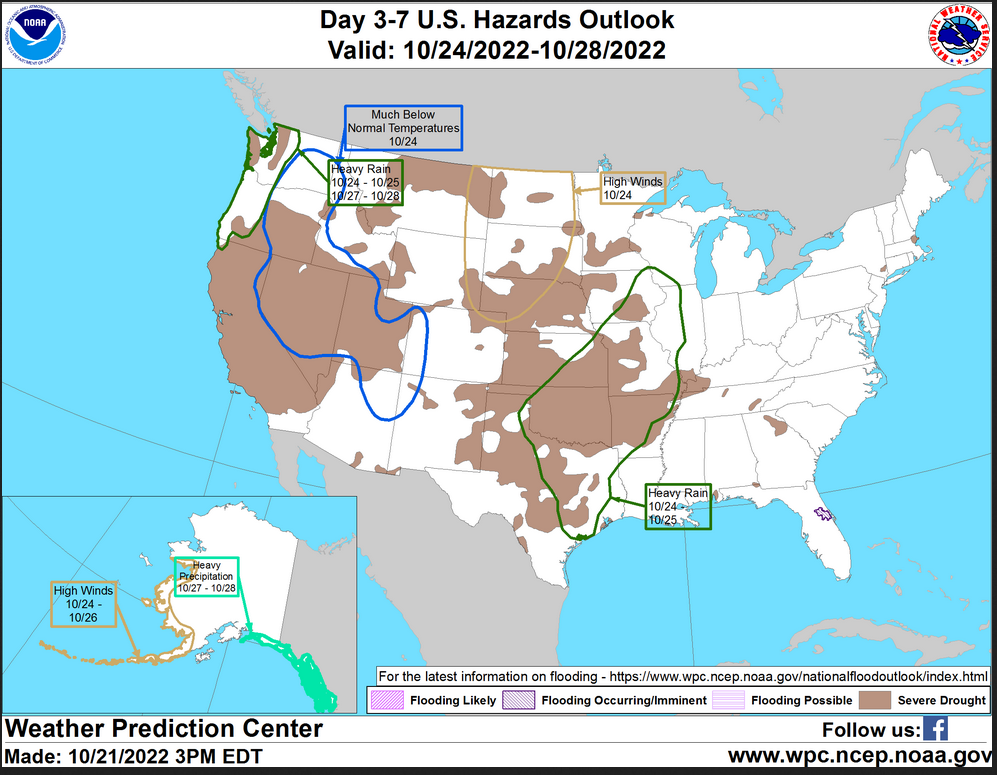
HAZARDS OUTLOOKS
Click here for the latest complete Day 3 -7 Hazards forecast which updates only on weekdays. Once a week probably Monday or Tuesday I will update the images. I provided the link for readers to get daily updates on weekdays. Use your own judgment to decide if you need to update these images.
Worldwide Tropical Forecast
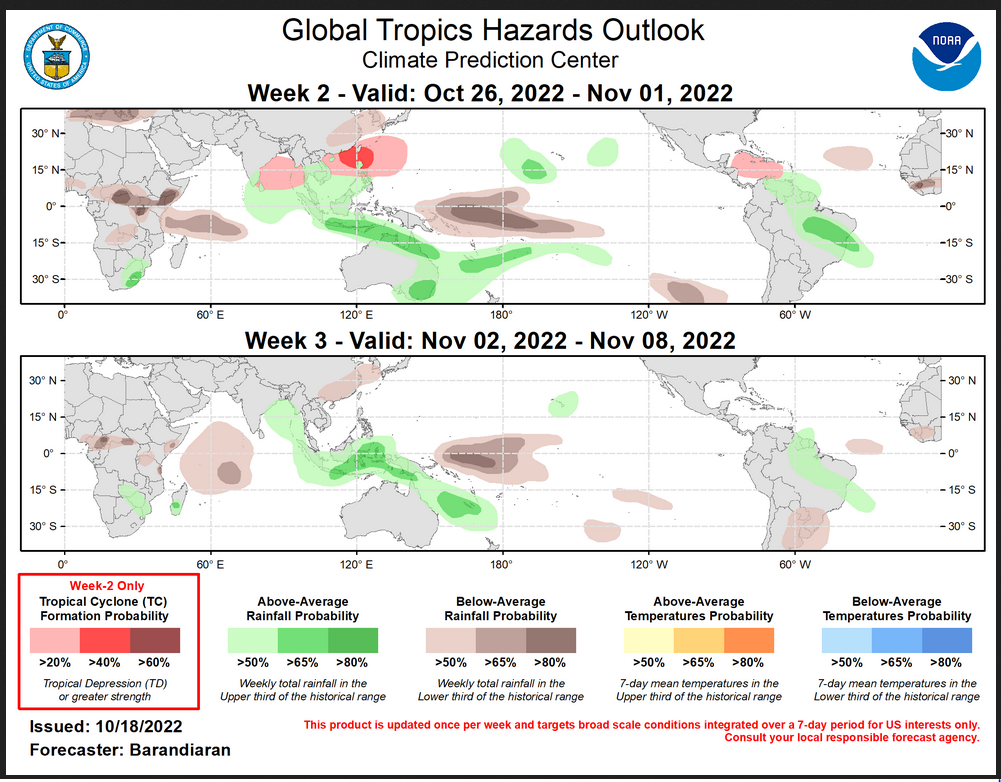
(This graphic updates on Tuesdays) If it has not been updated, you can get the update by clicking here This is a new approach and covers weeks 2 and 3 not weeks 1 and 2. It has more information but I am having trouble getting used to it. As usual, it comes with a discussion which is below
Detailed Maps and Reports for the Western Atlantic and the Pacific Oceans
Below are four maps that summarize the situation for the Atlantic, Eastern, Central Pacific, and Western Pacific. Additional information can be accessed by clicking HERE
First the Atlantic
Click to view the forecast map and have access to additional information https://www.nhc .noaa.gov/gtwo.php?basin= atlc&fdays=5
Then Eastern Pacific
Click to view the forecast map and have access to additional information https://www.nhc.noaa.gov/gtwo.php?basin=epac&fdays=5
Then Central Pacific
Click to view the forecast map and have access to additional information https://www.nhc.noaa.gov/gtwo.php?basin=cpac&fdays=5
And the Western Pacific
Click to view the forecast map and have access to additional information https://www.metoc.navy.mil/jtwc/jtwc.html
Some Intermediate-Term Outlooks
Links to “Outlook” maps and discussions for three time periods. Days 6 – 10, Days 8 – 14, and Weeks 3 and 4. An outlook differs from a forecast based on how NOAA uses these terms in that an “outlook” presents information from deviation from normal and the likelihood of these deviations.
You have to click on the links because they do not update automatically and I do not want to have stale images in the article. But it is not difficult to click on a link and you get a large image plus a discussion. On Fridays in a separate article, we will show the images and provide a link in this article that article. But remember what you will see is the images as of Friday. But here you can get the current images simply by clicking on them. Then hit the return arrow at the upper left of your screen to return to the article. You will not find this information easily anywhere else.

Right now you can find these maps here (We show them every Friday there but you can click above and find them).
Worldwide Weather
Below is the current or short-term precipitation forecast which can be updated by clicking HERE Additional maps can be obtained HERE.


Month to Date Information
Month to date Temperature can be found at https://hprcc.unl.edu/products/maps/acis/MonthTDeptUS.png
Month to date Precipitation can be found at https://hprcc.unl.edu/products/maps/acis/MonthPNormUS.png
