Preparing to say goodbye to La Nina early in 2023. Now it looks like La Nina will remain until Spring.
Today is the third Thursday of the month so right on schedule NOAA has issued what I describe as their Four-Season Outlook. The information released also includes the Early Outlook for the single month of November plus the weather and drought outlook for the next three months. I present the information issued and try to add context to it. It is quite a challenge for NOAA to address the subsequent month, the subsequent three-month period as well as successive three-month periods for a year or a bit more.
It is very useful to read the excellent discussion that NOAA issues with this Seasonal Outlook. NOAA seems to be more confident about making predictions beyond six months. They even predict a good monsoon next summer which they never do this far in advance.
I will be writing a subsequent article on the challenges to the Agriculture Sector in certain parts of CONUS.

First let’s Take a Look at the Preliminary Outlook for November
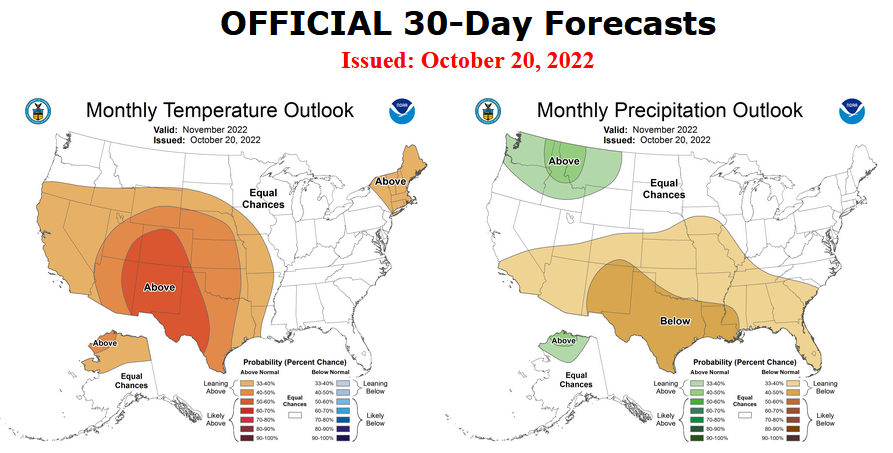
Combination Early Outlook for November and the Three-Month Outlook
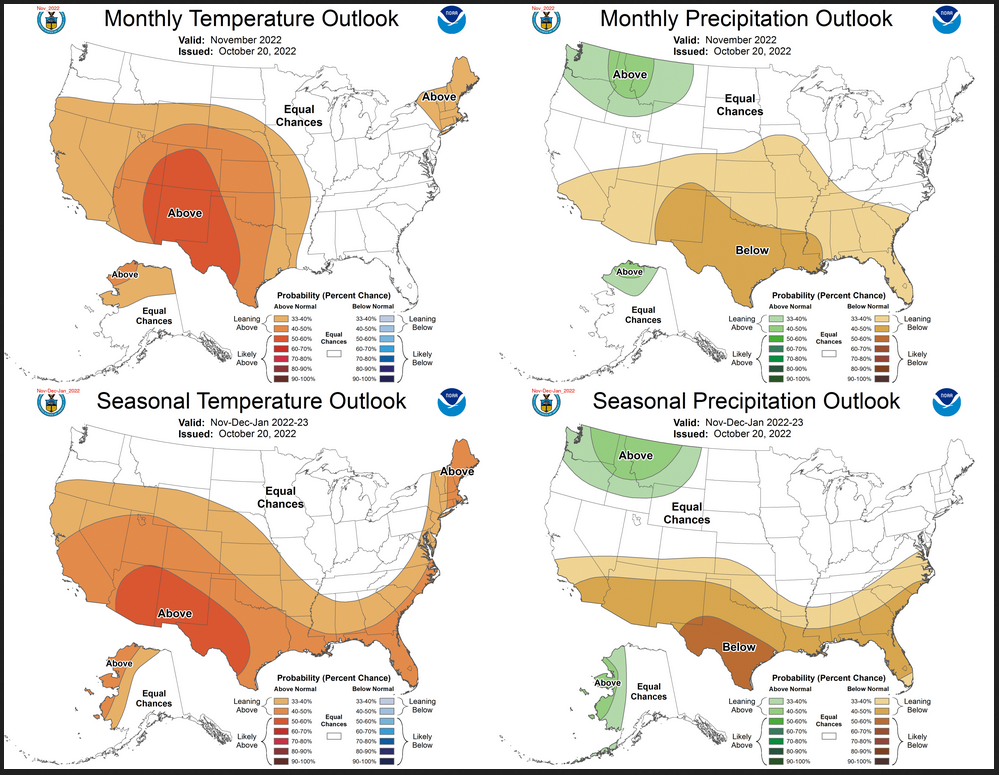
The top row is what is now so-called the Mid-Month Outlook for November which will be updated at the end of October. There is a temperature map and a precipitation map. The second row is a three-month outlook that includes November. I think the outlook maps are self-explanatory. What is important to remember is that they show deviations from the current definition of normal which is the period 1991 through 2020. So this is not a forecast of the absolute value of temperature or precipitation but the change from what is defined as normal or to use the technical term climatology.
| Notice that for precipitation, the November and three-month outlooks are very similar. This suggests that the December/January Precipitation outlook is also similar to both the November and the three-month outlook. It is somewhat the same situation for temperature but not for the eastern part of the Southern Tier. So for those areas, the December/January outlook is warm. |
| For both temperature and precipitation, if you assume the colors in the maps are assigned correctly, it is a simple algebra equation to solve the month two/three anomaly probability for a given location = (3XThree-Month Probability – Month One Probability)/2*. So you can derive the month two/three outlook this way. You can do that calculation easily for where you live or for the entire map. |
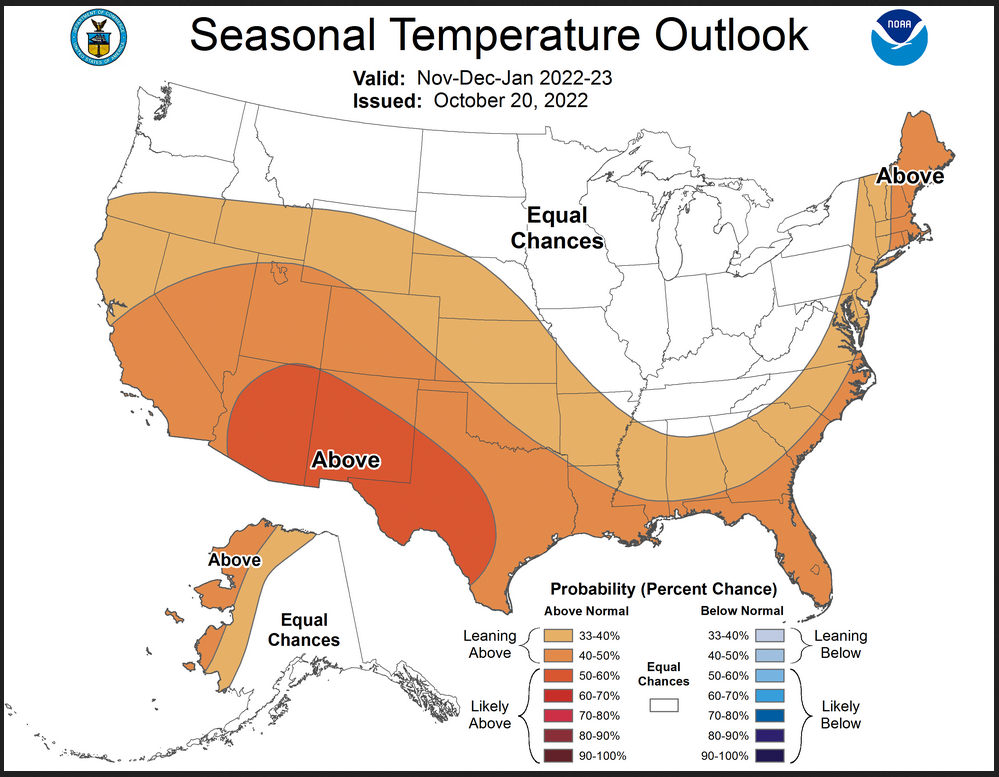
Here are larger versions of the Temperature and Precipitation outlook maps for the single month of November
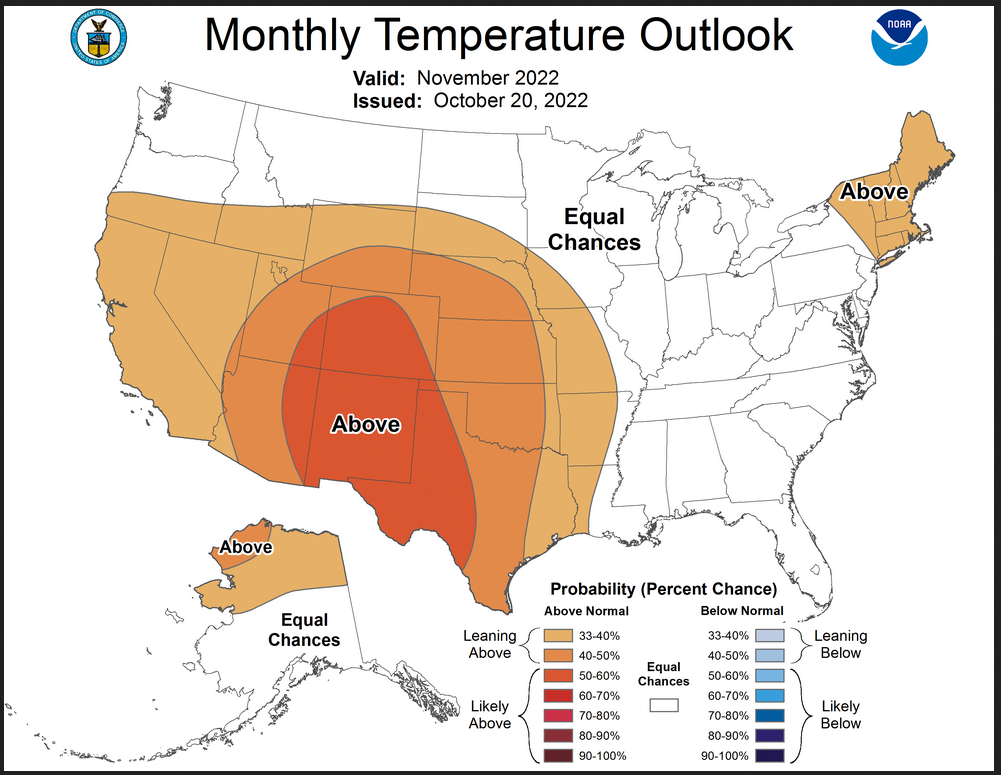
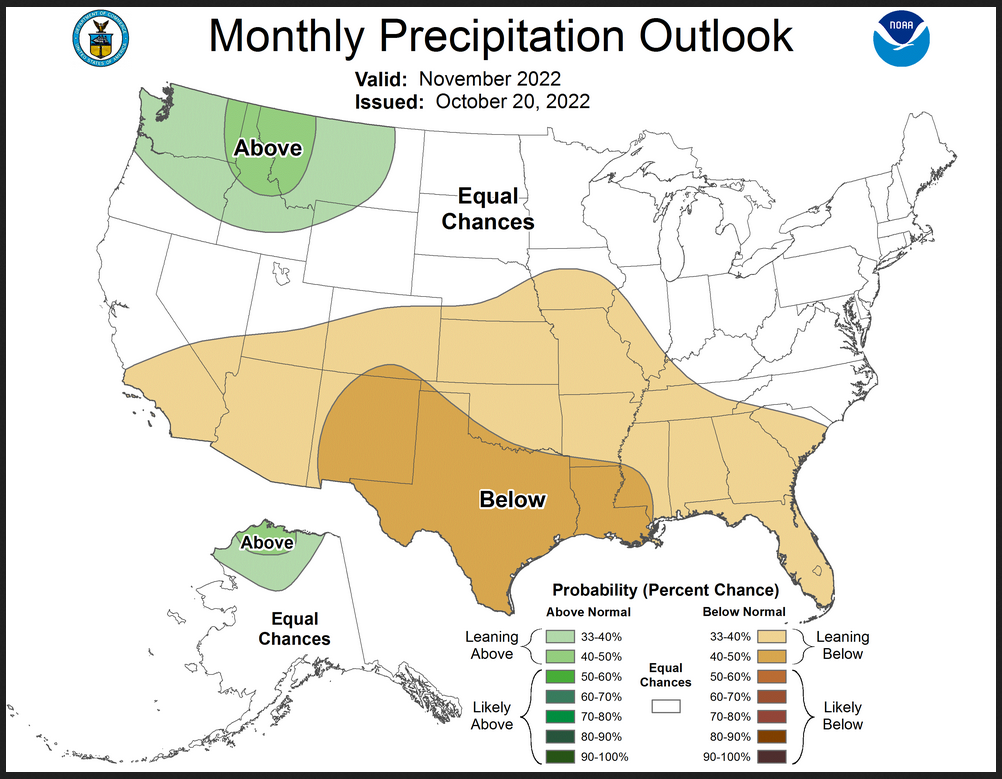
The maps are pretty clear in terms of the outlook.
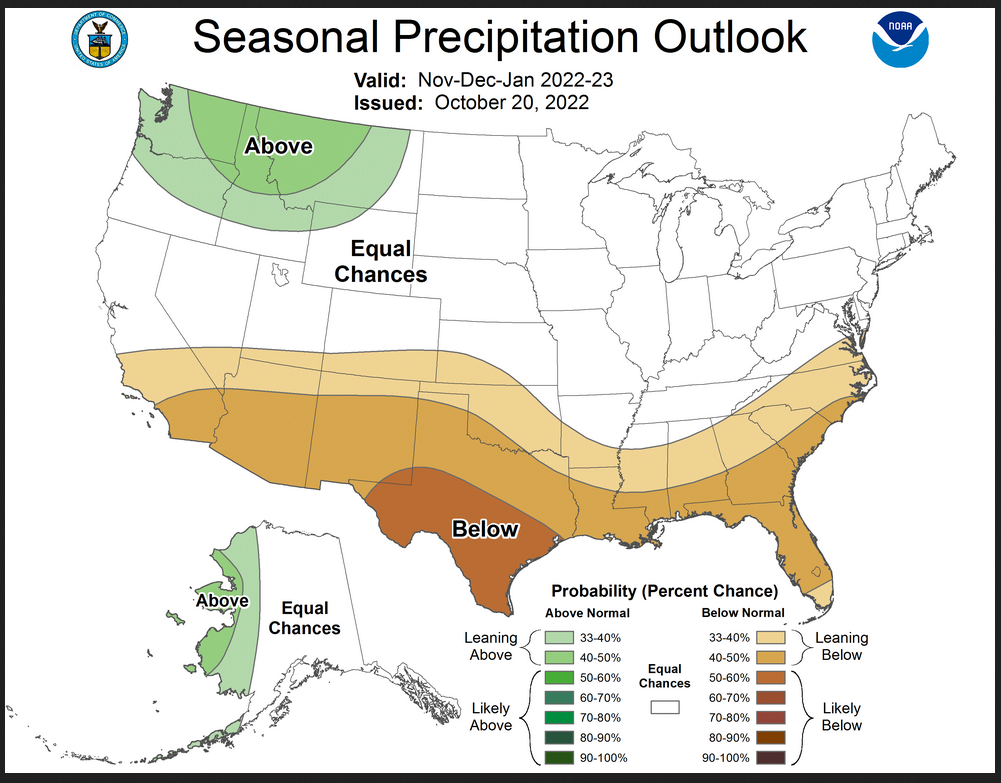
And here are large versions of the three-month NDJ 2022-2023 Outlook
First temperature followed by precipitation.
The maps are larger versions of what was shown in the first graphic that had smaller versions of all four of these maps.
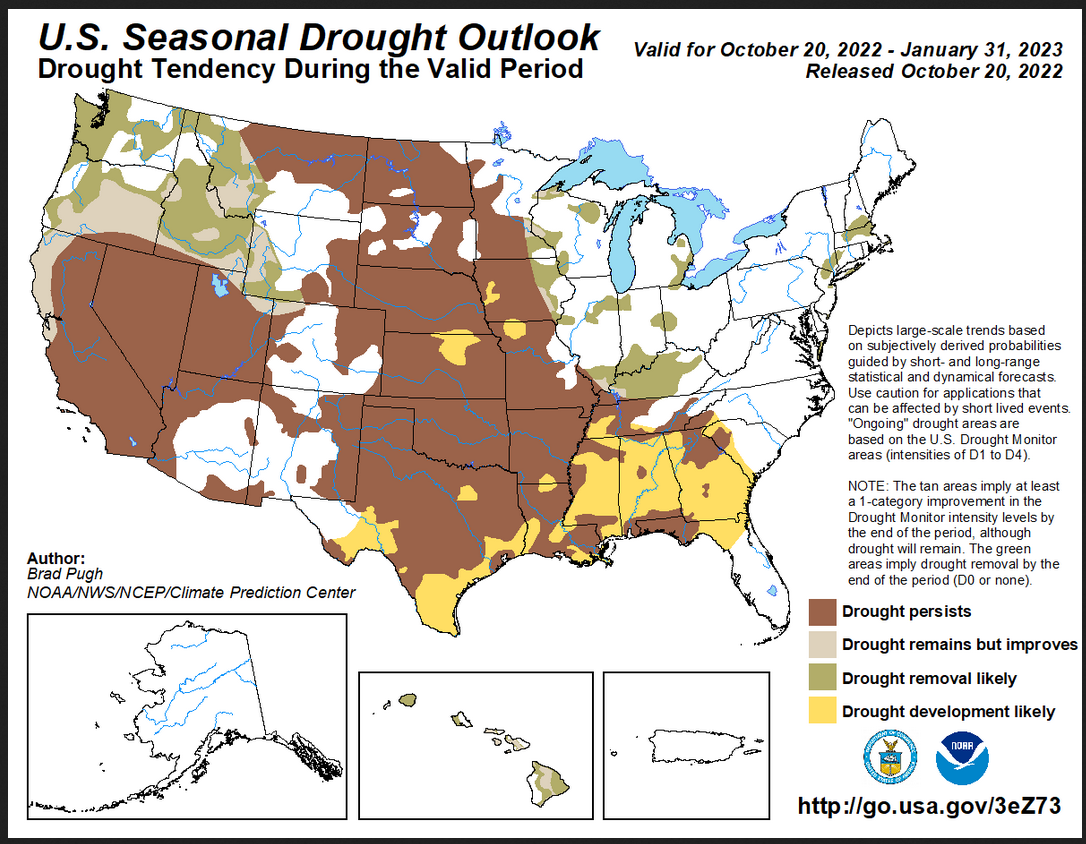
Drought Outlook
–
|
The yellow is the bad news and there is a lot of it. And this is a three-month outlook plus the remainder of October. The South Central and to the east will have serious drought problems. The Hawaiian Islands improve.
|
Short CPC Drought Discussion
Latest Seasonal Assessment – Drought expanded and intensified across the Pacific Northwest, Great Plains, Mississippi Valley, Ohio Valley, and Southeast since mid-September. This large drought expansion was due to an unusually dry September and a continuation of a dry pattern into early October. Improving drought conditions were limited to the East Coast and Southwest. The highest forecast confidence in the seasonal drought outlook (valid from October 20, 2022 – January 31, 2023) exists across the Great Plains and Southeast where drought is likely to persist with additional development. The persistence over the Great Plains is related in part to an increasingly dry climatology during the late fall and winter, while the forecast in the Southeast is consistent with typical La Niña impacts and the seasonal precipitation outlook. Prospects for drought improvement or removal increase for parts of the Midwest, but forecast confidence is low for this region. Drought coverage decreased in recent weeks along the East Coast and drought is expected to end across the Northeast during the outlook period.
A major pattern change is forecast for the Pacific Northwest during late October with above-normal precipitation increasingly likely. Along with typically wet La Niña impacts, improvement or removal is forecast for the Pacific Northwest. This improvement or removal extends eastward to the north-central Rockies and southward to coastal northern California due in part to a relatively wet climatology during November-December-January. For the remainder of California and the Southwest, broad-scale persistence is more likely.
Drought improvement or removal is forecast for Hawaii, consistent with La Niña impacts and entering into their wet season. Alaska and Puerto Rico are likely to remain drought-free through the end of January 2023.
Looking out Four Seasons.
Twelve Temperature Maps
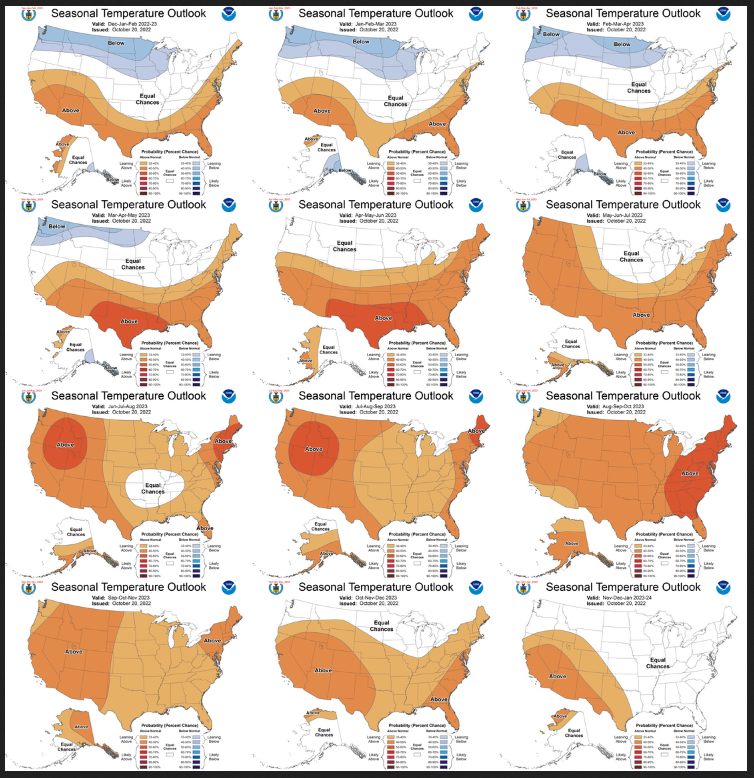
Notice that this presentation starts with December/January/February 2022/2023 (DJF since NDJ is considered the near-term and is covered earlier in the presentation. The changes over time are generally discussed in the discussion but you can see the changes easier in the maps.
And the maps that were released last month.
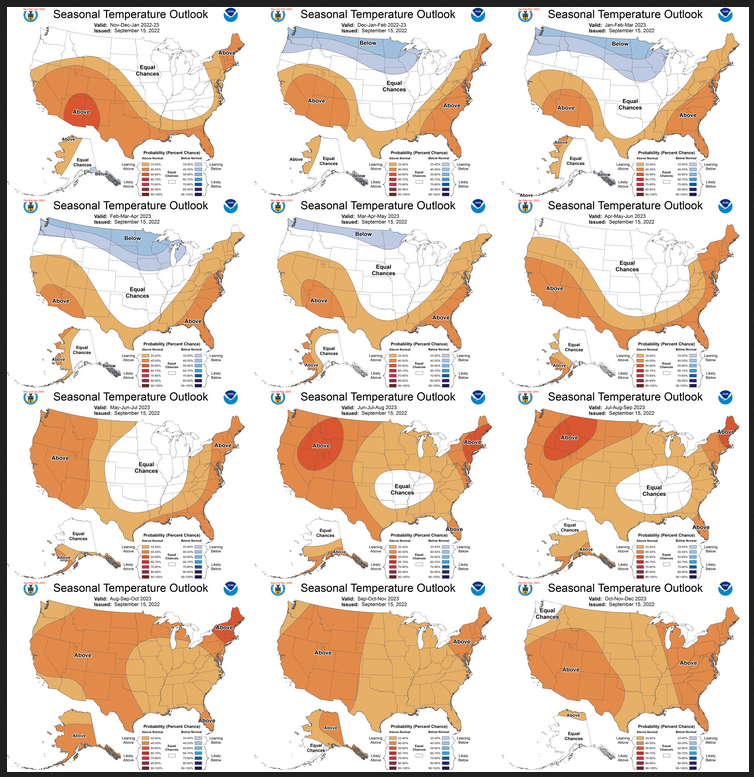
| When I compare the two maps, what I see is that the new set of maps are generally similar to what was shown last month. |
Twelve Precipitation Maps
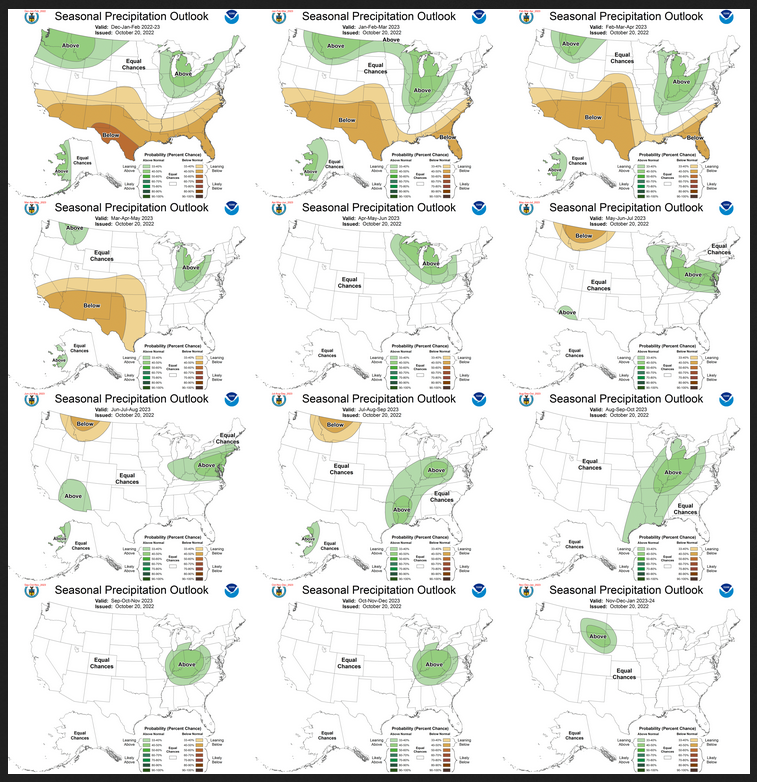
Similar to Temperature in terms of the organization of the twelve overlapping three-month outlooks. The changes over time are generally discussed in the discussion but you can see the changes easier in the maps.
And the maps that were released last month.
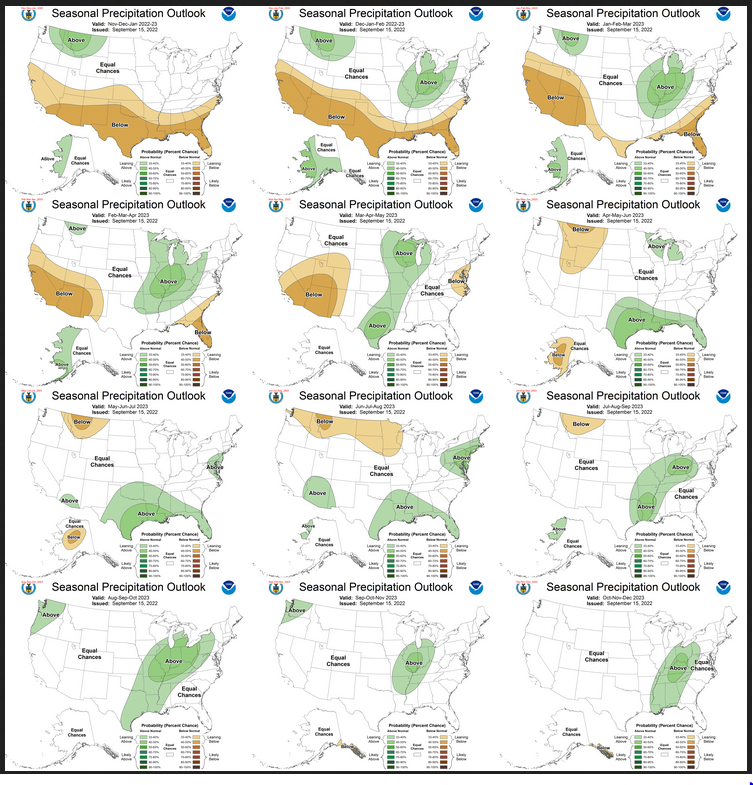
| When I compare the maps, what I see is that like last month there is a major change that occurs from AMJ 2023 to JJA 2023. In the prior NOAA Outlook, there was a wet anomaly that is not in the new Outlook. The change actually starts in MAM 2023. The Southern Tier dry anomaly is more robust early on and extends more broadly into FMA 2023. |
NOAA Discussion
Maps tell a story but to really understand what is going you need to read the discussion. I combine the 30-day discussion with the long-term discussion and rearrange it a bit and add a few additional titles (where they are not all caps the titles are my additions). Readers may also wish to take a look at the article we published last week on the NOAA ENSO forecast. That can be accessed here.
I will use bold type to highlight some things that are especially important. My comments, if any, are enclosed in brackets [ ].
Prognostic Discussion for Monthly Outlook
NWS Climate Prediction Center College Park MD
830 AM EDT Thu Oct 20 2022
CURRENT ATMOSPHERIC AND OCEANIC CONDITIONS
La Nina conditions have remained in place throughout the summer and into the autumn months of 2022 in the Pacific Ocean as indicated by both ocean and atmospheric indicators and a La Nina Advisory remains in effect. Equatorial Pacific ocean surface temperature departures are negative from just west of the Date Line to the South American coast with anomalies in many areas at or less than -1.0 degrees C with some locations in the eastern Pacific reaching -1.5 degrees C or less. The latest weekly Nino4 and Nino3.4 region SST departures were -1.1 and -0.8 degrees C respectively.
A strong reservoir of colder than normal water is observed via ocean temperatures along the equator from 155 W to 90 W at a depth ranging from near the surface to 200 meters depth in the east-central Pacific. The negative ocean temperature anomalies in this area range from -4.0 to -6.0 degrees C in some places. This colder than average water supports maintenance of La Nina conditions in the equatorial Pacific into the winter months.
The atmospheric state is displaying characteristics quite consistent with La Nina with enhanced convection on average in proximity to Indonesia and suppressed convection near the Date Line. Trade winds are considerably enhanced and upper-level westerly wind anomalies are present in the central Pacific with symmetric cyclonic circulations both north and south of the equator.
Large areas of above-normal sea surface temperatures (SSTs) reside in both the north Pacific and north Atlantic oceans. More local coastal SSTs are above-normal for coastal waters near the northwest coast of Alaska as well as the entire West coast of the CONUS. [Author’s Note: Is that an indication of a switch to PDO+? We will have to watch this carefully] Anomalous SSTs along the east coast are more mixed at the current time.
PROGNOSTIC DISCUSSION OF SST FORECASTS
The CPC Nino3.4 SST consolidation forecast shows a nearly steady trend through DJF 2022-2023 of near -1.0 degrees C with the CA, Markov statistical models colder during this period and the NMME ensemble mean and CCA predictions warmer during this period. Thereafter, the consolidation forecast and all guidance forecasts a trend of less negative anomalies over time into ENSO neutral territory by the MAM or AMJ 2023 seasons. There is somewhat remarkable agreement and low spread in the forecast tools at this lead (AMJ 2023) as compared to the two preceding La Nina events.
The CPC / IRI official ENSO outlook depicts high probabilities for La Nina -greater than 85% and 75% through NDJ and DJF 2022-2023 respectively. Thereafter by FMA 2023, ENSO neutral becomes the most favored category and this continues through MJJ 2023.
PROGNOSTIC TOOLS USED FOR U.S. TEMPERATURE AND PRECIPITATION OUTLOOKS
Potential common impacts known to be associated with La Nina winters are utilized in preparation of the outlook via standard techniques that include composite analysis (including consecutive La Nina events) and regressions anchored to Nino3.4 SST in both diagnostic and prognostic terms. La Nina impacts are considered through the MAM 2023 forecast lead.
Statistical guidance, particularly the global SST based CA, played a considerable role along with long term temperature and precipitation trends (OCN) for many leads. Dynamical model guidance from the NMME and Copernicus (C3S) multi-model ensemble systems are utilized through MAM 2023. In addition, objective, historical skill-based consolidation tools contribute to the outlook and include the ENSO/OCN and the complete suite of statistical/dynamical tool combinations. Coastal anomalous SSTs are also considered especially at early leads.
30-DAY OUTLOOK DISCUSSION FOR NOVEMBER 2022
The November 2022 Temperature and Precipitation Outlooks are prepared against a backdrop of established La Niña conditions in the Tropical Pacific, and include the latest statistical and dynamical model guidance, impacts from decadal trends, and local sea surface temperature (SST) anomalies. The latest NINO3.4 weekly SST departures reached -0.8 degrees Celsius and the tropical Pacific atmosphere remains consistent with La Niña. Following a progressive Madden Julian Oscillation (MJO) pattern in both observations and forecasted Realtime Multivariate MJO (RMM) indices, recent RMM forecasts from the Global Ensemble Forecast System (GEFS) and European Centre for Medium-Range Weather Forecasts (ECMWF) models indicate a stagnanting MJO signal. MJO did not play a significant role in the November 2022 Outlooks. Dynamical model guidance from the North American Multi-Model Ensemble (NMME), Copernicus model suite (C3S), and dynamical model predictions from the Climate Forecast System version 2 (CFSv2) were considered for the outlook, as well as statistical models that include the influence of La Niña and trend on temperature and precipitation. Week 3-4 forecasts from CFSv2 and GEFSv12 for the early part of November were also considered.
Temperature
Week-2 dynamical model guidance favors troughing over the Western US, which is expected to shift eastward by the Week 3-4 period (early November). By the Week 3-4 period, GEFSv12 and CFSv2 are in agreement on western U.S. ridging, while the strength, location, and timing of predicted troughing over the eastern U.S. is uncertain. Recent monthly CFSv2 temperature forecasts favor above normal probabilities over the western U.S. with weaker probabilities over the eastern U.S., likely related to the forecasted ridge and trough pattern. Though there is good agreement among tools on above normal temperature probabilities over much of the western and south-central U.S., monthly forecasts of temperature from NMME and C3S favor weaker, but still above normal temperature probabilities over the eastern U.S. A consolidation of statistical tools indicates equal chances of above, normal, or below normal temperatures (EC) from the eastern part of Texas to the east coast, with increased odds of above normal temperatures in the western U.S. Given the agreement among tools on probability of above normal temperatures over the western U.S. along with forecasted ridging, above normal temperature probabilities are indicated for much of the western 2/3 of the CONUS. The area of highest probabilities over the Southwest and parts of Texas is consistent with the region of strongest dynamical and statistical model agreement. A weak tilt toward above normal temperatures is favored over parts of New England owing to decadal trends as well as consistency between NMME and C3S, however, coastal SSTA are cool or mixed which led to a dampening of the probabilities. In contrast, uncertainty in the strength, position, and timing of the forecasted troughing during the early part of November, along with weak signals from NMME, C3S, and statistical guidance led to EC over the Great Lakes, Mid-Atlantic, and Southeast. There is some indication of weak odds of below normal temperatures over the Pacific Northwest when considering a statistical tool of constructed analogues of NINO3.4 SSTA, however, this signal is not consistent in NMME, C3S, or other available statistical tools, thus, EC is also favored for the Pacific Northwest and northern parts of CONUS.
Temperature forecasts over Alaska are mixed, with GEFS and CFSv2 disagreeing on the strength and positioning of troughing or ridging over Alaska in early parts of November, and much of Alaska tilting toward EC in monthly statistical and dynamical tools. The area of best agreement is along the North Slope of Alaska where trends and expected La Niña impacts tilt toward above normal temperatures. This is further supported by warmer than normal SSTs and below normal sea ice off the north coast of Alaska. As such, EC is favored for much of southern Alaska in the November Outlook, with a small area of above normal temperatures favored over the North Slope.
Precipitation
A generally dry pattern is favored by dynamical and statistical models over much of the southern half of the U.S. Recent CFSv2 predictions favor an overall dry pattern over most of CONUS, with some weakness in the western U.S. and a tilt toward above normal precipitation in the Pacific Northwest. The dry southern tier of CONUS is consistent with expected La Niña impacts. The area of strongest statistical and dynamical model agreement on below normal precipitation is from the region stretching from Arizona across Texas, and probabilities are enhanced accordingly. A tilt toward above normal precipitation is indicated over the Pacific Northwest, consistent with expected impacts from La Niña and dynamical model guidance from NMME and C3S. EC is indicated for the northern Great Plains to the Northeast given weak or inconsistent signals from statistical and dynamical model guidance.
Elevated probabilities of above normal precipitation are favored for the North Slope of Alaska given expected impacts from La Niña and decadal trends . EC is favored for the remainder of Alaska given uncertainty amongst tools.
SUMMARY OF THE OUTLOOK FOR NON-TECHNICAL USERS (Focus on November- December- January)
The November-December-January 2022-2023 temperature outlook depicts elevated odds for above-normal seasonal mean temperatures for western Alaska, much of the western U.S. to include the central Great Basin, central and southern Rockies, and Southwest, eastward to include much of the central and southern Great Plains, areas of the Southeast and along the Atlantic seaboard. The greatest likelihood for warmer than normal temperatures is for the Southwest and southern Great Plains.
For precipitation, above-normal seasonal precipitation amounts are favored for the west coast of Alaska, the Pacific Northwest and the northern Rockies. Drier-than-normal conditions are most likely along the southern tier of the U.S. from California eastward to the southern Plains and Southeast with the greatest likelihood for southern Texas.
Areas depicted in white and labeled “EC” (Equal-Chances) are regions where climate signals are weak and so there are equal odds for either above-, near- or below-normal seasonal mean temperatures and total precipitation amounts.
La Nina conditions remain in place in the Pacific Ocean and its influence continues to contribute to the temperature and precipitation outlooks through the upcoming winter months into early Spring 2023.
BASIS AND SUMMARY OF THE CURRENT LONG-LEAD OUTLOOKS
PROGNOSTIC DISCUSSION OF OUTLOOKS – NDJ 2022 TO NDJ 2023
TEMPERATURE
The NDJ 2022-2023 temperature outlook favors above-normal temperatures for much of the western U.S. eastward to include much of the central and southern Great Plains, areas of the Southeast and also along the Atlantic seaboard. The expectation of La Nina conditions and enhanced odds for associated common impacts – on average over many events – is a primary driver of the evolution of the temperature outlooks from NDJ 2022-2023 through the MAM 2023 lead. Multiple types of guidance was utilized for this assessment and included La Nina composites, ENSO regression / correlation information, statistical forecast tools and dynamical model forecasts.
Although some of the participant models within the NMME and C3S suite maintained the colder signature starkly shown in last month’s data typically associated with La Nina in areas of Alaska, Canada and the northern U.S., in general, the NMME overall ensemble mean probabilities are considerably warmer in this month’s set of forecasts. For many of these areas in the U.S. and southern Canada, however, calibration based on historical forecast skill dramatically decreased probabilities and so confidence is low. Moreover, further inspection of 200-hPa height information from the NMME suite indicated that anomalous positive heights forecast at higher latitudes last month are reduced in this months forecast with a weaker mean Hudson Bay trough in the warmer NMME solutions. This strongly hints at a considerable change in the forecast AO phase over the winter months. Predictability of the seasonal AO phase is low. Given the reasons and associated uncertainty noted above, along with large areas of positive SST anomalies in both the north Pacific and Atlantic, incorporated in the CA statistical guidance, there was not significant changes at this time to the favored below-normal temperature forecast evolution from DJF 2022-2023 through MAM 2023 despite the warmer overall NMME solution this month.
The official outlooks over time increase coverage of below-normal temperatures for the Pacific Northwest eastward to the northern Plains and western Great Lakes in DJF 2022-2023 and JFM 2023 and relax this area northward (less coverage and lower probabilities) in FMA and MAM 2023.
A forecast for elevated odds of overall colder conditions for the Northeast is implied in the outlooks from NDJ 2022-2023 through FMA 2023. La Nina events are often characterized by high subseasonal variability especially for the north-central CONUS, Ohio Valley and Northeast as these areas are strongly impacted by variations in the AO/NAO and potential stratospheric influences [Author’s Note: Perhaps even the impact of the January 2022 Tonga Eruption] (typically more likely during the second half of winters) – all of which are very difficult to reliably predict at these lead times. Consequently, the coverage of Equal-Chances (EC) is large in some of these areas from JFM to MAM 2023.
The greatest odds for above-normal temperatures slowly shifts from the Southwest to the Southeast over the period from NDJ 2022-2023 to FMA 2023 with a minimum in both probabilities and coverage in the southern Plains during the JFM 2023 season.
For Alaska, enhanced chances for below-normal temperatures for southeast Alaska and the Alaska Panhandle are introduced in DJF 2022-2023 and maximize in JFM 2023 before decreasing and timing off after MAM 2023. Anomalously positive ocean surface temperatures tilt the odds for above-normal temperatures for parts of the west coast of Alaska through JFM 2023.
Odds for favored above-normal temperatures are increased for the south-central southern Plains during MAM, AMJ and MJJ 2023 from the previous set of outlooks due to severe drought conditions currently ongoing and with the prospects for below-normal winter precipitation. If realized, this increases odds for above-normal temperatures during the spring and early summer months.
The remaining set of temperature outlooks remain generally the same from the September release and are based on the ENSO/OCN and other consolidation forecast tools for which long term temperature trends contribute significantly at times in various regions.
PRECIPITATION
For the NDJ 2022-2023 precipitation outlook, above-normal seasonal precipitation amounts are most likely for the west coast of Alaska, the Pacific Northwest and northern Rockies. Drier-than-normal conditions are most likely for the southern tier of the U.S. from southern California eastward to the southern Plains and Southeast.
Similar to that described above for temperature, the evolution of the precipitation outlooks through MAM 2023 are anchored to first order from potential typically observed impacts during La Nina winters – on average over many events. The greatest odds for below-normal precipitation during NDJ and DJF 2022-2023 are positioned primarily for southern Texas. In addition, consolidation of both statistical and dynamical model guidance (NMME, C3S) modified the base state La Nina favored impacts and this approach was primarily followed in the outlooks through MAM 2023. Long term precipitation trends, especially positive (more wet) trends in numerous areas in the Midwest and eastern CONUS, contributed to the outlooks over this forecast period as well. The later set of outlooks are primarily based on long term precipitation trends .
Review of the ENSO Assumptions utilized by NOAA (CPC) in Preparing this Four-Season Outlook
It is useful to review the ENSO forecasts used by NOAA to produce this Four-Season Outlook. We reported on that last week and you can read that article by clicking HERE
The key information used by NOAA follows.
IRI CPC ENSO STATE Probability Distribution (IRI stands for the International Research Institute for Climate and Society)
Here are the new forecast probabilities. This information is released twice a month and the first release is based on a survey of Meteorologists, the second is based on model results. The probabilities are for three-month periods e.g. SON stands for September/October/November. I am just showing the first release which is what we have and presumably what NOAA (actually their CPC Division) worked from.

| Notice for JFM 2023 the probability of La Nina exceeds the probability for ENSO Neutral. But for FMA the probability for ENSO Neutral slightly exceeds that for La Nina. So maybe March is when the ocean conditions will be consistent with ENSO Neutral but the impact on our weather may lag a month or so. So we really seem to be looking a La Nina into Spring. This is a very slight change from the analysis made last month. NOAA refers to a difference between the dynamic models and the statistical models which show the transition to be slightly later and NOAA leans towards the statistical models as per their discussion. |
Tropical Subsurface Temperature Anomalies
| From what I see here, I do not know when the La Nina will end but I am reporting what NOAA says. |

–
| The above will not auto-update. But the image will update if you click HERE. https://www.cpc.ncep.noaa.gov/products/people/wwang/cfsv2fcst/images3/nino34SeaadjPDFSPRDC.gif
NOAA relies more on the IRI Forecast. But perhaps this model is now showing that we may become ENSO Neutral in late winter. It is a dynamic rather than a statistical model so it is in line with what NOAA is saying. |
Resources
The link for the drought outlook map and some discussions that come with the map can be found by clicking HERE.
| I hope you found this article useful and interesting. |