Here is what we are paying attention to this evening and the next 48 hours from this afternoon’s NWS Forecast.
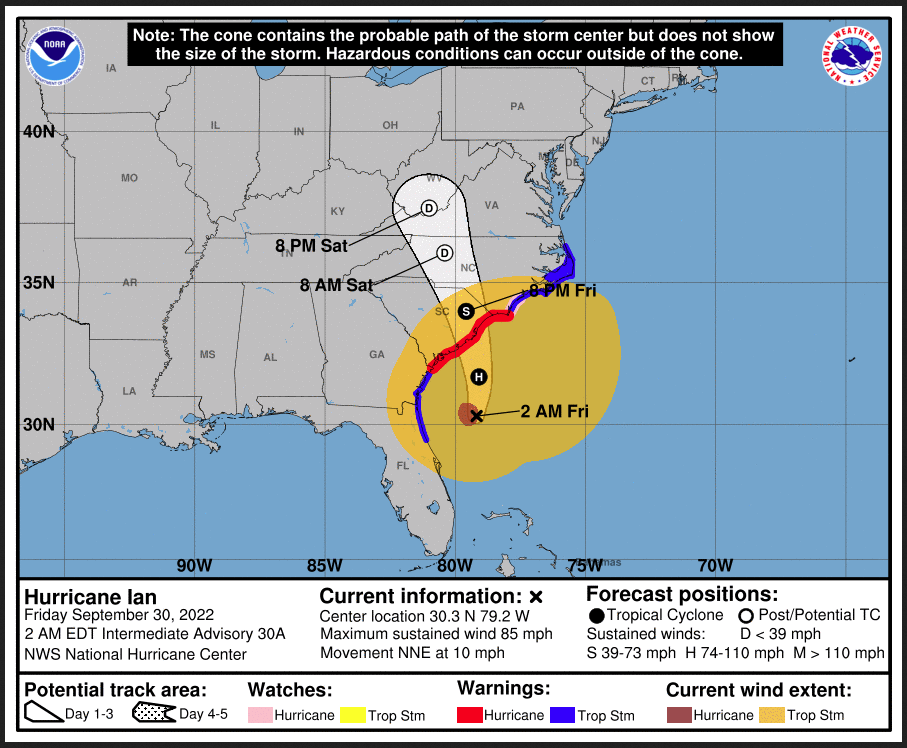
...Hurricane Ian forecast to make second landfall in South Carolina Friday
bringing wind, heavy rain, and the threat of severe weather to the
Carolinas and Mid-Atlantic...

...Unseasonably cool temperatures forecast across the Eastern U.S. to
start the weekend...

...Showers and thunderstorms expected across portions of the Rockies,
Great Basin, and Southwest...
Continuation of the NWS Short Range Forecast (It is updated twice a day and these updates can be found here.
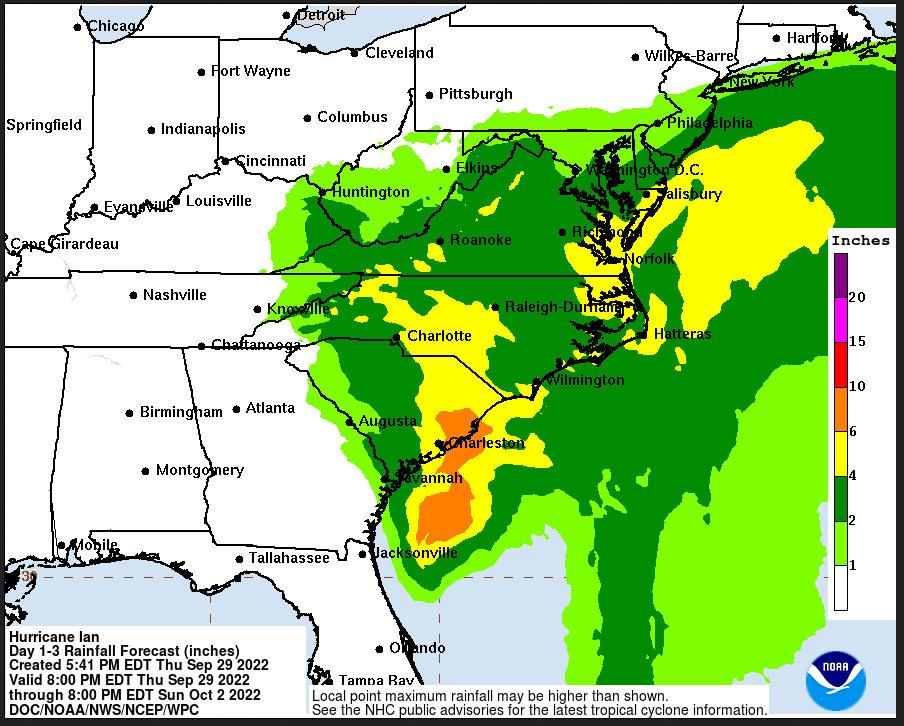
Hurricane Ian is currently forecast by the National Hurricane Center to
make a second U.S. landfall Friday afternoon in South Carolina bringing
high winds, heavy rain, and the threat of severe weather to the Carolinas
and southern Mid-Atlantic. In terms of rainfall, there is a Moderate Risk
of Excessive Rainfall for portions of eastern South Carolina, central
North Carolina, and southwestern Virginia Friday as storm forecast totals
of around 4-8 inches are expected, with isolated higher totals of up to 12
inches possible closer to the coast in the immediate vicinity of where Ian
makes landfall.  Slight Risks remain in effect for Saturday along the
immediate coast in the Mid-Atlantic where higher moisture will push
northward as the system transitions into an extratropical low, and over
portions of the central Appalachians where terrain influences will help to
produce bouts of heavier rainfall. The Storm Prediction Center has also
issued a Slight Risk of Severe Weather for coastal portions of far
southeastern Virginia, North Carolina, and far northeastern South Carolina
as increasing shear due to the approach and passage of Hurricane Ian may
lead to a few isolated tornadoes.

Elsewhere across the East, unseasonably cool temperatures are forecast due
to the influence of an expansive high pressure system from Canada and
behind a secondary cold front moving across the Southeast behind Hurricane
Ian. In fact, Freeze Warnings and Frost Advisories are in effect early
Friday Morning for the Interior Northeast as forecast low temperatures
will dip into the low to mid-30s. Highs in the 60s are forecast from the
Northeast south through the Mid-Atlantic, Appalachians, and into the
Southeast outside of the Florida Peninsula.

In the West, an upper-level low will linger over the region as a frontal
system moves slowly southeast through the Rockies and Great Basin, with
showers and thunderstorms expected both Friday and Saturday. Marginal
Risks of Excessive Rainfall are in effect both days as anomalously high
moisture and the influence of terrain may lead some of these storms to
produce 1-2 inches of rain and the risk for flash flooding, particularly
in the vicinity of burn scars, slot canyons, and dry washes. Bouts of wet
snow are expected for higher elevations in the Rockies, generally above
9000 feet. Unseasonably warm temperatures are forecast to the east and
west of the Rockies/Great Basin outside of the influence of the
upper-level low. Highs will range from the 70s in the Northern Plains to
the 80s in the Central and Southern Plains, with some highs at or above 90
not out of the question. High temperatures in the 70s for the Pacific
Northwest on Friday will warm into the 80s on Saturday, with highs at or
above 90 possible for the Rogue Valley of Oregon.
Current forecast of track and other information
Maps that relate the forecast to geography can be found by clicking Here for Day 1 and Here for Day 2.
Here is a 60-hour animated forecast map that shows how the short-term forecast is expected to play out.
If it needs to be updated click here.
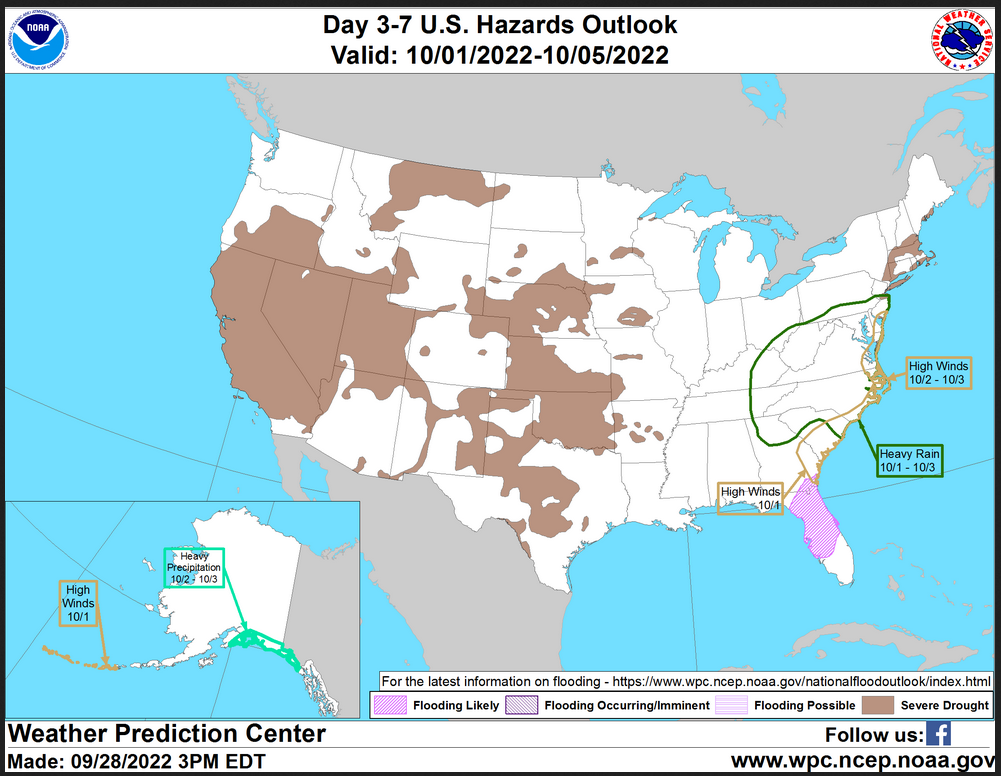
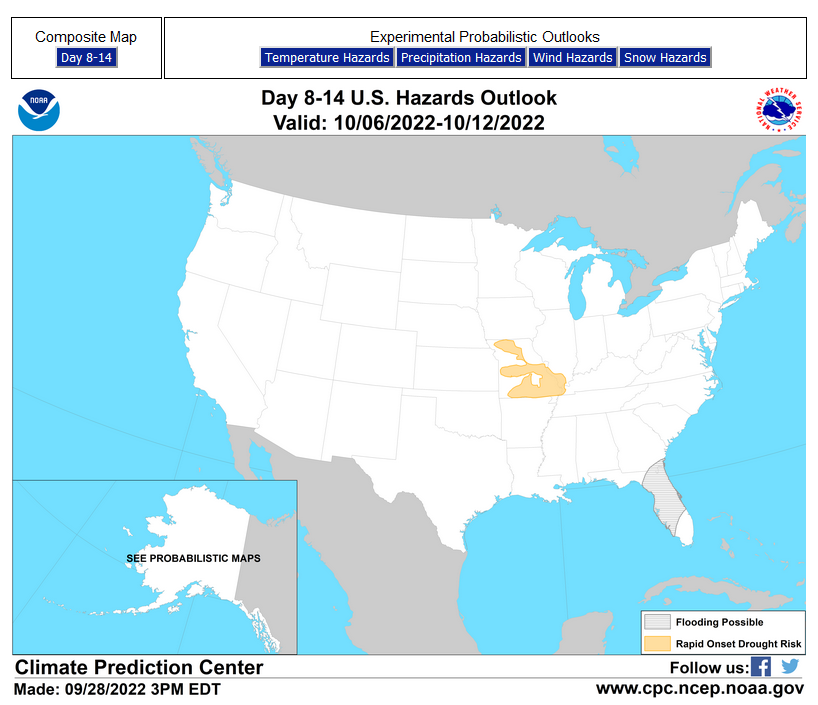
HAZARDS OUTLOOKS
Click here for the latest complete Day 3 -7 Hazards forecast which updates only on weekdays. Once a week probably Monday or Tuesday I will update the images. I provided the link for readers to get daily updates on weekdays. Use your own judgment to decide if you need to update these images.
Worldwide Tropical Forecast
(This graphic updates on Tuesdays) If it has not been updated, you can get the update by clicking here This is a new approach and covers weeks 2 and 3 not weeks 1 and 2. It has more information but I am having trouble getting used to it. As usual, it comes with a discussion which is below
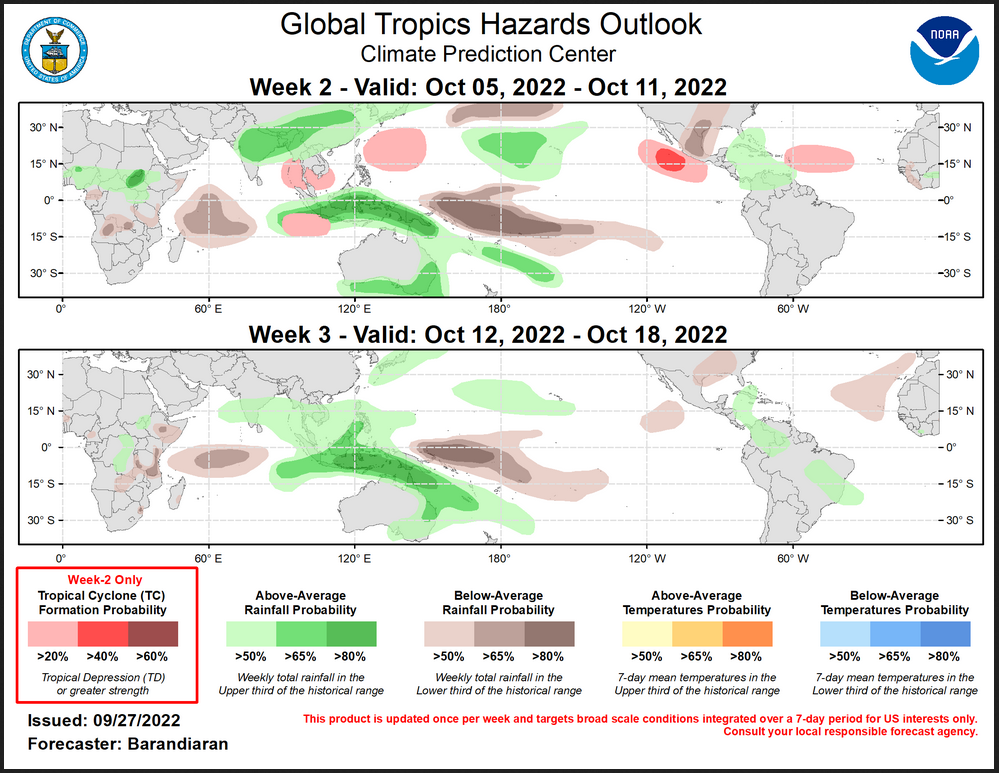
Outlook Discussion Last Updated – 09/27/22
Valid – 10/05/22 – 10/18/22
Madden-Julian Oscillation (MJO) activity is increasing after a recent period of incoherent tropical convective activity. Tropical convection is coalescing into a wave 1-like pattern with enhanced(suppressed) convection over the Maritime Continent(Eastern Pacific) and modest eastward propagation of these features, especially the suppressed phase. Looking ahead, there is widespread agreement among dynamical model RMM-based forecasts for the high probability of an upcoming significant MJO event. The general consensus is that the RMM signal will emerge from the unit circle during the week-1 timeframe in phase 4 or 5 and amplify significantly while propagating slowly eastward during weeks 2-3. Tropical cyclone (TC) activity has been high over the last week. A pair of TCs formed south of Japan (Noru, 9/22; Kulap, 9/25). Noru became a strong typhoon and is currently moving toward the Vietnam coast, while Kulap has stayed out to sea and is set to become an extratropical system in the coming days. TC Newton formed in the East Pacific on 9/21 and dissipated quickly without affecting land. TC Ashley formed in the southern Indian Ocean 9/26 but is not expected to have any impacts to land. In the Atlantic Basin, TC Hermine formed near the Cape Verde Islands on 9/23 and quickly dissipated. Later on 9/23, TC Ian formed in the Caribbean Sea, and is currently near Cuba as an intensifying hurricane. Ian is anticipated to come ashore along the eastern Gulf Coast in the coming days with the potential for heavy rain and high winds during the next few days. Please refer to the National Hurricane Center (NHC) for more information and the latest forecasts.
Looking ahead to week 2, heightened MJO activity and the La Niña base state when coupled with a westerly wind burst over the equatorial Indian Ocean depicted in multiple dynamical models provide favorable conditions for TC formation on either side of the equator for the Eastern Indian Ocean. Model guidance from the ECMWF and GEFS also indicate heightened probabilities of TC formation during the week-2 time period covering a broad area in Philippine Sea, the Eastern Pacific Basin and the Main Development Region (MDR) of the Atlantic Basin.
The precipitation outlook for the next two weeks is based on anticipated TC tracks, ongoing La Nina conditions, and consensus of GEFS, CFS, and ECMWF ensemble mean solutions. Suppressed (enhanced) rainfall continues near and to the west of the Date Line (over the Maritime Continent) due to ongoing La Nina conditions and anticipated MJO phase. Below-normal precipitation is anticipated for the western tropical Indian Ocean for both weeks 2 and 3.
For hazardous weather conditions in your area during the coming two-week period, please refer to your local NWS office, the Medium Range Hazards Forecast produced by the Weather Prediction Center, and the CPC Week-2 Hazards Outlook. Forecasts made over Africa are made in coordination with the International Desk at CPC.
Detailed Maps and Reports for the Western Atlantic and the Pacific Oceans
Below are three maps that summarize the situation for the Atlantic, Eastern and Central Pacific. Additional information can be accessed by clicking HERE
First the Atlantic
Click to view the forecast map and have access to additional information https://www.nhc .noaa.gov/gtwo.php?basin= atlc&fdays=5
Then Eastern Pacific
Click to view the forecast map and have access to additional information https://www.nhc.noaa.gov/gtwo.php?basin=epac&fdays=5
Then Central Pacific
Click to view the forecast map and have access to additional information https://www.nhc.noaa.gov/gtwo.php?basin=cpac&fdays=5
And the Western Pacific
Click to view the forecast map and have access to additional information https://www.metoc.navy.mil/jtwc/jtwc.html
Some Intermediate-Term Outlooks
Links to “Outlook” maps and discussions for three time periods. Days 6 – 10, Days 8 – 14, and Weeks 3 and 4. An outlook differs from a forecast based on how NOAA uses these terms in that an “outlook” presents information from deviation from normal and the likelihood of these deviations.
You have to click on the links because they do not update automatically and I do not want to have stale images in the article. But it is not difficult to click on a link and you get a large image plus a discussion. On Fridays in a separate article, we will show the images and provide a link in this article that article. But remember what you will see is the images as of Friday. But here you can get the current images simply by clicking on them. Then hit the return arrow at the upper left of your screen to return to the article. You will not find this information easily anywhere else.

Right now you can find these maps here (We show them every Friday there but you can click above and find them).
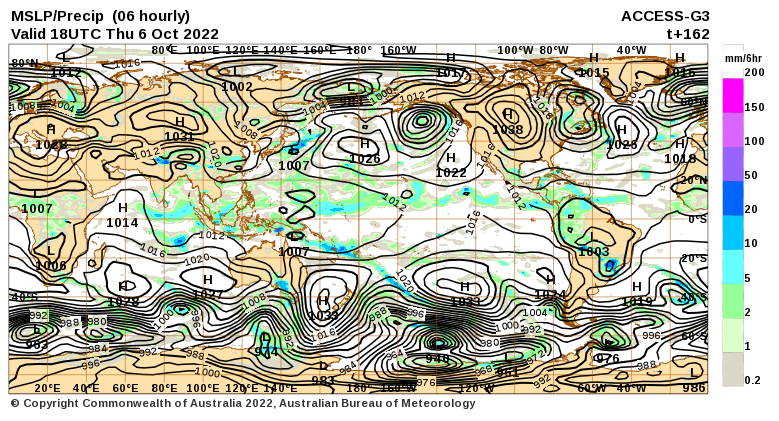
World Forecast for Day 6 (Currently Set for Day 6 but the reader can change that)
World Weather Forecast produced by the Australian Bureau of Meteorology. Unfortunately, I do not know how to extract the control panel and embed it into my report so that you could use the tool within my report. But if you visit it Click Here and you will be able to use the tool to view temperature or many other things for THE WORLD. It can forecast out for a week. Pretty cool. Return to this report by using the “Back Arrow” usually found top left corner of your screen to the left of the URL Box. It may require hitting it a few times depending on how deep you are into the BOM tool. Below are the current worldwide precipitation and air pressure forecasts for six days out. They will not auto-update and right now are current for Day 6. If you want the forecast for a different day Click Here I will try to update this map each day but you have the link so you can access the dashboard and get a wide variety of forecasts.I mostly rely on the reader to interpret world maps. For this map, areas of expected precipitation for the date and time shown are clearly shown. The number of High-Pressure systems shown is called the Wave Number. Maybe I will discuss WN someday. But it shows how many Rossby Waves there are around the World. Sometimes they are hard to count. Counting Low-Pressure systems should provide the same WN. Rossby Waves are the way the temperature distribution of the Planet remains in balance. It is basically the science of fluid dynamics. It can be very helpful in predicting the movement of weather patterns. You can snip an area of interest and move it into MS Paint and enlarge it.
Month to Date Information
Month to date Temperature can be found at https://hprcc.unl.edu/products/maps/acis/MonthTDeptUS.png
Month to date Precipitation can be found at https://hprcc.unl.edu/products/maps/acis/MonthPNormUS.png