Here is what we are paying attention to this evening and the next 48 hours from this afternoon’s NWS Forecast.
...Cool and unsettled weather expected across the Northeast and Great
Lakes over the next few days...

...Well above average temperatures forecast throughout the West, with
excessive heat impacting parts of southern California...

...Isolated flash flood concerns for portions of central and southern
Florida through Monday before hazardous conditions associated with
Tropical Storm Ian approach southern Florida on Tuesday...
Continuation of the NWS Short Range Forecast (It is updated twice a day and these updates can be found here.
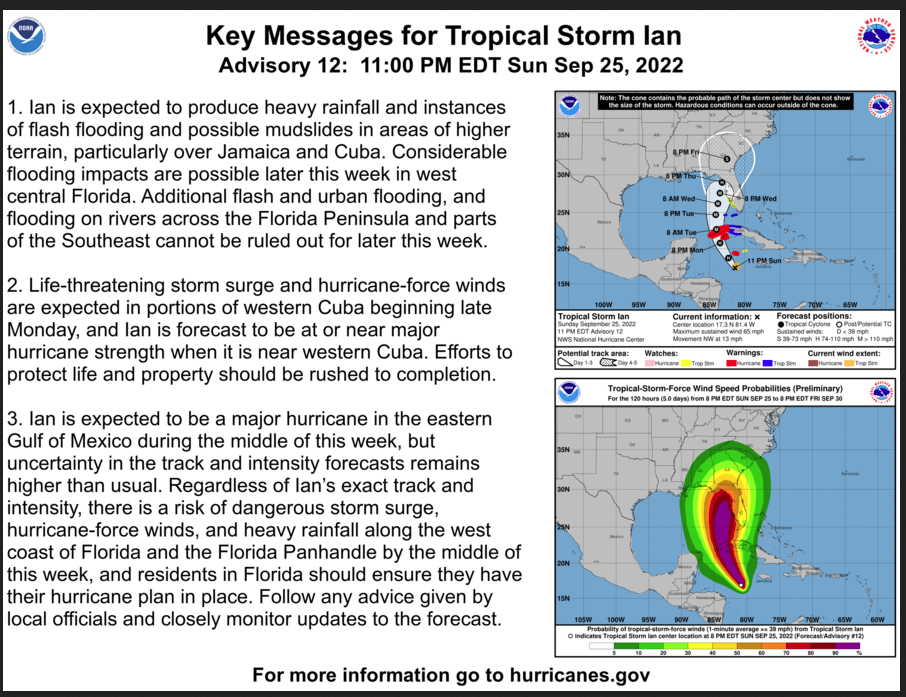
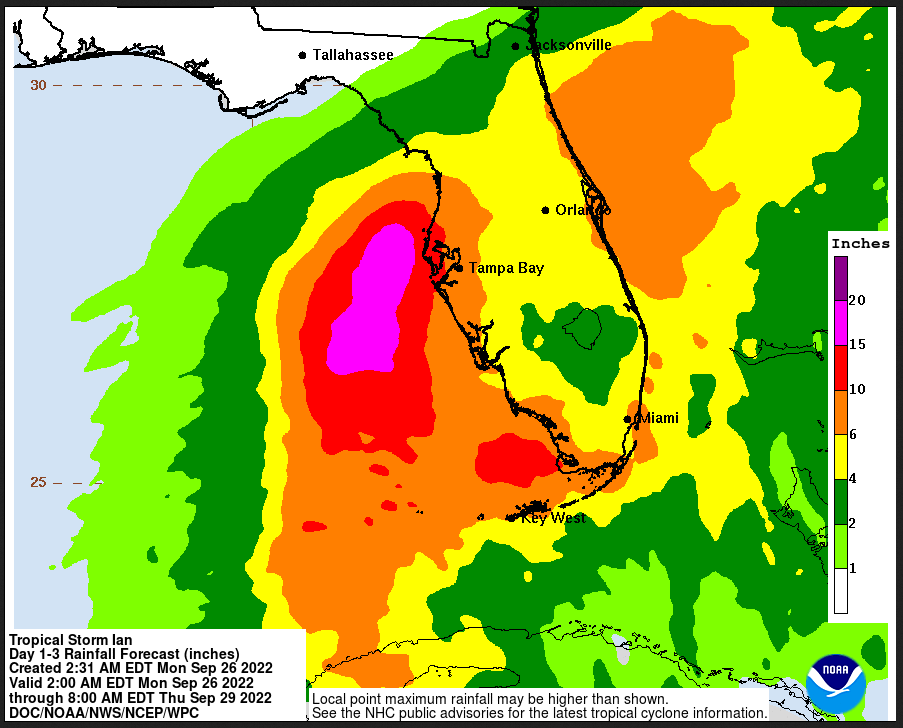
A potent upper-level low churning over the Upper Great Lakes and southern
Ontario, Canada will be slow to exit the region and continue to aid in
producing damp and dreary weather over the Great Lakes and parts of the
Northeast through early this week. Meanwhile, an advancing cold front
swinging across the Mid-Atlantic could lead to isolated severe
thunderstorms this evening, particularly from southern Connecticut to the
northern Delmarva Peninsula. A few storms could contain damaging wind
gusts, large hail, and isolated tornadoes. This has prompted the Storm
Prediction Center to issue a Slight Risk (level 2/5) of severe
thunderstorms for the region. For the Great Lakes, the combination of
strong westerly winds, cold air aloft, and warm lake temperatures could
lead to locally heavy lake-effect rain through Tuesday. These showers
could lead to isolated flash flooding downwind of Lake Erie and Lake
Ontario. Lastly, below average temperatures are likely underneath the
upper-level trough and overcast skies. Highs into the 60s and 50s are
forecast throughout much of the Midwest, Ohio Valley, and Northeast.

Summer-like and excessive heat are forecast to remain over much of the
West as a strong upper-level ridge passes over the western half of the
Nation. The hottest weather is expected over the Southwest and southern
California. Highs early this week are expected to top 100 degrees for the
interior deserts and typically hot valley locations. Excessive Heat
Warnings and Heat Advisories are in effect for parts of southern
California. Elsewhere, well above temperatures stretch from the
Intermountain West to the northern Rockies and northern High Plains. Highs
on Monday and Tuesday are forecast to soar into the upper 80s and low 90s.

The other area of potentially impactful weather through the first few days
of the new workweek will be located across Florida. Through Monday night,
a lingering frontal boundary may provide focus for developing
thunderstorms across the southern half of the Peninsula. These storms may
be slow-moving and contain intense rainfall rates. By Tuesday morning,
outer rainbands associated with Tropical Storm Ian may begin to approach
southern Florida and the Florida Keys. The greatest potential for
tropical-storm force wind gusts through Tuesday are expected to be across
the western Florida Keys and southwestern parts of the state. Heavy rain
and gusty winds are also forecast to slowly spread northward into central
Florida through early Wednesday as Ian pushes into the eastern Gulf of
Mexico. Flash and urban flooding is possible across the Florida Keys and
Florida Peninsula throughout midweek. In order to further highlight the
concern, a Slight Risk (level 2/4) of Excessive Rainfall has been issued
for the southern half of the Sunshine State on Tuesday.
Current forecast of track and other information
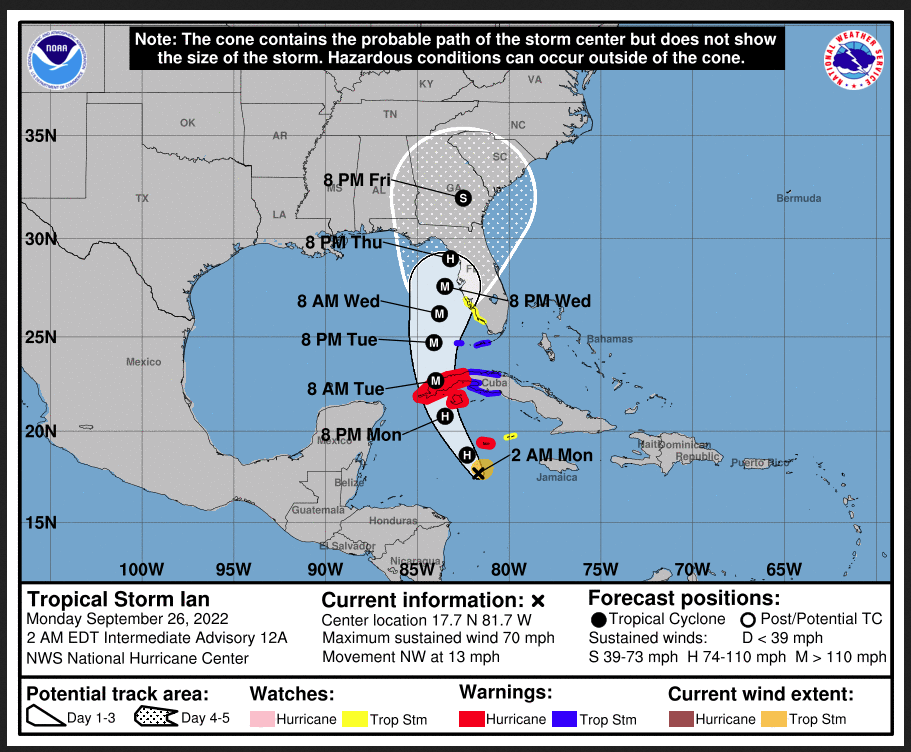
Maps that relate the forecast to geography can be found by clicking Here for Day 1 and Here for Day 2.
Here is a 60-hour animated forecast map that shows how the short-term forecast is expected to play out.
If it needs to be updated click here.
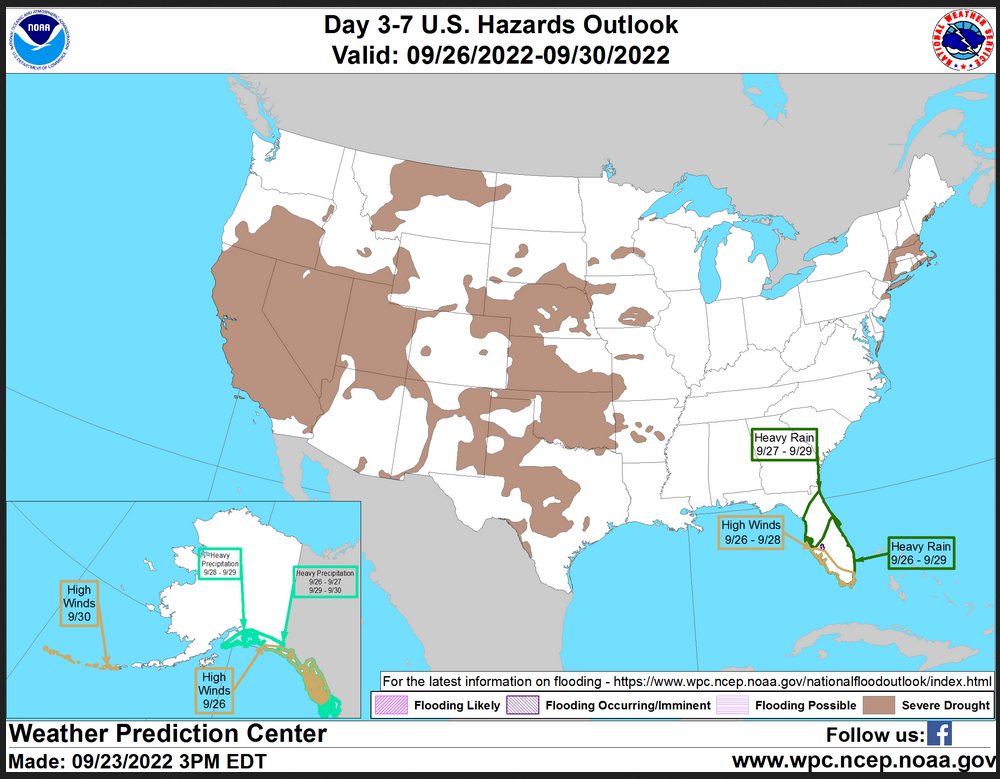
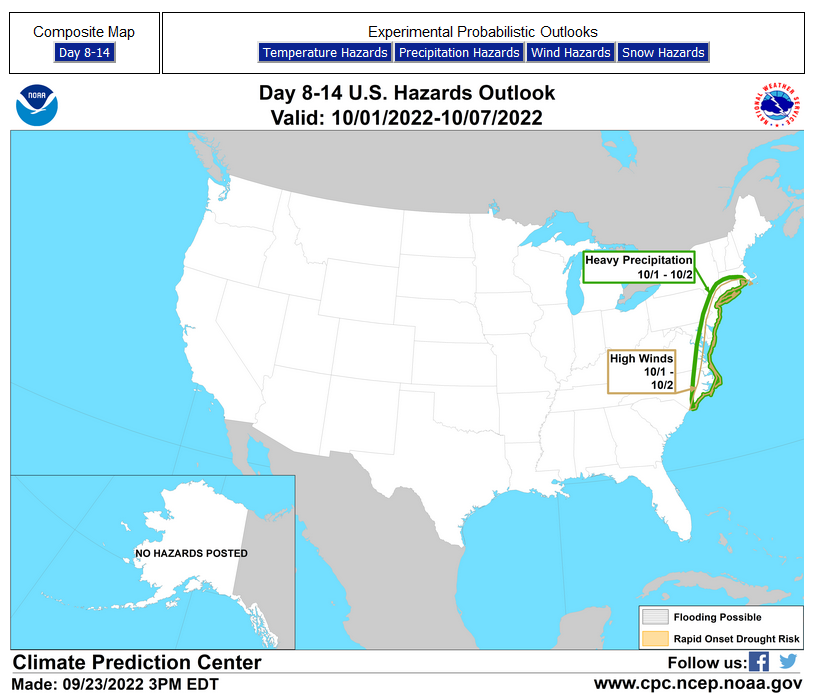
HAZARDS OUTLOOKS
Click here for the latest complete Day 3 -7 Hazards forecast which updates only on weekdays. Once a week probably Monday or Tuesday I will update the images. I provided the link for readers to get daily updates on weekdays. Use your own judgment to decide if you need to update these images.
Worldwide Tropical Forecast
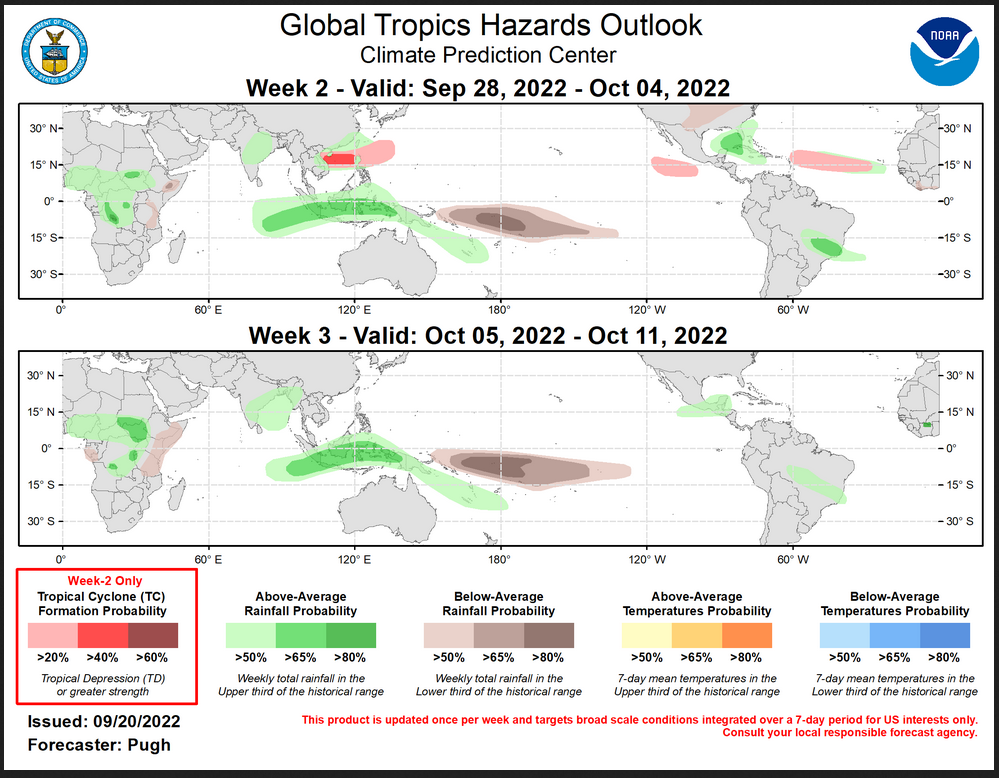
(This graphic updates on Tuesdays) If it has not been updated, you can get the update by clicking here This is a new approach and covers weeks 2 and 3 not weeks 1 and 2. It has more information but I am having trouble getting used to it. As usual, it comes with a discussion so I thought I would show that discussion tonight. I will not do that every night but if you click the link you will have that discussion.
Outlook Discussion Last Updated – 09/20/22
Valid – 09/28/22 – 10/11/22
The Madden-Julian Oscillation (MJO) weakened during early to mid-September which is likely due to destructive interference with the ongoing La Nina. The 200-hPa Velocity Potential field depicts very small anomalies throughout much of the global tropics with the largest anomalies, associated with upper-level divergence, centered over the Maritime Continent. Although enhanced low-level trade winds remain anchored across the equatorial central Pacific, anomalous 200-hPa easterly winds shifted east to 150E for the first time since early June. This may indicate that a remnant MJO signal is propagating eastward across the Pacific to the Americas during mid-September. Objective wavenumber-frequency filtering of the CFS and ECMWF models depicts this remnant MJO, albeit in a weakened state, shifting east over the Western Hemisphere during the next two weeks and then crossing Africa to the Indian Ocean by week-3. The ECMWF and GFS models depict anomalous low-level westerlies and reduced wind shear over the East Pacific, Caribbean Sea, and parts of the tropical Atlantic during the next two weeks. These model projections along with the background state of La Nina is expected to support a fairly active period in the Atlantic basin through at least the beginning of October. On September 14, Tropical Depression Seven developed over the tropical Atlantic and strengthened to a Category-1 Hurricane Fiona a few days later. Fiona tracked across Puerto Rico and then made a second landfall in the Dominican Republic. As of September 20, Fiona is forecast to strengthen to a Category-4 hurricane and track northward to near Bermuda later this week. Tropical Depression 8 formed on September 20 in the subtropical central Atlantic and is forecast to track northeastward. A couple of tropical cyclones, the 13th and 14th of the 2022 season, formed over the East Pacific during the past week. In the West Pacific, Typhoon Nanmadol recently made landfall in the Kyushu Islands of southern Japan.
The National Hurricane Center (NHC) is currently monitoring a tropical wave located several hundred miles east of the Windward Islands. Since this system is likely to become a tropical cyclone late in week-1, no tropical cyclone (TC) development area is posted for the Caribbean Sea during week-2. This disturbance should be monitored closely as it is expected to enter a favorable environment for strengthening heading into week-2 and could eventually impact areas of the Caribbean and southeastern United States. Multiple tropical waves are forecast to emerge from western Africa during the next two weeks and background state is expected to be conducive for one of these waves to develop across the Main Development Region of the Atlantic during week-2. Due to uncertainty on location at this time lead, a 20 percent chance over a broad spatial extent is posted. By week-3 (Oct 5-11), the main focus for TC development in the Atlantic basin climatologically shifts to the western Caribbean.
In the East Pacific, NHC is monitoring a couple of areas of low pressure for TC development during the next five days. Since any development is expected to be slow to occur and may not occur until early week-2, a 20 percent chance of genesis is designated for week-2. Dynamical models support a broad 20 percent chance of TC development across parts of the West Pacific during week-2, while a model consensus and continuity increases chances to 40 percent across the South China Sea.
The precipitation outlook during weeks 2 and 3 are largely based on La Nina precipitation composites and a historical skill-weighted blend of GEFS, ECMWF, CFS, and Canadian ensemble forecasts. Most likely TC tracks were also considered heading into the week-2 period. For hazardous weather concerns in your area during the next two weeks, please refer to your local NWS office, the Medium Range Hazards Forecast from the Weather Prediction Center (WPC), and the CPC Week-2 Hazards Outlook. Forecasts issued over Africa are made in coordination with the International Desk at CPC.
Detailed Maps and Reports for the Western Atlantic and the Pacific Oceans
Below are three maps that summarize the situation for the Atlantic, Eastern and Central Pacific. Additional information can be accessed by clicking HE RE
First the Atlantic
Click to view the forecast map and have access to additional information https://www.nhc .noaa.gov/gtwo.php?basin= atlc&fdays=5
Then Eastern Pacific
Click to view the forecast map and have access to additional information https://www.nhc.noaa.gov/gtwo.php?basin=epac&fdays=5
Then Central Pacific
Click to view the forecast map and have access to additional information https://www.nhc.noaa.gov/gtwo.php?basin=cpac&fdays=5
And the Western Pacific
Click to view the forecast map and have access to additional information https://www.metoc.navy.mil/jtwc/jtwc.html
Some Intermediate-Term Outlooks
Links to “Outlook” maps and discussions for three time periods. Days 6 – 10, Days 8 – 14, and Weeks 3 and 4. An outlook differs from a forecast based on how NOAA uses these terms in that an “outlook” presents information from deviation from normal and the likelihood of these deviations.
You have to click on the links because they do not update automatically and I do not want to have stale images in the article. But it is not difficult to click on a link and you get a large image plus a discussion. On Fridays in a separate article, we will show the images and provide a link in this article that article. But remember what you will see is the images as of Friday. But here you can get the current images simply by clicking on them. Then hit the return arrow at the upper left of your screen to return to the article. You will not find this information easily anywhere else.

Right now you can find these maps here (We show them every Friday there but you can click above and find them).
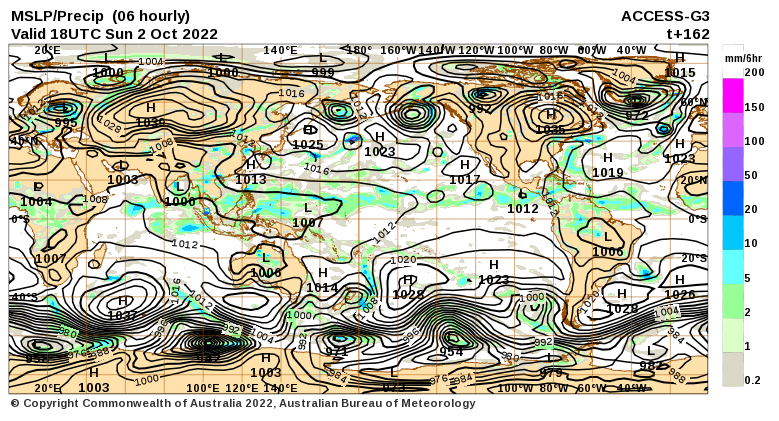
World Forecast for Day 6 (Currently Set for Day 6 but the reader can change that)
World Weather Forecast produced by the Australian Bureau of Meteorology. Unfortunately, I do not know how to extract the control panel and embed it into my report so that you could use the tool within my report. But if you visit it Click Here and you will be able to use the tool to view temperature or many other things for THE WORLD. It can forecast out for a week. Pretty cool. Return to this report by using the “Back Arrow” usually found top left corner of your screen to the left of the URL Box. It may require hitting it a few times depending on how deep you are into the BOM tool. Below are the current worldwide precipitation and air pressure forecasts for six days out. They will not auto-update and right now are current for Day 6. If you want the forecast for a different day Click Here I will try to update this map each day but you have the link so you can access the dashboard and get a wide variety of forecasts.I mostly rely on the reader to interpret world maps. For this map, areas of expected precipitation for the date and time shown are clearly shown. The number of High-Pressure systems shown is called the Wave Number. Maybe I will discuss WN someday. But it shows how many Rossby Waves there are around the World. Sometimes they are hard to count. Counting Low-Pressure systems should provide the same WN. Rossby Waves are the way the temperature distribution of the Planet remains in balance. It is basically the science of fluid dynamics. It can be very helpful in predicting the movement of weather patterns. You can snip an area of interest and move it into MS Paint and enlarge it.
 Month to Date Information
Month to date Temperature can be found at https://hprcc.unl.edu/products/maps/acis/MonthTDeptUS.png
Month to date Precipitation can be found at https://hprcc.unl.edu/products/maps/acis/MonthPNormUS.png