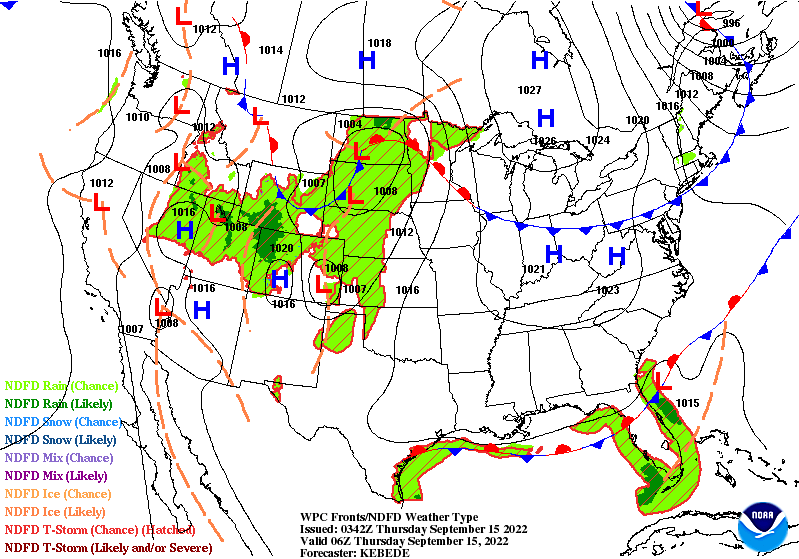
Here is what we are paying attention to this evening and the next 48 hours from this afternoon’s NWS Forecast.
...Heavy to excessive rainfall possible across parts of the central Great
Basin/Northern Rockies through Thursday and into the Upper Midwest/Great
Lakes on Thursday and Friday...

...Daily rounds of showers and storms likely across Florida...

...Above average temperatures span across the central United States and
Midwest to end the week...
Continuation of the NWS Short Range Forecast (It is updated twice a day and these updates can be found here.
Anomalous atmospheric moisture content continues to aid in widespread
areas of showers and thunderstorms throughout parts of the Great Basin and
Rockies this evening. Storms will be capable of containing intense
rainfall rates and potentially lead to flash flooding. A Slight Risk
(level 2/4) of Excessive Rainfall remains in effect for the central Great
Basin, including much of Utah and eastern Nevada through Thursday morning.
The heavy rainfall threat is expected to gradually diminish and lift
northward on Thursday into the northern Rockies. Areas near recent burn
scars and slot canyons are most at risk to rapid runoff and localized
flooding.

Heavy rain is also likely to impact parts of the Upper Midwest and Great
Lakes beginning on Thursday. A warm front lifting into central Minnesota
and the U.P. of Michigan will help focus continuous rounds of potentially
excessive rainfall. Widespread rainfall amounts over 1 inch are forecast
across northern Minnesota, far northern Wisconsin, and along the shore of
Lake Superior. Maximum rainfall amounts around 2 to 4 inches are possible
in the Arrowhead of Minnesota. As a result, a Slight Risk of Excessive
Rainfall has been issued for this region (valid Thursday morning to Friday
morning). Rain chances are expected to linger through Friday and into
Saturday, but shift farther south into the Upper Midwest and become more
scattered in nature.

Elsewhere, a frontal boundary draped across the central Florida Peninsula
will aid in producing daily thunderstorm chances over much of the Sunshine
State. The main weather hazard associated with these storms will likely be
in the form of heavy rainfall. Intense rainfall rates may lead to
localized and urban flash flooding, while also potentially reducing
visibility on roadways. For the central U.S., isolated thunderstorms
capable of containing localized damaging wind gusts are possible over the
southern High Plains today and extending into the central Plains on
Thursday.

Summer-like conditions are forecast to remain over much of the Nation's
Heartland, with above average temperatures extending from the central
Plains to the Great Lakes. Highs on Thursday and Friday are forecast to
reach into the 80s and low 90s, with lows dipping into the 60s. This is
thanks to a building upper-level ridge that is set to strengthen even
further this weekend, so don't put away those shorts and flip flops yet.
The West and Northeast will enjoy more fall-like weather over the next few
days. Highs are only expected to reach into the 60s and 70s throughout the
Northeast on Thursday before the cool airmass begins to quickly retreat by
the end of the week. Below average high temperatures are also forecast
throughout the West, which equates to comfortable highs mostly reaching
into the 70s and 80s.
Maps that relate the forecast to geography can be found by clicking Here for Day 1 and Here for Day 2.
Here is a 60-hour animated forecast map that shows how the short-term forecast is expected to play out.
If it needs to be updated click here.
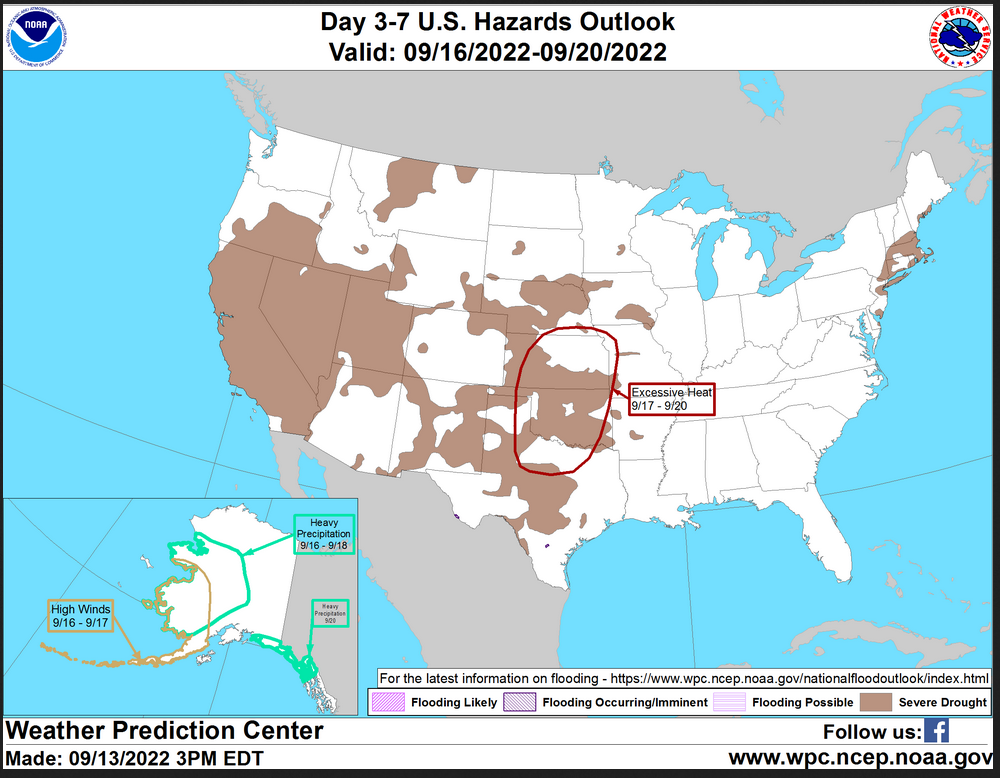
HAZARDS OUTLOOKS
Click here for the latest complete Day 3 -7 Hazards forecast which updates only on weekdays. Once a week probably Monday or Tuesday I will update the images. I provided the link for readers to get daily updates on weekdays. Use your own judgment to decide if you need to update these images.
Worldwide Tropical Forecast
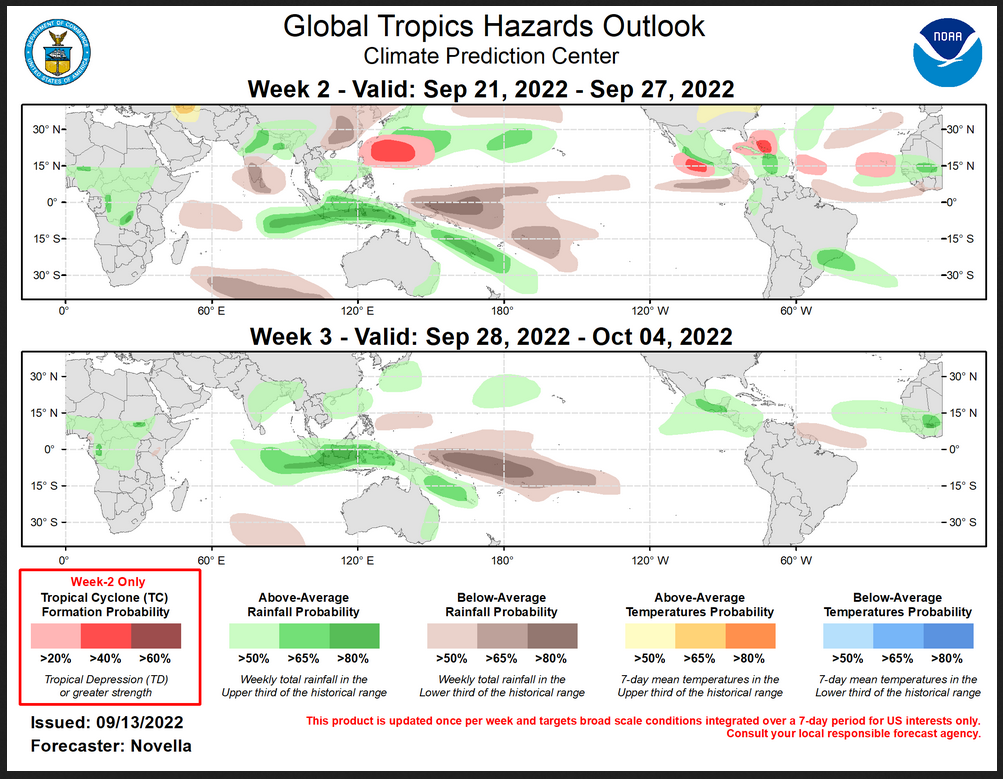
(This graphic updates on Tuesdays) If it has not been updated, you can get the update by clicking here This is a new approach and covers weeks 2 and 3 not weeks 1 and 2. It has more information but I am having trouble getting used to it. As usual, it comes with a discussion so I thought I would show that discussion tonight. I will not do that every night but if you click the link you will have that discussion.
Outlook Discussion Last Updated – 09/13/22
Valid – 09/21/22 – 10/04/22
Both the RMM index and upper-level velocity potential anomaly based MJO index indicate a weakened and incoherent MJO during the past week. This weakening is likely attributed to destructive interference with the low frequency footprint over the equatorial Pacific, and there is some support for continued eastward propagation of the intraseasonal signal and possible reemergence in the guidance and tools. Dynamical model RMM forecasts seem to only paint part of the MJO picture moving forward, generally favoring some eastward propagation of the signal, but maintain a low amplitude with only few mean solutions exiting the RMM unit circle during the next few weeks. However, there are questions as to how well the RMM index is able to represent the MJO against the backdrop of such an unusually strong La Nina during the past few months. Hovmoller analyses of upper-level velocity potential and OLR anomaly forecasts focused north of the equator provide a bit more clarity in this regard, which depict the development of enhanced divergence aloft and convection with MJO activity coming through objective wavenumber-frequency filtering over the eastern Pacific and Americas during week-1, that continues to shift eastward into the tropical Atlantic and Africa with a more coherent wave-1 pattern emerging late in September. Should the MJO become better reorganized as it reenters the eastern Hemisphere, large scale conditions would be favorable for tropical cyclone (TC) development over the eastern Pacific and the Atlantic through the end of the month. Additional TC formation is also forecast to continue in the western Pacific tied to Rossby wave activity favored during the outlook period. During the past week, three TCs developed in the western Pacific basin. Typhoon Muifa formed near 17N/135E on 9/7 and briefly reached Super Typhoon Intensity this past weekend, before weakening to category 2 over the East China Sea. The Joint Typhoon Warning Center (JTWC) forecasts Muifa to track northwestward and make landfall as a category 1 system over the Zhejiang Province of eastern China where locally heavy rainfall amounts and high winds are favored during the next day or so. Towards the east, TC Merbok formed on 9/11 near 21N/160E and has remained at Tropical Storm intensity while drifting northward over the past few days. Although this system will remain over open waters, the JTWC forecasts Merbok to strengthen to category 2 system under a favorable SST and shear environment and accelerate poleward with an approaching mid-level trough to the west. As Merbok undergoes extratropical transition this week, dynamical models depict an amplification of the mid-level height pattern downstream over northern Pacific and western North America by next weekend, leading to increased chances for below (above) normal temperatures (precipitation) for many parts of Alaska and the western CONUS by next week. In the northern Philippine Sea, Tropical Depression 16W formed on 9/12 near 21N/138E. As this system is expected to meander under competing mid-level steering mechanisms in the near-term, a more northeasterly track towards the islands of southern Japan while strengthening to Typhoon intensity is forecast later this week.
Across the Atlantic, the National Hurricane Center (NHC) is monitoring a pair of tropical waves in the Main Development Region (MDR) where the leading wave has a 40% chance of formation during the next 5 days. Probabilistic TC genesis tools reflect moderate chances of development during the week-1 period, however these signals also persist into the start of week-2 period. Although the GFS and GEFS are less robust with TC potential, there has been good continuity in the ECMWF ensemble favoring several deepening low centers once the disturbance approaches Hispaniola at the end of week-1, but diverge thereafter. Therefore, a broad slight chance (20%) area for TC formation is issued for week-2 to account for this spread in the guidance, with an embedded moderate chance (40%) area posted mainly east of the Bahamas should this disturbance not form during week-1. Another slight chance area is posted to the east of the Lesser Antilles, where there is also support in the probabilistic tools indicating modest chances for development tied to another easterly wave in the MDR. Across the eastern MDR, another easterly wave is forecast to move off of West Africa later in week-2. There are strengthening signals in the latest probabilistic guidance for TC formation near Cape Verde to support slight chances of TC development in the outlook.
In the eastern Pacific, the NHC is also monitoring a trough of low pressure with a high chance (80%) of formation during the next 5 days. Beyond this development potential during week-1, there is support from the model guidance and probabilistic tools for additional TC formation in the basin. Notably, lower-level zonal wind forecasts from the ECMWF, CFS, and GEFS favor a band of strengthening anomalous westerlies to the south of Mexico and into the Caribbean suggestive of an enhanced Central America Gyre (CAG) circulation conducive for TC development. Therefore, a broad slight chance and embedded moderate chance (40%) area are posted to the south of Mexico for week-2. For the western Pacific, there is good agreement in the GEFS and ECMWF ensembles favoring a broad area of deepening low pressure to the south of Japan in the wake of TCs Muifa and Tropical Depression 16W during week-2. With 40% chances depicted in the probabilistic tools, a corresponding moderate chance area for TC development is posted with a broader slight chance area in the outlook.
Probabilities for above- and below- normal precipitation and temperatures in the outlook are based on historical skill-weighted blend of GEFS, ECMWF, CFS and Canadian ensemble forecasts, La Nina precipitation composites, anticipated TC tracks, and some consideration from MJO composites. For hazardous weather concerns in your area during the next two weeks, please refer to your local NWS office, the Medium Range Hazards Forecast from the Weather Prediction Center (WPC) and the CPC Week-2 Hazards Outlook. Forecasts issued over Africa are made in coordination with the International Desk at CPC.
Product Release Information
The Global Tropics Hazards Outlook (GTH) is released once per week every Tuesday at 1730 UTC (1830 UTC when on standard time) including U.S. federal holidays. At the time of product release, there is a live briefing (available via webinar) open to all interested parties in which the latest conditions in the Tropics and the just released outlook and associated impacts are discussed. There is an opportunity to ask questions after the briefing and the briefings are available at the Live Briefing Archive.Product Description
The Global Tropics Hazards Outlook is a probabilistic forecast for areas with elevated probabilities for above- or below-median rainfall, above- or below-normal temperatures and regions where tropical cyclogenesis is favored for the upcoming Week-2 and Week-3 time periods. The rainfall outlook is for precipitation integrated over a week and targets broad-scale patterns, not local conditions as they will be highly variable. Above (below) median rainfall forecast areas are depicted in green and brown respectively. Above (below) normal temperature forecast areas are depicted in orange and blue respectively. Favored areas for tropical development are shown in red. Three probability intervals are indicated for precipitation and temperature which are set at 50, 65, and 80%, while the probability intervals for tropical cyclone development are set at 20, 40, and 60%. The weekly verification period ranges from 00 UTC Wednesday to 00 UTC the following Wednesday.Along with the product graphic, a written text outlook discussion is also included at release time. The narrative provides a review of the past week across the global Tropics, a description of the current climate-weather situation, the factors and reasoning behind the depicted outlook and notes on any other issues the user should be aware of. The discussion discusses the impacts in the Tropics as well as potential impacts in the Extratropics when relevant.Product Physical Basis
The product synthesizes information and expert analysis related to climate variability across multiple time scales and from various sources, including operational climate monitoring products. The physical basis for the outlooks include El Nino-Southern Oscillation (ENSO) , the Madden-Julian Oscillation (MJO), strength and variations of the monsoon systems, other coherent subseasonal tropical variability such as atmospheric Kelvin waves (KW), Equatorial Rossby waves (ERW), African easterly waves, as well as interactions with the extratropical circulation (i.e. high latitude blocking, low-latitude frontal activity, etc.).Product Forecast Tools
The outlook maps are currently based on a number of forecast tools, many of which are objective and serve as an objective first guess. The final depiction is an assessment of these objective forecast tools augmented by the forecaster when based on additional forecast information when appropriate to create the final product. Forecast tools include MJO composites, empirical and dynamical based MJO, ERW and KW forecasts, and bias-corrected dynamical model guidance from a number of modeling systems. Tropical cyclone areas are based on MJO composites and statistical and dynamical tropical cyclone forecast guidance products as well as raw model forecast guidance.Product Purpose
The product supports the NOAA mission in three primary ways:
- Assess and forecast important changes in the distribution of tropical convection (i.e., potential circulation changes across the Pacific and North America sectors) and communicate this information to NWS forecasters
- Provide advance notice of potential hazards related to climate, weather and hydrological events across the global tropics (including tropical cyclone risks for several NWS regions)
- Support various sectors of the U.S. economy (finance, energy, agriculture, water resource management) that have foreign interests.
Product Partners
The product is created through collaboration with other NOAA centers, [the National Hurricane Center (NHC) and the Central Pacific Hurricane Center (CPHC)], the Department of Defense [The Joint Typhoon Warning Center (JTWC) and the Naval Postgraduate School (NPS)], the Australian Bureau of Meteorology, Taiwan Central Weather Bureau, the State University of New York at Albany (SUNY) and the Center for Climate and Satellites (CICS), among other collaborators.Product Users and Applications
Known users include U.S. government agencies such as NOAA [National Weather Service (NWS), River Forecast Centers (RFCs), the National Marine Fisheries Service (NMFS), the Department of the Interior (U.S. Forest Service), aid organizations (U.S. and international Red Cross, USAID), domestic and global private sector interests (financial, energy, water resource management and agricultural sectors), international weather services and various media meteorologists.Some special applications of the product in the past include extended range predictions to support Haiti earthquake and Deepwater Horizon oil spill relief efforts as well as support for the Dynamics of the MJO (DYNAMO) scientific field campaign held from October 2011 through March 2012.Product Resources
- ENSO weekly update:
http://www.cpc.ncep.noaa.gov/products/analysis_monitoring/lanina/enso_evolution-status-fcsts-web.pdf- MJO weekly update:
http://www.cpc.ncep.noaa.gov/products/precip/CWlink/MJO/mjoupdate.pdf- Earth System Research Laboratory
http://www.cdc.noaa.gov- National Hurricane Center:
http://www.nhc.noaa.gov/- Central Pacific Hurricane Center:
http://www.prh.noaa.gov/hnl/cphc/- Joint Typhoon Warning Center:
http://www.usno.navy.mil/JTWC- CPC African Desk:
http://www.cpc.ncep.noaa.gov/products/african_desk/- USAID/FEWS:
http://www.cpc.ncep.noaa.gov/products/fews/- Australian Government Bureau of Meteorology:
http://www.bom.gov.au/climate/
http://www.bom.gov.au/weather/nt/
Detailed Maps and Reports for the Western Atlantic and the Pacific Oceans
Below are three maps that summarize the situation for the Atlantic, Eastern and Central Pacific. Additional information can be accessed by clicking HERE
First the Atlantic
Click to view the forecast map and have access to additional information https://www.nhc .noaa.gov/gtwo.php?basin=atlc&fdays=5
Then Eastern Pacific
Click to view the forecast map and have access to additional information https://www.nhc.noaa.gov/gtwo.php?basin=epac&fdays=5
Then Central Pacific
Click to view the forecast map and have access to additional information https://www.nhc.noaa.gov/gtwo.php?basin=cpac&fdays=5
And the Western Pacific
Click to view the forecast map and have access to additional information https://www.metoc.navy.mil/jtwc/jtwc.html
Some Intermediate-Term Outlooks
Links to “Outlook” maps and discussions for three time periods. Days 6 – 10, Days 8 – 14, and Weeks 3 and 4. An outlook differs from a forecast based on how NOAA uses these terms in that an “outlook” presents information from deviation from normal and the likelihood of these deviations.
You have to click on the links because they do not update automatically and I do not want to have stale images in the article. But it is not difficult to click on a link and you get a large image plus a discussion. On Fridays in a separate article, we will show the images and provide a link in this article that article. But remember what you will see is the images as of Friday. But here you can get the current images simply by clicking on them. Then hit the return arrow at the upper left of your screen to return to the article. You will not find this information easily anywhere else.

Right now you can find these maps here (We show them every Friday there but you can click above and find them).
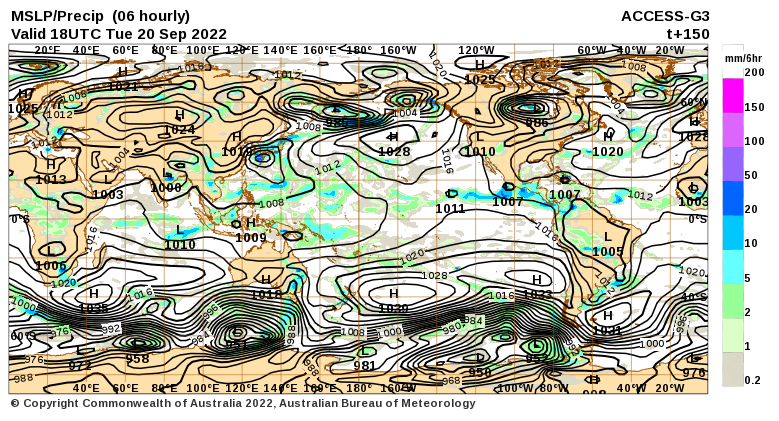
World Forecast for Day 6 (Currently Set for Day 6 but the reader can change that)
World Weather Forecast produced by the Australian Bureau of Meteorology. Unfortunately, I do not know how to extract the control panel and embed it into my report so that you could use the tool within my report. But if you visit it Click Here and you will be able to use the tool to view temperature or many other things for THE WORLD. It can forecast out for a week. Pretty cool. Return to this report by using the “Back Arrow” usually found top left corner of your screen to the left of the URL Box. It may require hitting it a few times depending on how deep you are into the BOM tool. Below are the current worldwide precipitation and air pressure forecasts for six days out. They will not auto-update and right now are current for Day 6. If you want the forecast for a different day Click Here I will try to update this map each day but you have the link so you can access the dashboard and get a wide variety of forecasts.I mostly rely on the reader to interpret world maps. For this map, areas of expected precipitation for the date and time shown are clearly shown. The number of High-Pressure systems shown is called the Wave Number. Maybe I will discuss WN someday. But it shows how many Rossby Waves there are around the World. Sometimes they are hard to count. Counting Low-Pressure systems should provide the same WN. Rossby Waves are the way the temperature distribution of the Planet remains in balance. It is basically the science of fluid dynamics. It can be very helpful in predicting the movement of weather patterns. You can snip an area of interest and move it into MS Paint and enlarge it.
Month to Date Information
Month to date Temperature can be found at https://hprcc.unl.edu/products/maps/acis/MonthTDeptUS.png
Month to date Precipitation can be found at https://hprcc.unl.edu/products/maps/acis/MonthPNormUS.png