I should have reported this a couple of weeks ago after NOAA issued their Seasonal Outlook. JAMSTEC is a well respected Japanese Research Agency for Marine-Earth Science and Technology. They have a proprietary forecast model and every month they normally issue a three-season forecast. This month they only looked out two seasons. I think it is useful to look at more than one forecast as it provides to some extent an assessment of the variability one might expect in the observed weather compared to the forecasts. This is usually due to slight differences in the strength and timing of the ENSO Cycle. As discussed in this article, both NOAA and JAMSTEC may be working with assumptions about the ENSO cycle that may turn out to be incorrect. So this may limit our ability to forecast even as far out as this summer.

Introduction
JAMSTEC provided me with their FMA, MAM and JJA forecasts. I was surprised that they provided a FMA forecast since they prefer to work with the four meteorological seasons. I decided to present the MAM and JJA forecasts as they represent meteorological Northern Hemisphere Spring and Summer.
For each of these two seasons I am providing the JAMSTEC forecasts and the corresponding NOAA forecast and providing some comments on how they compare with respect to CONUS and Alaska. I am also providing some comments on what seems to be important with respect to the JAMSTEC World forecast.
For many reasons, it is not sufficient to work only with a forecast of U.S. weather as many things depend on how U.S. weather compares to World weather. I believe that is under-reported so that is one of the reasons I write this article each month.
MAM also called Spring in the Northern Hemisphere
CONUS and Alaska Forecasts
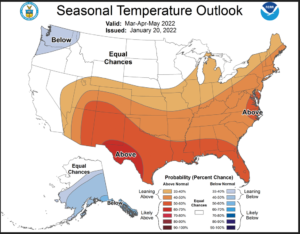
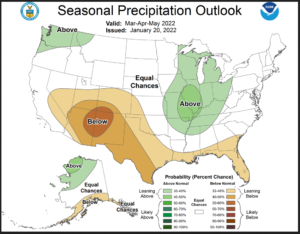
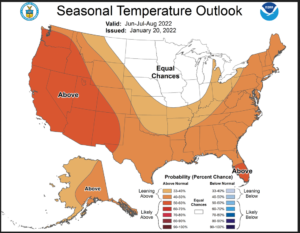
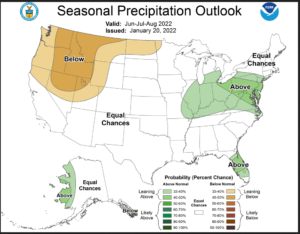
It is a little tricky but you can compare the NOAA maps for CONUS with what is shown for CONUS within the JAMSTEC World Map for the same time period. As you can see, the JAMSTEC forecast for CONUS and Alaska that is part of the JAMSTEC World forecast is very similar to the NOAA forecast. The precipitation forecast for CONUS and Alaska is also very similar but a little different for Alaska where NOAA shows southern Alaska and the Aleutians to be warmer than climatology and JAMSTEC shows that warmer area to be mostly offshore south of the Alaska mainland. So that is a very slight difference.
Worldwide Forecast
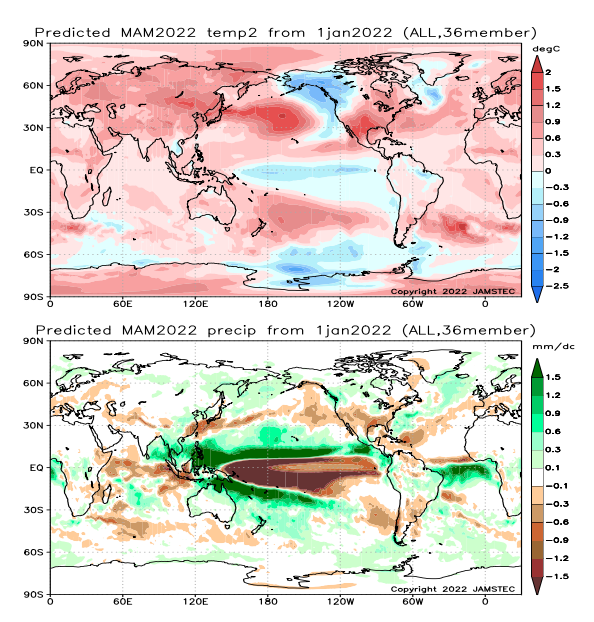
For JAMSTEC it is warm all over except for the Northwest part of the North American continent. If you look closely you can see two dry belts around the world with a wet area in between. I will present another graphic that shows the impact of ENSO on the oceans but the JAMSTEC forecasts already show that information.
JJA 2022 also called Summer in the Northern Hemisphere.
CONUS and Alaska Forecasts
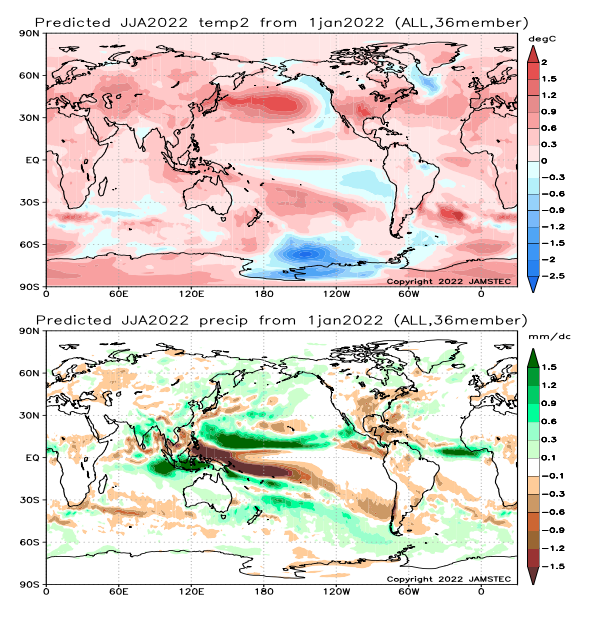
NOAA shows a North Central area of CONUS that JAMSTEC does not show and they sort of agree on temperature. But they disagree totally on precipitation with JAMSTEC being much drier than NOAA especially from the Great Plains of CONUS east. This is obviously very important with respect to agriculture.
North American Monsoon
We have to be careful since NOAA is usually reluctant to make predictions about the Monsoon this early in the year. NOAA is showing equal chances (EC) of being wetter than normal. JAMSTEC has no such reservations about forecasting that far out and they are showing a poor Monsoon except possibly in the western part of the Monsoon area.
Worldwide Forecast
In the JAMSTEC forecast it is warm pretty much everywhere but the Northwestern and North Central part of the North American Continent. Most of South America, India and southern Australia are only slightly warmer than normal. With respect to precipitation, India looks wet (good monsoon but potential for flooding). The wet area in western Africa is suggestive of a robust Hurricane Season. One can see some possible drought areas but a deterministic forecast that far out may not be sufficiently reliable to rely on.
Taking a look at the JAMSTEC Sea Surface Temperature Anomalies.
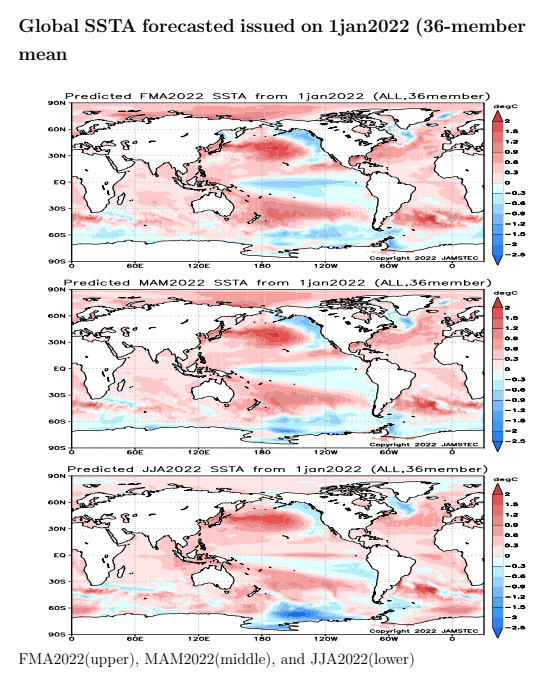
You can actually see this same information in the world forecast maps as JAMSTEC unlike NOAA does not blank out areas that are not part of their forecast. Of perhaps most interest is the area along the Pacific Equator where the blue represents the La Nina and you can see it being a bit westerly displaced and dissipating over time. Generally speaking the JAMSTEC forecast is more reliable at the Equator than the poles and the new versions of the forecasting model were intended to improve this. So I do not know what to make of the cold area off of Antarctica other than ice melt and a similar area south of Greenland which has been a regular feature of forecasts for some time but the cold water off of Northern North America is very significant as is the warm water off of Baja California which is the California Nino referred to in the JAMSTEC discussion. The North Pacific Pattern is the opposite of PDO+ so that is not good. We would prefer to see the coast warm and the cool water inside of a horse shoe shaped area of warm water. That would signify a change in the Phase of the PDO (Pacific Decadal Oscillation) and would be good news for where I live in New Mexico. I do not see much here that looks good but I am not a meteorologist just a lowly mathematician and economist.
Important Indices
I provided the indices relative to ENSO issued by NOAA on January 13 in this article. https://econcurrents.com/2022/01/14/noaa-extends-la-nina-forecast/
I will provide some of the relevant JAMSTEC Indices now. I am not going to compare the two but a reader can do that since I have provided the link where the NOAA indices are shown.
However I am going to start with the NOAA proprietary model which may not be their preferred tool. I have inserted the model in this article in a way that it will update. It is the only graphic in the article that will auto-update.

The above is similar to what was issued by NOAA on January 13 and it does not show La Nina going away.
But both the NOAA forecast and the JAMSTEC forecast assume that La Nina will end soon. So that raises questions about both forecasts.
Corresponding JAMSTEC model as run on January 1, 2022
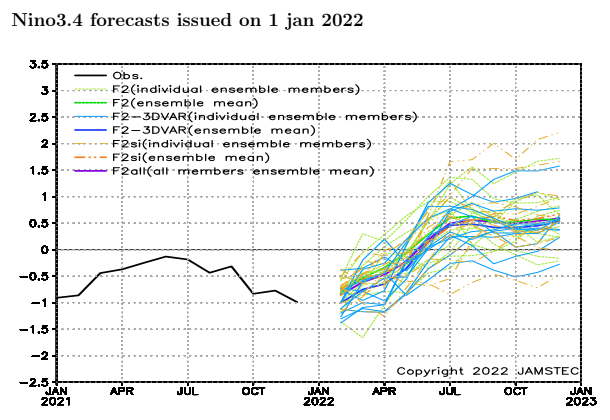
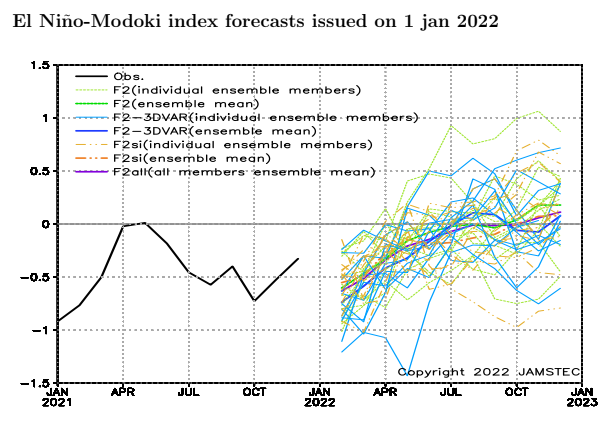
The standard JAMSTEC model is interesting because it almost seems to be forecasting a transition to El Nino (Nino 3.4 temperature anomaly reaching and exceeding +0.5C). Perhaps that is why they did not forecast the third season. The Modoki model is confusing to me as I do not see it really showing the La Nina becoming more of a Modoki type before it fades away but it also does not suggest the formation of an El Nino. These are busy graphics as they show a lot of information from different runs of the SINTEX model. F2 means it is the never version not F1. The 3DVAR is the new feature where the temperature of the various depths of the oceans are incorporated into the model. I do not remember what the “si” stands for. I think it has to do with fluid dynamics and stands for semi-implicit and I do not know exactly what it means but it is not important for this discussion. I believe it has to do with how they are able to take longer time steps and reduce computer time for those runs or at least that is what I think it is. What we are interested in is the mean of the various runs and the tighter the distribution the more confidence we would have with the result. The standard Nino 3.4 forecast looks good based on those criteria. The Modoki forecast is not as tight but you still can see what the overall pattern is.
In the earlier F1 version of the model, they did not show us all the different runs and in fact they did not have them. So the model is much more complicated now and IMO has not been in use long enough to really know if it is an improvement. But I think it is good for readers to know that what they generally see on TV or general circulation Media is a prettied up version of something that is very complicated. It is part of what some call the mushroom theory of communication but since this is a family-friendly article, I will not pursue that line of thought any farther.
Conclusion
NOAA and JAMSTEC pretty much agree on Spring but disagree on Summer with respect to precipitation. But both may be using a forecast for ENSO that is outdated. If India experiences flooding during their Monsoon, JAMSTEC will have predicted it.