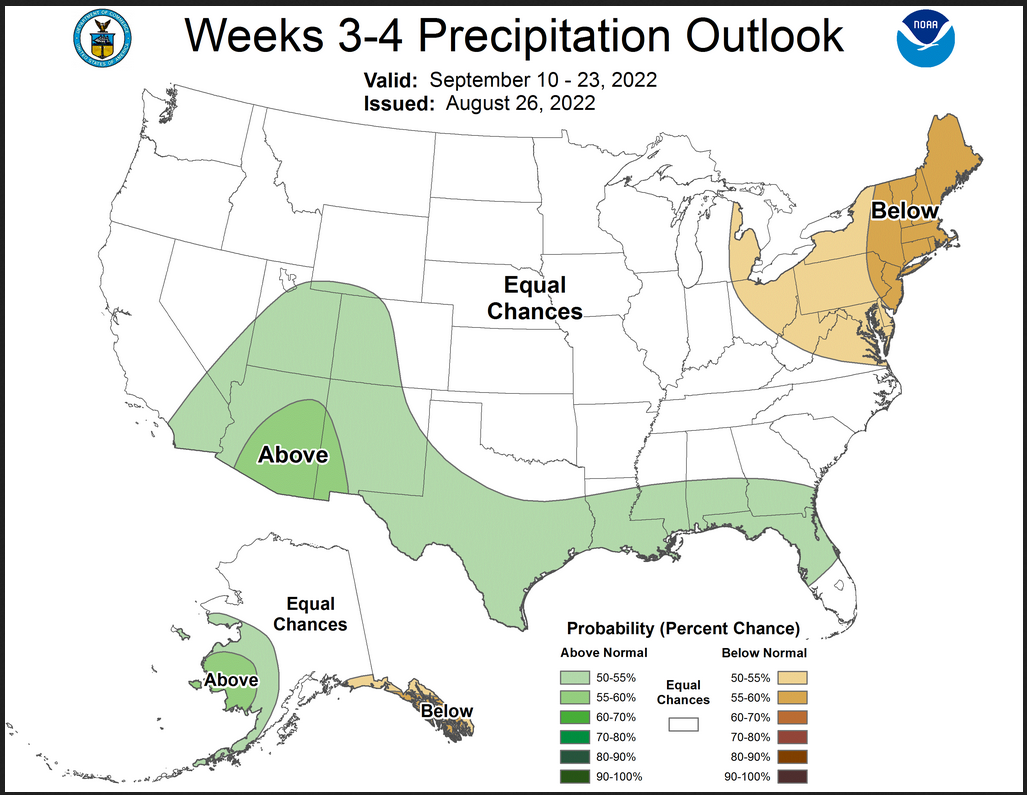
Southern Tier to be very wet and the Northwest warm. But there is a high level of uncertainty relative to the week 3 – 4 Outlook.
NOAA updates many of their weather outlooks and in many cases issues a discussion with those outlooks. On Fridays, they issue a week 3 – 4 outlook which is farther out than the typical 10-day forecast and the discussion is excellent. So we have decided to issue a weekly special report on Fridays which for most people will be read on Saturday as it gets published late Friday night.
When the Week 3-4 Outlook is issued, we have a 28-day view of the future. It is important to recognize that the forecasts do not always work out as predicted. But in the article, there are links to obtain updated forecasts.

| Announcement: We now publish a daily weather report that addresses both short-term and intermediate-term weather issues including tropical events and you can find it at econcurrents.com. To return to this article just hit the return arrow at the upper left corner on your screen. This message is mainly for future reference as this article covers most of what you need to know other than tropical events. I do not include those in this article as generally, it is not possible to predict them out to 28 days. The links to information on tropical events are in the Daily Report. There is more detail on near-term weather in the daily weather report than there is in this report which is looking ahead 28 days. |
What NOAA is predicting for the next 28 days.

We will start with the short-term – It is up to date as of today. If you look at this article after today you can click the links to update (plus you will end up with a lot of additional information)
| Temperature (Maximum Anomaly) for the next five days | Precipitation (Five days of cumulative precipitation) |
| https://www.wpc.ncep.noaa.gov/med r/me dr_mean.shtml | https://www.wpc.ncep.noaa.gov/qpf/day1-7.shtml |
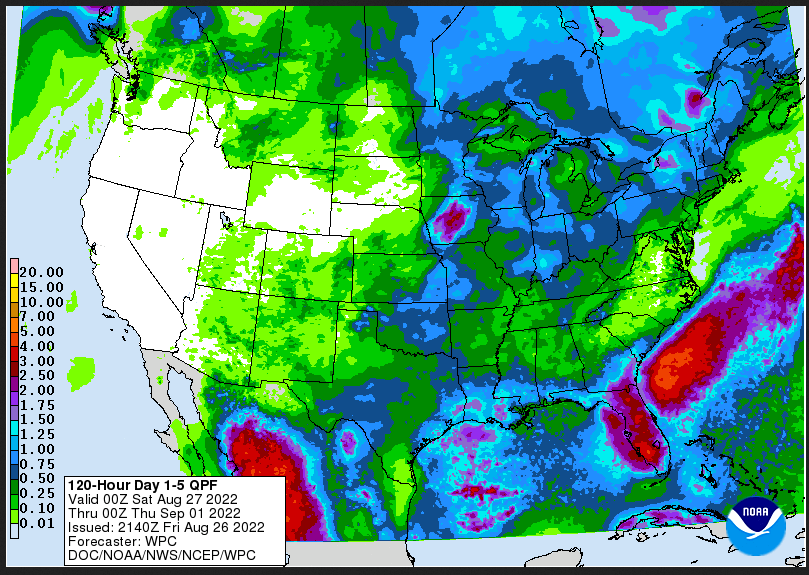
| Most of the warm temperature anomalies are in the Northwest. The precipitation is mostly in the Eastern half of CONUS with more in the south than in the north. |
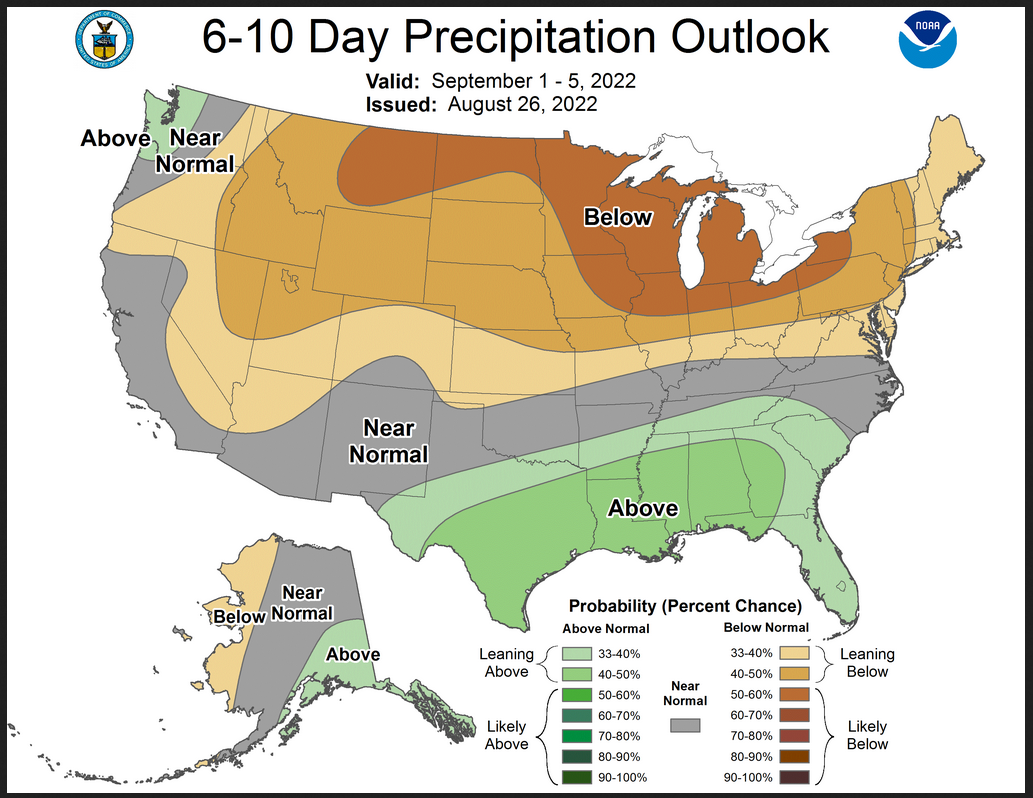
Now we look at “Outlook” maps for three time periods. Days 6 – 10, Days 8 – 14, and Weeks 3 and 4. An outlook differs from a forecast based on how NOAA uses these terms in that an “outlook” presents information as deviation from normal and the likelihood of these deviations.
I have provided the maps so you do not need to click to get them. But they do not update daily. But you can get the current images simply by clicking on the links provided. Then hit the return arrow at the upper left of your screen to return to the article. There is no need to do that right away since what is published today is up to date. The Week 3 – 4 Outlook only updates on Fridays.
Below are the links to obtain updates and additional information.
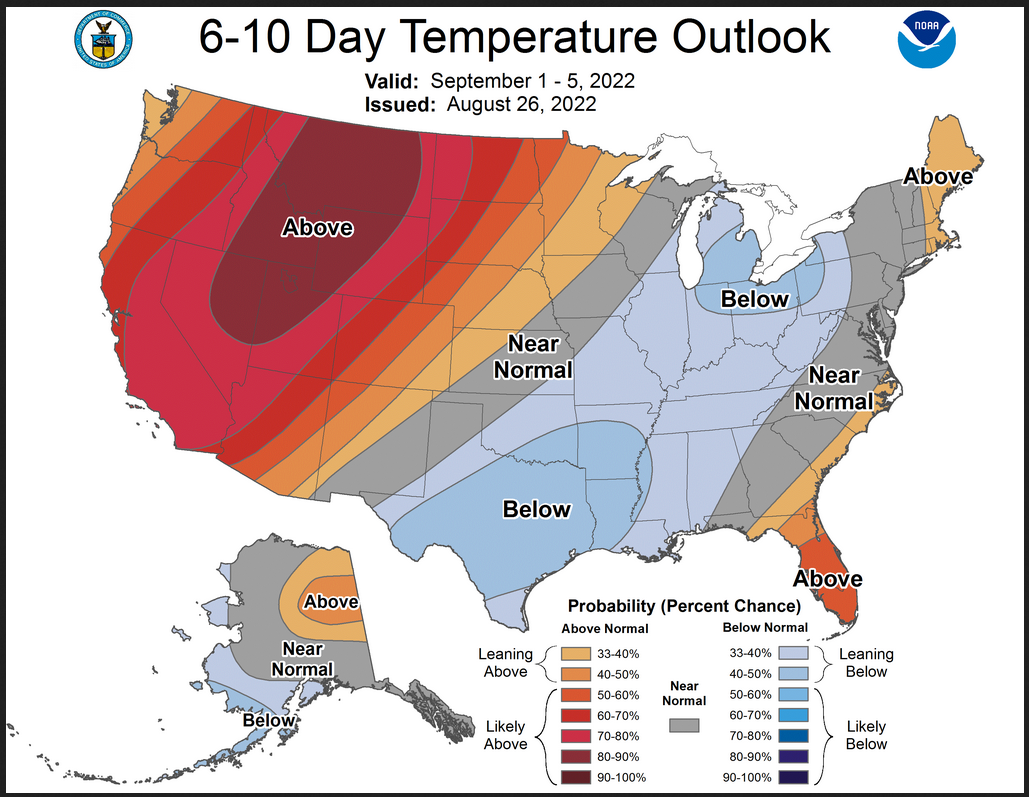
| The Northwest is very warm. |
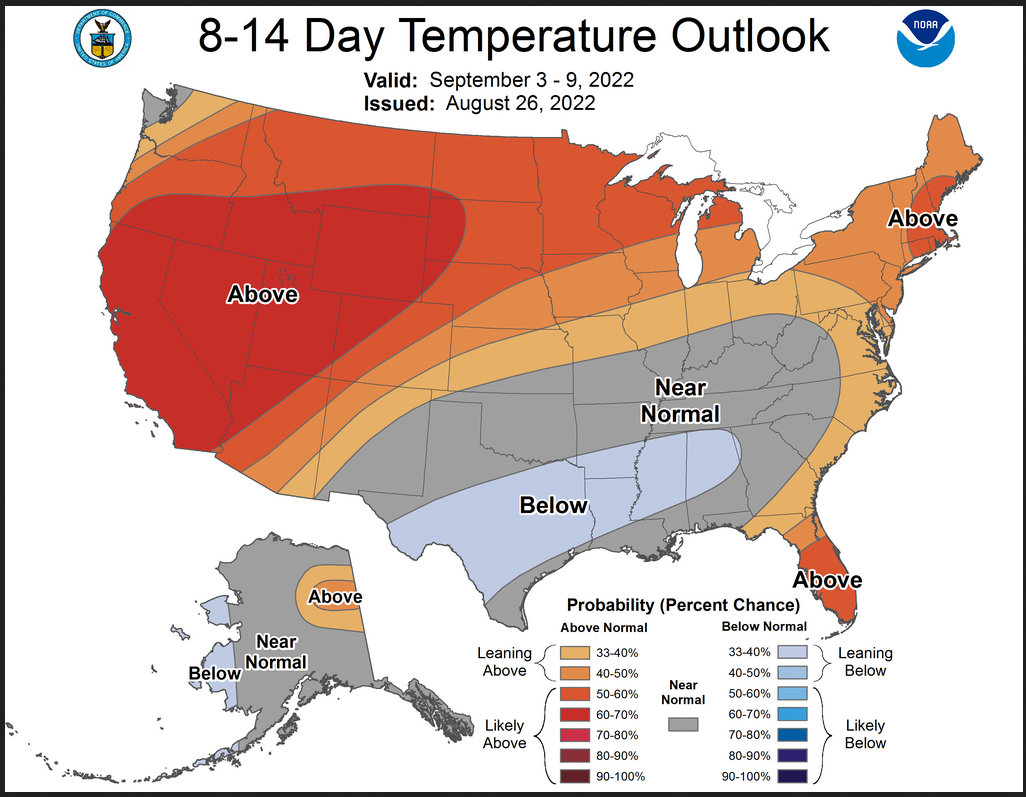
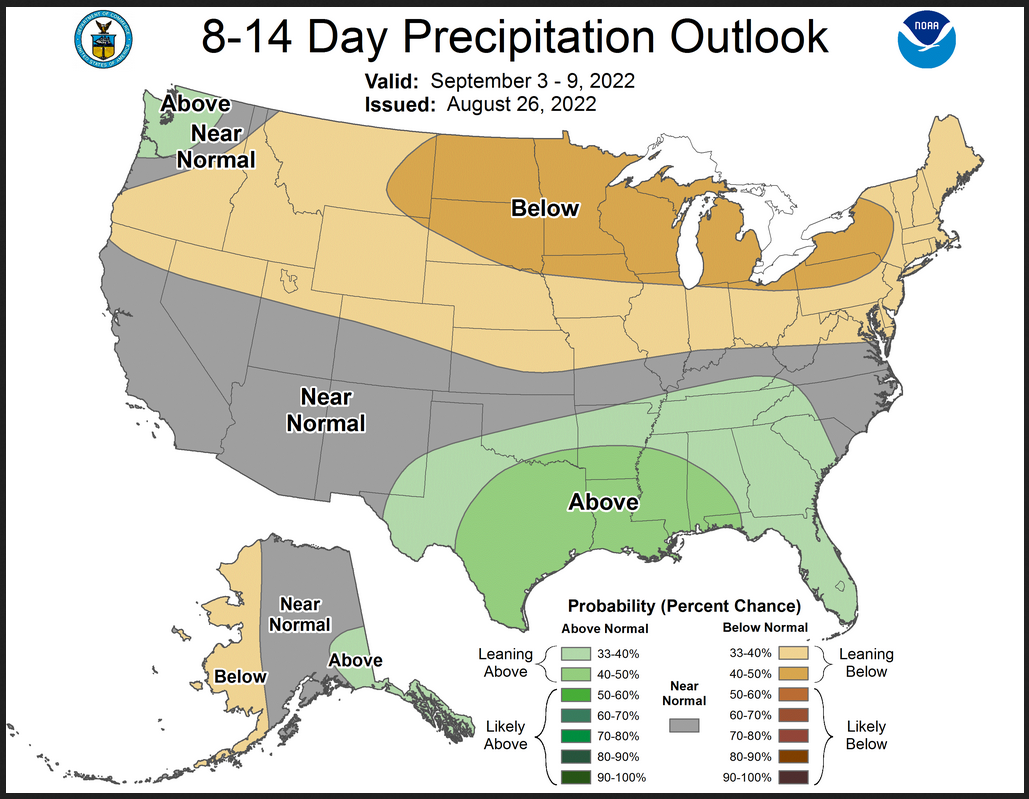
| North-South divide re anomalies. |
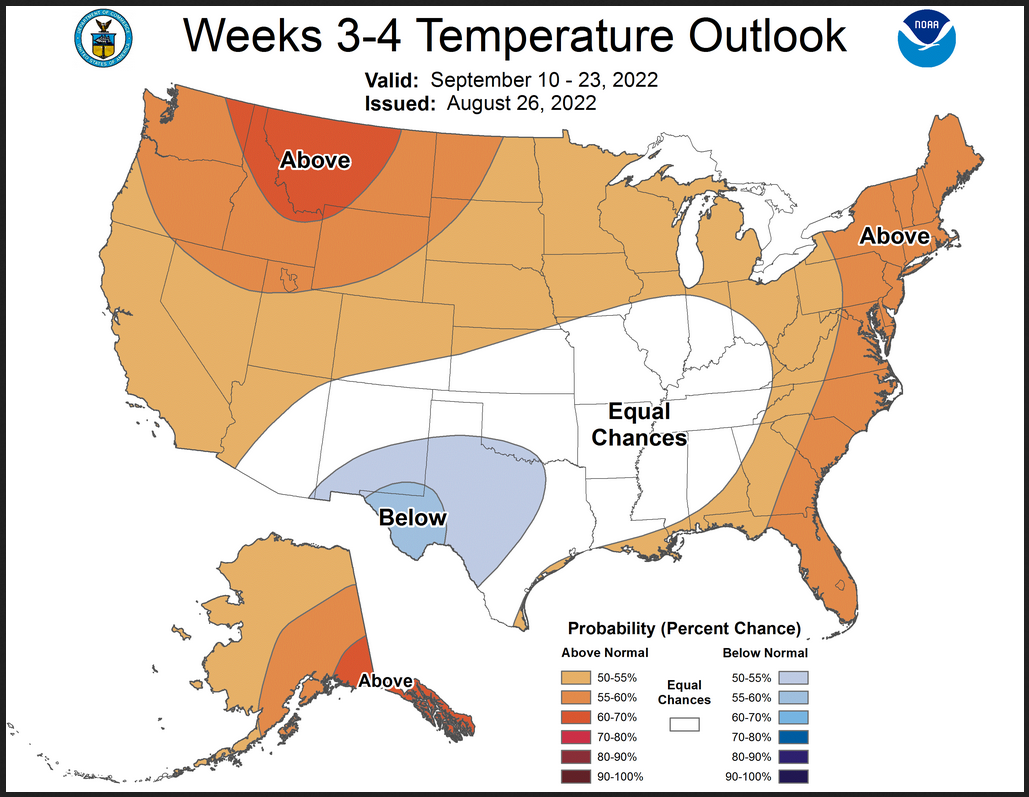
Now we address Weeks 3 and 4. This is a time frame that is very important. It is half of the 28-Day forecast period. That is why we include the discussion that accompanies the maps.
Prognostic Discussion for Week 3-4 Temperature and Experimental Precipitation Outlooks
NWS Climate Prediction Center College Park MD
300PM EDT Fri Aug 26 2022
Week 3-4 Forecast Discussion Valid Sat Sep 10 2022-Fri Sep 23 2022
La Niña conditions are currently present with below average sea surface temperatures (SSTs) across most of the tropical Pacific Ocean. Low-level easterly wind anomalies are observed across most of the equatorial Pacific Ocean, while upper-level westerly wind anomalies are observed over most of the equatorial Pacific. The Madden Julian Oscillation (MJO) is active with enhanced convection over the Indian Ocean as indicated by the real-time multivariate MJO (RMM) index. However, dynamical model forecasts are in agreement that the MJO is expected to weaken in the next week, as La Niña continues to be the primary tropical climate driver. The Week 3-4 Temperature and Precipitation Outlooks are based primarily on operational dynamical guidance including the GEFSv12, CFSv2, ECMWF, JMA, and experimental guidance from the Subseasonal Experiment (SubX) multi-model ensemble (MME) prediction systems, with additional considerations for soil moisture temperature feedbacks, canonical La Niña impacts, decadal climate trends, and the evolution of the pattern from the Week-2 forecast.
Dynamical model 500-hPa height anomaly forecasts predict a change in the forecast pattern present during the week-2 period, a ridge centered over the north-central CONUS. There is considerable uncertainty and large differences among the model forecasts for the week 3-4 period. The ECMWF and GEFSv12 500-hPa height forecasts predict a trough developing over the northwestern CONUS, during the week 3-4 period, and a ridge over the eastern CONUS. The JMA forecast is similar, but with weaker anomalies. In contrast, the CFSv2 forecast predicts a ridge over the western CONUS and a trough over the east. The SubX MME mean indicates generally positive 500-hPa height anomalies across much of the CONUS. Dynamical model 500-hPa height anomaly forecasts for Alaska indicate much variation with generally positive 500-hPa height anomalies indicated across most of the state by model blends.
The Week 3-4 Temperature Outlook favors enhanced probabilities of above normal temperatures across most of Alaska under generally positive 500-hPa height anomalies, with greater probabilities for above normal for southeastern Mainland Alaska and the Alaska Panhandle, consistent with the manual blend and the autoblend temperature forecast and the SubX MME forecast. Above normal temperatures are favored for much of the CONUS, under mostly positive 500-hPa height anomalies. However, probabilities are low for most areas, due to uncertainty among model forecasts. Probabilities for above normal temperatures are greatest over parts of the northern Intermountain West consistent with the autoblend and manual blend of temperature forecasts, especially for week-3, when uncertainty is lower than week-4. Probabilities for above normal temperatures decrease towards the coast of the Pacific Northwest, with the potential formation of a trough in week-4. A large area of equal chances (EC) of above normal and below normal temperatures is forecast for interior eastern CONUS, where there is considerable disagreement between dynamical model forecasts such as the ECMWF and CFSv2, and the SubX MME forecast indicates low probabilities as well. Below normal temperatures are favored for parts of the Southwest, supported by the autoblend as well as the ECMWF temperature forecast, likely related to soil moisture temperature feedbacks. Above normal temperatures are favored for the Gulf Coast, the Eastern Seaboard, and for the Northeast, consistent with the autoblend and the SubX MME.
The Week 3-4 Precipitation Outlook shows considerable uncertainty and indicates equal chances (EC) of above and below median precipitation across most of the CONUS. Above median precipitation is favored for the Southwest Monsoon region extending northward into the Central Rockies, and is slightly favored for much of the Gulf Coast region, supported by dynamical model forecasts including the ECMWF, JMA and the SubX MME. Below median precipitation is favored for the Northeast region, under a predicted ridge in the manual blend of model forecasts, including the GEFS and ECMWF ensembles. Above median precipitation is favored for southwestern Mainland Alaska, while below median precipitation is favored for southeastern Alaska including the Alaska Panhandle, as predicted by the autoblend.
Above average SSTs are present around the Hawaiian Islands. Above normal temperatures and below median precipitation are predicted for all of Hawaii during the week 3-4 period, as indicated by the SubX MME.
| The extremes are shown on the maps and described in the text. It is important to note that the Week 3 -4 Outlook is prepared by a different team than the 6 -10 and 8 – 14 day Outlooks. |