Here is what we are paying attention to this evening and the next 48 hours from this evening’s NWS Forecast.
...Heavy Rain and Flash Flooding threats expected across areas of east
Texas into the Lower Mississippi Valley over the next two days...

...Above average temperatures to continue from the inland valleys of
California into the Great Basin and Pacific Northwest, while below average
temperatures expected across the South from the Southern Plains into the
Southeast...
Continuation of the NWS Short Range Forecast (It is updated twice a day and these updates can be found here.
A very wet weather pattern will continue across portions of the southern
U.S. from east Texas into the Lower Mississippi Valley over the next few
days.  A surface frontal boundary is forecast to remain stalled across
this region with much above average levels of moisture in the vicinity of
this front.  Active showers and thunderstorms are likely over the next few
days in the vicinity of this front from east Texas into the Lower
Mississippi Valley.  This will bring the likelihood of heavy rains and
flash flooding to these areas.  The expected heavy rains over the next few
days will be to the southeast of areas of north Texas, including the
Dallas-Ft Worth area, that received very heavy rainfall amounts over the
past 24 hours.  Rainfall reports across this region showed numerous totals
of 5-10 inches.  Much of north Texas has seen drought conditions worsen
over the past few months.  While these rains will provide some relief,
rainfall is not expected to return to North Texas for the remainder of the
week.  Areas farther to the southeast of North Texas, however, will see
rainfall totals of 3-5 inches with locally heavier amounts likely over the
next few days.  Flood and flash flood watches are currently our across
these areas.

In addition to the wet weather across portions of the South, temperatures
are also expected to remain below average due to the cloud cover and
rainfall.  There have been a few record cold high temperatures over the
past weekend from New Mexico into northwest and north Texas where it has
been cloudy and wet.  The potential for additional record low maximum
temperatures will continue Monday and Tuesday over east Texas into the
Lower Mississippi Valley.  In contrast , above average temperatures will
continue over the next few days from the interior Valleys of California,
northward into the Great Basin and Pacific Northwest.  However, at the
moment, it appears there will not be any record highs across these
regions.  The hot and dry weather over portions of the Pacific Northwest,
Northern Great Basin and Northern Rockies will also increase the fire
weather threat across these regions.
Maps that relate the forecast to geography can be found by clicking Here for Day 1 and Here for Day 2.
Here is a 60-hour animated forecast map that shows how the short-term forecast is expected to play out.
If it needs to be updated click here.
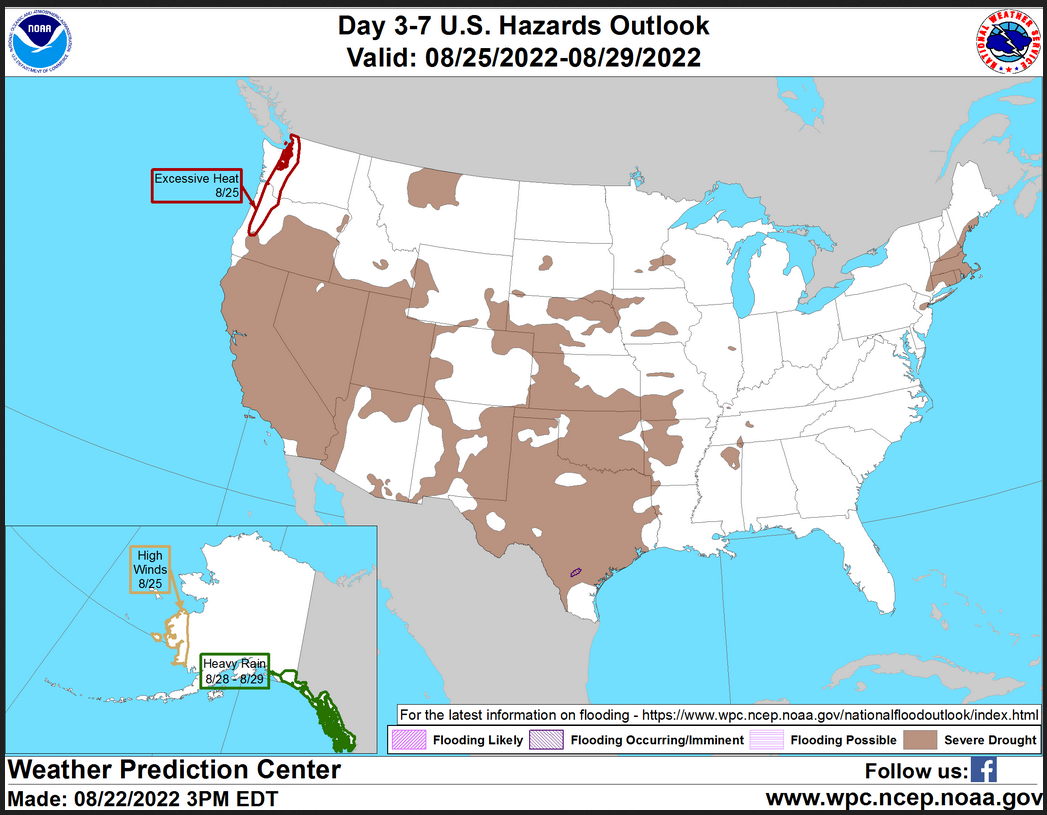
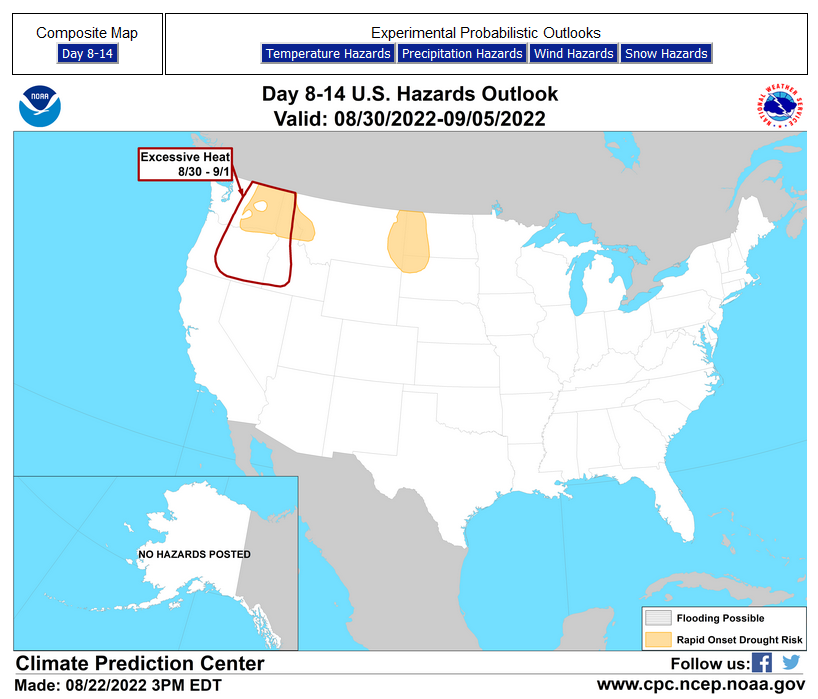
HAZARDS OUTLOOKS
Click he re for the latest complete Day 3 -7 Hazards forecast which updates only on weekdays. Once a week probably Monday or Tuesday I will update the images. I provided the link for readers to get daily updates on weekdays. Use your own judgment to decide if you need to update these images.
Worldwide Tropical Forecast
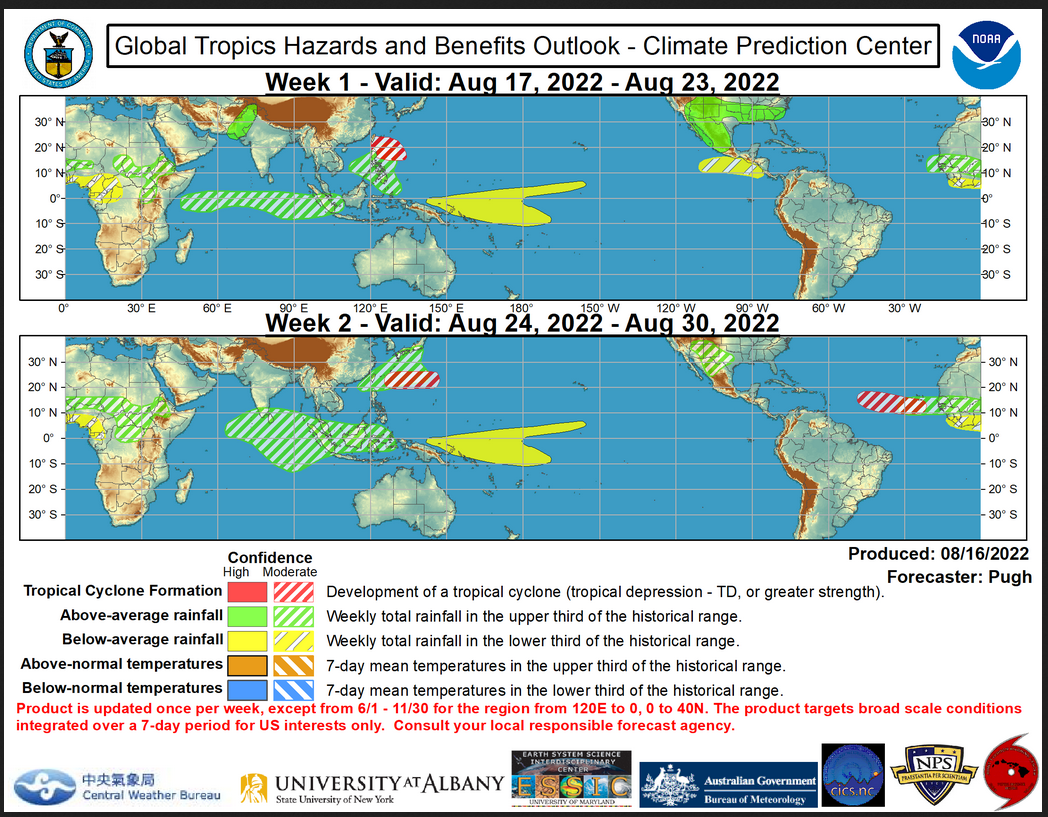
(This graphic updates on Tuesdays) If it has not been updated, you can get the update by clicking here
Detailed Maps and Reports for the Western Atlantic and the Pacific Oceans
Below are three maps that summarize the situation for the Atlantic, Eastern and Central Pacific. Additional information can be accessed by clicking HERE
First the Atlantic
Click to view the forecast map and have access to additional information https://www.nhc.noaa.gov/gtwo.php?basin=atlc&fdays=5
Then Eastern Pacific
Click to view the forecast map and have access to additional information https://www.nhc.noaa.gov/gtwo.php?basin=epac&fdays=5
Then Central Pacific
Click to view the forecast map and have access to additional information https://www.nhc.noaa.gov/gtwo.php?basin=cpac&fdays=5
And the Western Pacific
Click to view the forecast map and have access to additional information https://www.metoc.navy.mil/jtwc/jtwc.html
Some Intermediate-Term Outlooks
Links to “Outlook” maps and discussions for three time periods. Days 6 – 10, Days 8 – 14, and Weeks 3 and 4. An outlook differs from a forecast based on how NOAA uses these terms in that an “outlook” presents information from deviation from normal and the likelihood of these deviations.
You have to click on the links because they do not update automatically and I do not want to have stale images in the article. But it is not difficult to click on a link and you get a large image plus a discussion. On Fridays in a separate article, we will show the images and provide a link in this article that article. But remember what you will see is the images as of Friday. But here you can get the current images simply by clicking on them. Then hit the return arrow at the upper left of your screen to return to the article. You will not find this information easily anywhere else.

Right now you can find these maps here (We show them every Friday there but you can click above and find them).
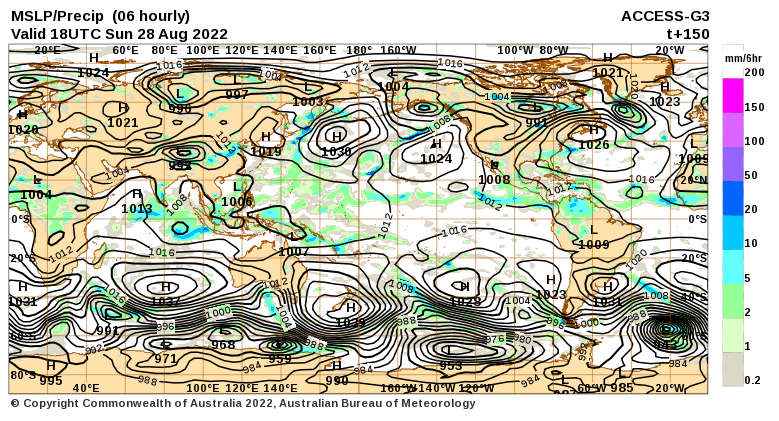
World Forecast for Day 6 (Currently Set for Day 6 but the reader can change that)
World Weather Forecast produced by the Australian Bureau of Meteorology. Unfortunately, I do not know how to extract the control panel and embed it into my report so that you could use the tool within my report. But if you visit it Click Here and you will be able to use the tool to view temperature or many other things for THE WORLD. It can forecast out for a week. Pretty cool. Return to this report by using the “Back Arrow” usually found top left corner of your screen to the left of the URL Box. It may require hitting it a few times depending on how deep you are into the BOM tool. Below are the current worldwide precipitation and air pressure forecasts for six days out. They will not auto-update and right now are current for Day 6. If you want the forecast for a different day Click Here I will try to update this map each day but you have the link so you can access the dashboard and get a wide variety of forecasts.
I mostly rely on the reader to interpret world maps. For this map, areas of expected precipitation for the date and time shown are clearly shown.
The number of High-Pressure systems shown is called the Wave Number. Maybe I will discuss WN someday. But it shows how many Rossby Waves there are around the World. Sometimes they are hard to count. Counting Low-Pressure systems should provide the same WN. Rossby Waves are the way the temperature distribution of the Planet remains in balance. It is basically the science of fluid dynamics. It can be very helpful in predicting the movement of weather patterns. You can snip an area of interest and move it into MS Paint and enlarge it.
Month to Date Information
Month to date Temperature can be found at https://hprcc.unl.edu/products/maps/acis/MonthTDeptUS.png
Month to date Precipitation can be found at https://hprcc.unl.edu/products/maps/acis/MonthPNormUS.png