Updated at 6 pm EDT August 23, 2022. It was not possible to update the Week 3-4 Outlooks as they only update on Fridays
Southern Tier to be very wet for the next two weeks.
NOAA updates many of their weather outlooks and in many cases issues a discussion with those outlooks. On Fridays, they issue a week 3 – 4 outlook which is farther out than the typical 10-day forecast and the discussion is excellent. So we have decided to issue a weekly special report on Fridays.
When the Week 3-4 Outlook is issued, we have a 28-day view of the future. It is important to recognize that the forecasts do not always work out as predicted. But in the article, there are links to obtain updated forecasts. Since we are often publishing this article on Sunday, we then only have a 26-day view of the future. Sorry about that. It is really a 27-day view but Sunday readers are seeing it one day late. But 26 days is still a pretty long forecast. The update I just made did not update the week – 4 Outlook but it updated all the Outlooks for the next 14 days. There will be a new article soon with the updated Week 3 – 4 Outlook, but I might update it in this article also. The links are provided for all the graphics so the reader can get the updated version but this article is now up to date except for the Week3 – 4 Outlook which can not be updated until Friday.
We have also taken a look at the state temperature and precipitation rankings for Sept to November LAST YEAR and Year to Date (YTD) This year. Some may view that as apples and oranges but it will give us something to compare against as the next three months evolve. So we can come back in early December to see how the two years compare. My guess is that it will be pretty similar but it may be interesting to some people.

| Announcement: We now publish a daily weather report that addresses both short-term and intermediate-term weather issues including tropical events and you can find it at econcurrents.com. To return to this article just hit the return arrow at the upper left corner on your screen. This message is mainly for future reference as this article covers most of what you need to know other than tropical events. I do not include those in this article as generally, it is not possible to predict them out to 28 days. The links to information on tropical events are in the Daily Report. |
What NOAA is predicting for the next 28 days.

We will start with the short-term – It is up to date as of today. If you look at this article after today you can click the links to update (plus you will end up with a lot of additional information)
| Temperature (Maximum Anomaly) for the next five days | Precipitation (Five days of cumulative precipitation) |
| https://www.wpc.ncep.noaa.gov/medr/me dr_mean.shtml | https://www.wpc.ncep.noaa.gov/qpf/day1-7.shtml |
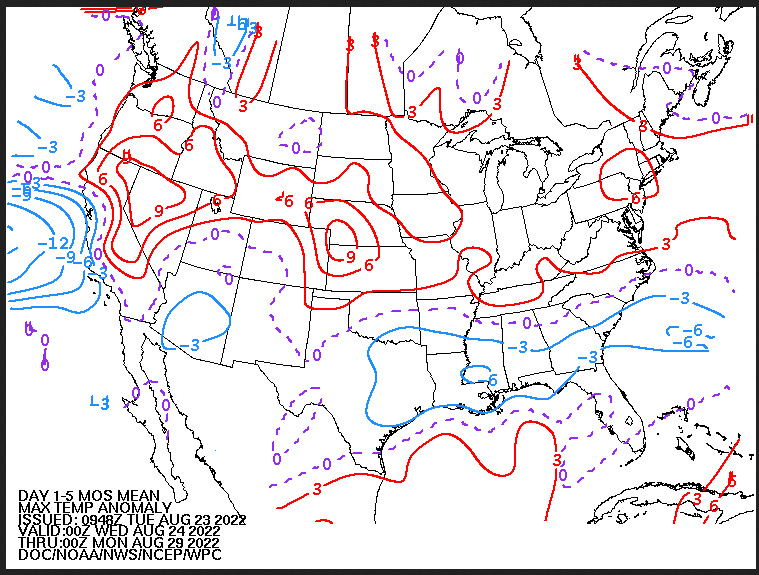
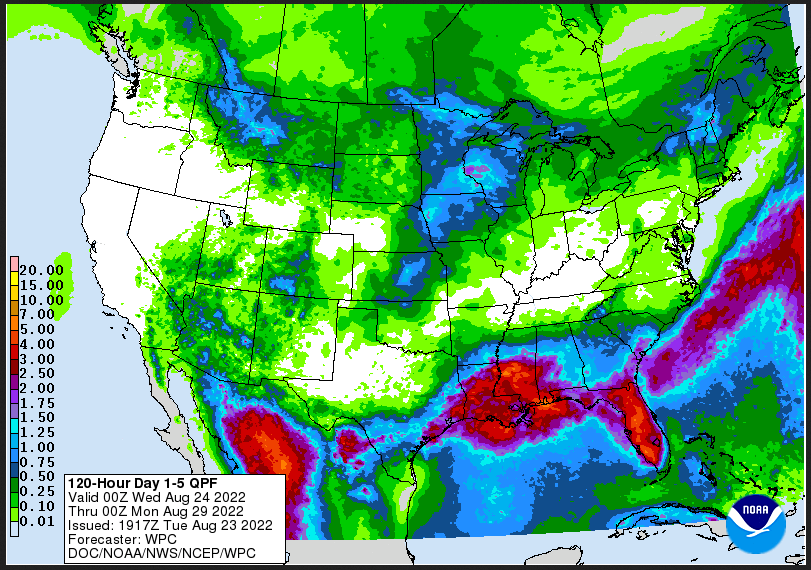
| Most of the warm temperature anomalies are in the Northwest and North Central areas. The precipitation focuses on Texas and Louisiana. |
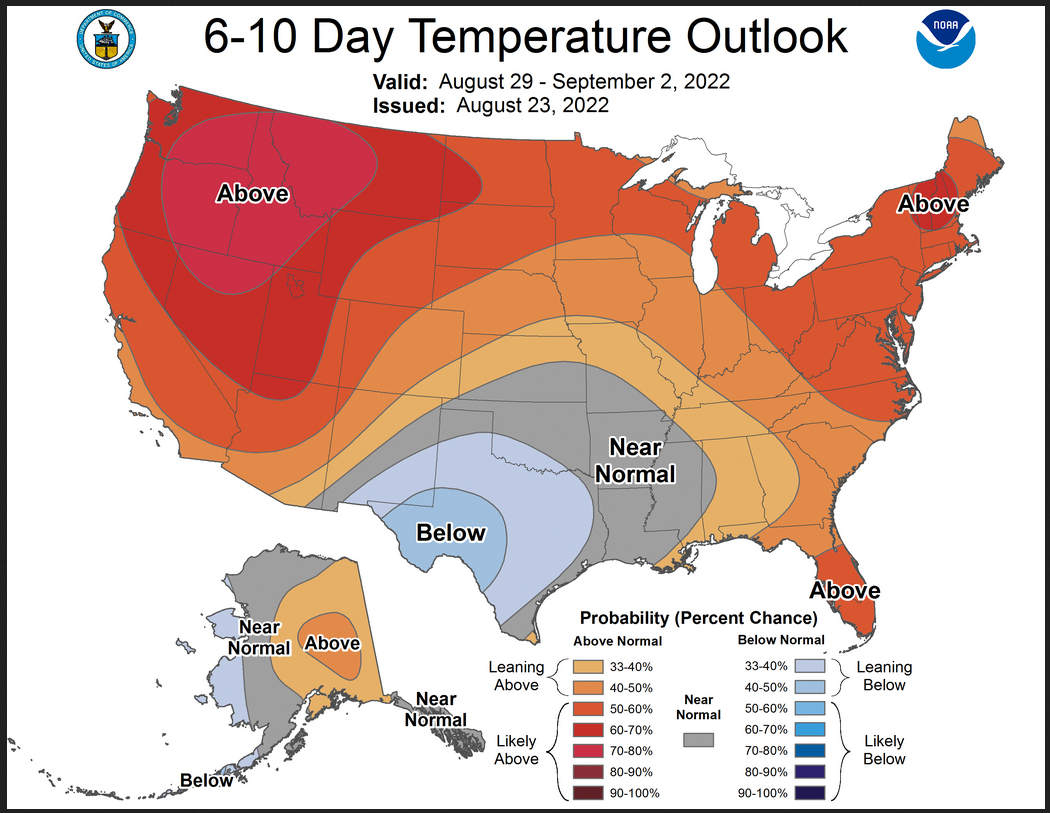
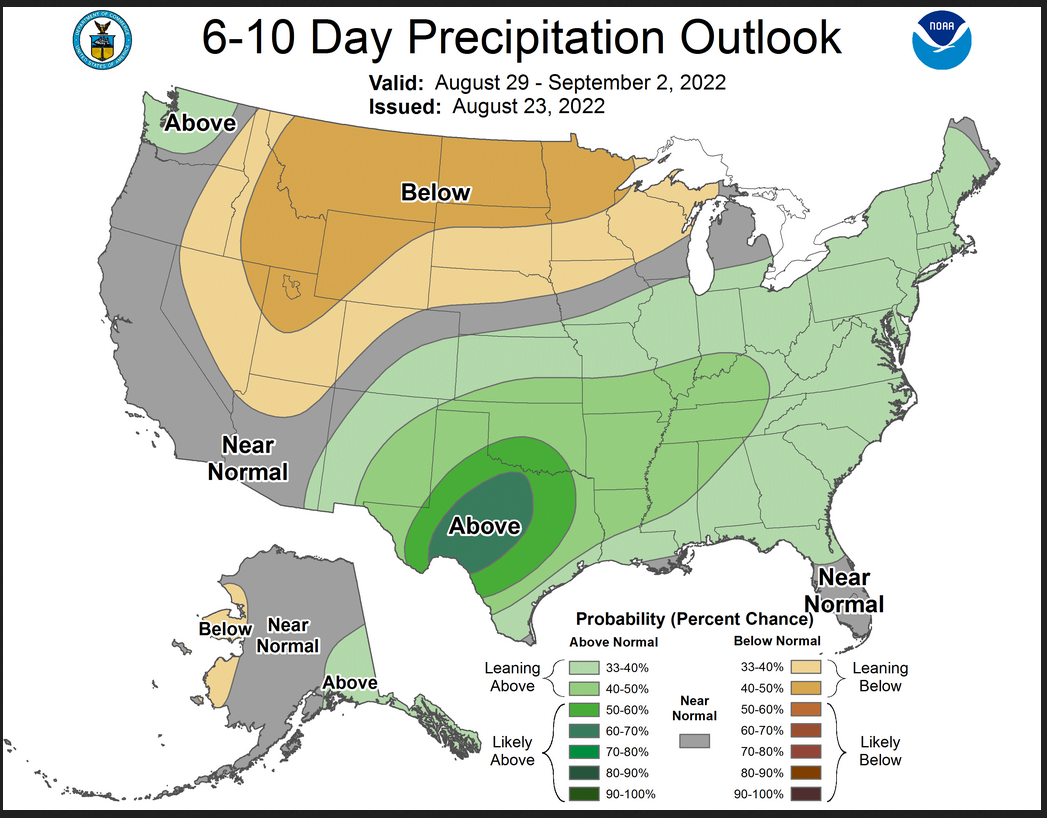
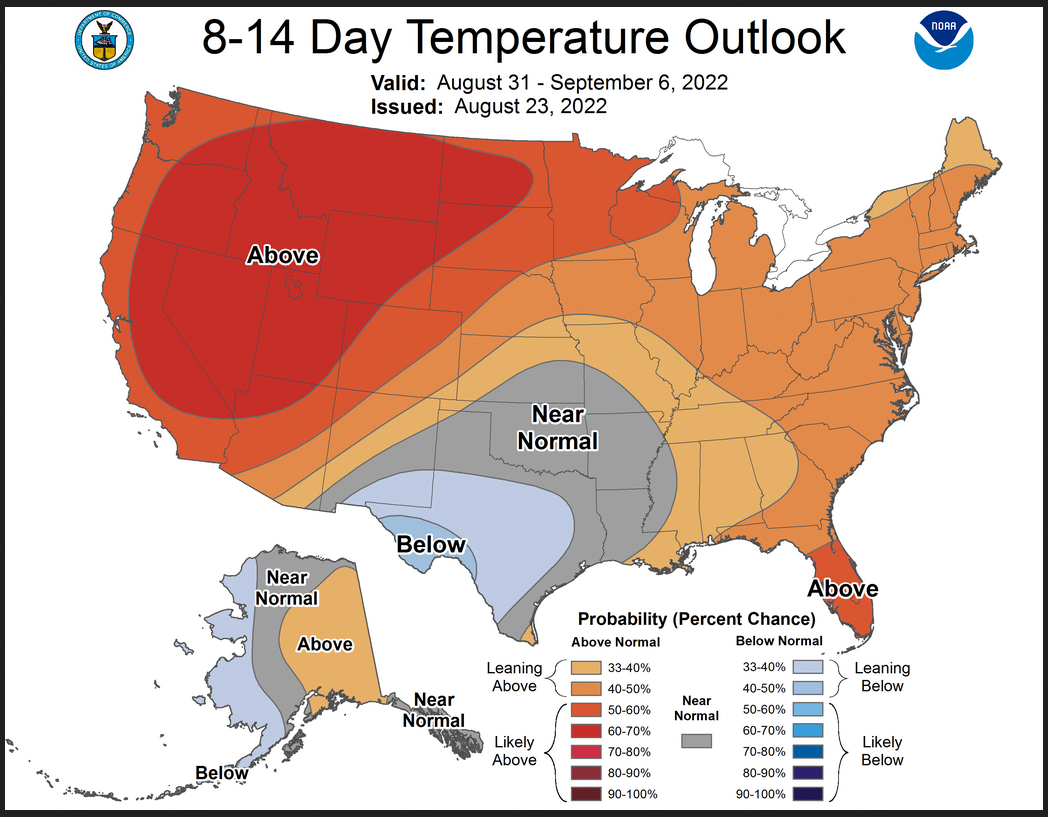
Now we look at “Outlook” maps for three time periods. Days 6 – 10, Days 8 – 14, and Weeks 3 and 4. An outlook differs from a forecast based on how NOAA uses these terms in that an “outlook” presents information as deviation from normal and the likelihood of these deviations.
I have provided the maps so you do not need to click to get them. But they do not update daily. But you can get the current images simply by clicking on the links provided. Then hit the return arrow at the upper left of your screen to return to the article. There is no need to do that right away since what is published today is up to date. The Week 3 – 4 Outlook only updates on Fridays.
Below are the links to obtain updates and additional information.
| The wet area is impressive. What drought? |
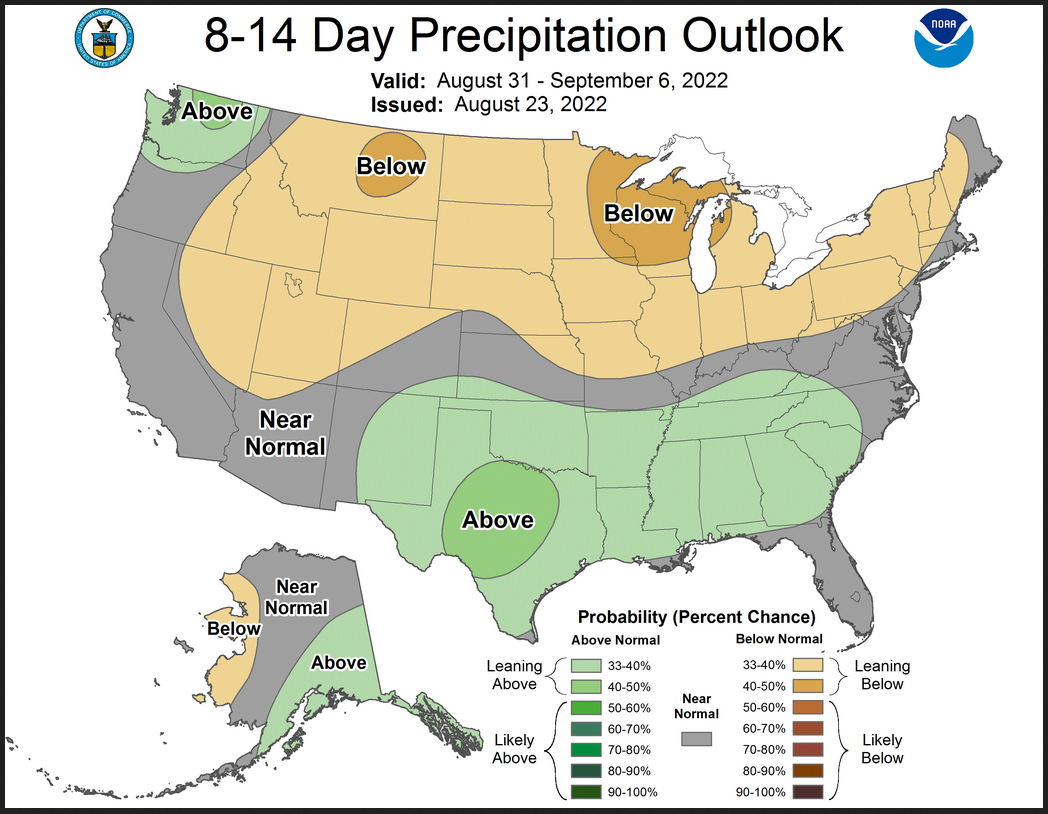
| Southern tier wetness continues into the Day 8 – 14 period. But the area involved is slightly less. |
Now we address Weeks 3 and 4. This is a time frame that is very important. It is half of the 28-Day forecast period. That is why we include the discussion that accompanies the maps.
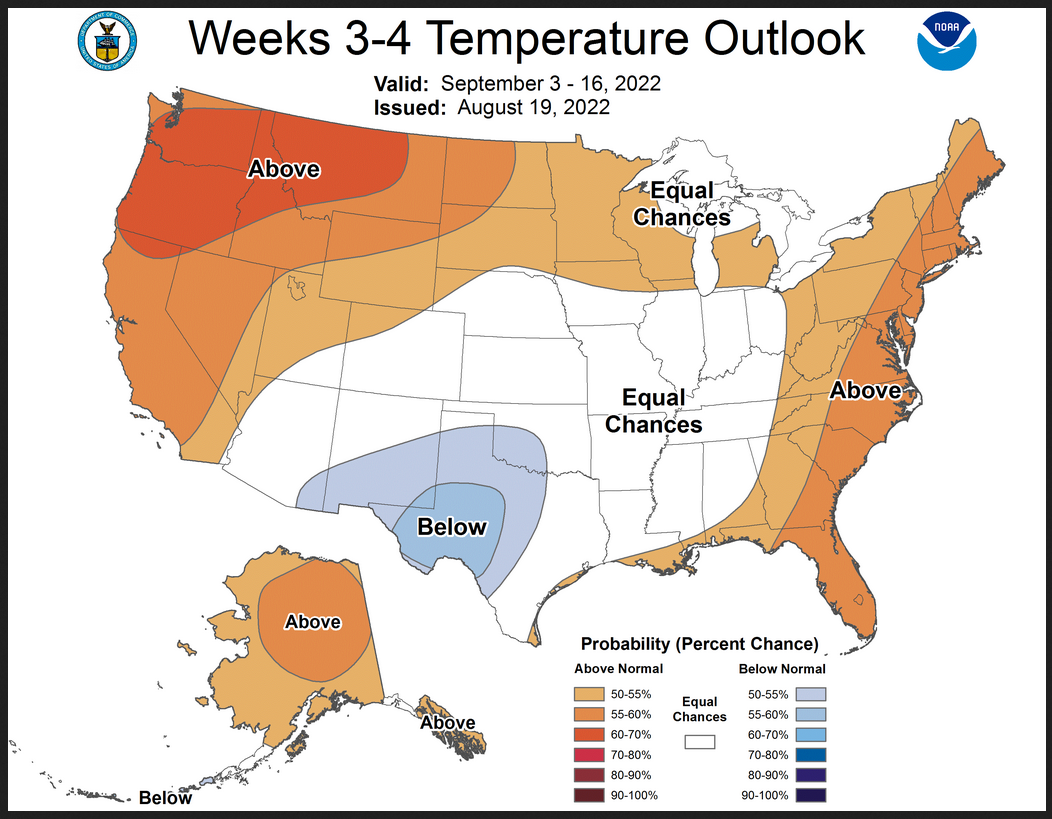
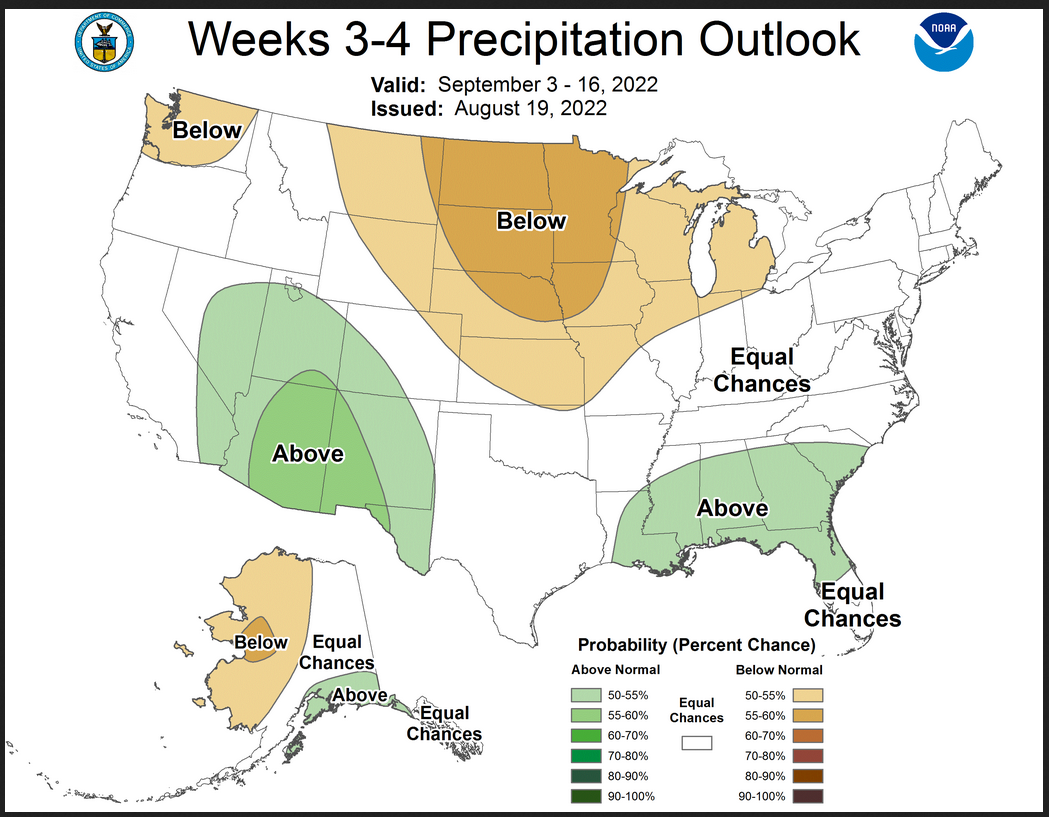
Prognostic Discussion for Week 3-4 Temperature and Experimental Precipitation Outlooks
NWS Climate Prediction Center College Park MD
300PM EDT Fri Aug 19 2022
Week 3-4 Forecast Discussion Valid Sat Sep 03 2022-Fri Sep 16 2022
La Niña conditions are currently present with below average sea surface temperatures (SSTs) across most of the tropical Pacific Ocean. Low-level easterly wind anomalies were evident across most of the equatorial Pacific Ocean, while upper-level westerly wind anomalies were observed over most of the equatorial Pacific. The Real-time Multivariate Madden Julian Oscillation (RMM) index indicates a weak intraseasonal and incoherent signal with La Nina during the last week. Dynamical models depict a strengthening MJO across Africa with eastward propagation over the Indian Ocean during the next two weeks. The Week 3-4 Temperature and Precipitation Outlooks are based primarily on operational dynamical guidance including the GEFSv12, CFSv2, ECMWF, JMA, and experimental guidance from the Subseasonal Experiment (SubX) multi-model ensemble (MME) prediction systems, with additional considerations for Madden Julian Oscillation (MJO) states, the El Niño Southern Oscillation (ENSO), decadal climate trends, and the evolution of the pattern from the Week-2 forecast.
Dynamical model 500-hPa height anomaly forecasts during Week 3-4 show a fairly consistent evolution from Week-2 forecasts. A blend of the CFSv2, ECMWF, and GEFSv12 500-hPa height pattern forecasts plus a small contribution from the Multivariate Linear Regression (MLR) height forecast based on the RMM index, La Niña, and decadal trends, predicts a weak anomalous trough over the eastern CONUS. Anomalous ridging and positive 500-hPa height anomalies are forecast over the northwestern CONUS. Troughing with below-normal 500-hPa heights are predicted over the Aleutians, while above-normal 500-hPa heights are forecast over Mainland Alaska and the Alaskan Panhandle. Most dynamical models feature above normal 500-hPa heights over the Hawaii islands.
The Week 3-4 Temperature Outlook favors enhanced probabilities of above normal temperature for the region stretching from western CONUS to the Great Lakes region and is consistent with a forecasted ridging pattern over the northwestern CONUS. The highest probability of above normal temperatures (60-70%) are forecast for the northwestern CONUS beneath a strong anomalous ridge. Elevated probabilities of above normal temperature are also favored for the Northeast and Southeast, where decadal trends and dynamical guidance support a tilt toward above normal temperature. Weak enhanced probabilities of below normal temperatures are favored for parts of New Mexico and the Southern Plains, supported by most dynamical model forecast tools (ECMWF, CFS, and JMA). Elevated probabilities of above normal temperature are indicated over Mainland Alaska and the Alaskan Panhandle under an above normal 500-hPa height pattern. Increased probabilities of below normal temperatures are favored for the Aleutians and supported by the troughing pattern in the forecast.
The Week 3-4 Precipitation Outlook favors below median precipitation over Washington and toward the Northern Plains to the Great Lakes, and then also southward into the Central Plains. Models robustly agree on a widespread monsoon for the Desert Southwest. Dynamical models also indicate weakly enhanced probabilities of above median precipitation over parts of the Southeast under near-normal 500-hPa height anomalies and elevated soil moisture anomalies. Dynamical models generally agree on a tilt toward below median precipitation over western Mainland Alaska associated with forecasted above normal 500-hPa heights. Also, models agree on above median precipitation for southeastern Mainland Alaska.
Above-average sea surface temperatures are currently observed in the vicinity of Hawaii.The SubX MME probabilistic temperature forecast favors above average temperatures over Hawaii during the Week 3-4 outlook period. Dynamical model guidance from the SubX MME shows increased probabilities for below median precipitation over the Hawaiian islands as well.
| The extremes are shown on the maps and described in the text. It is important to note that the Week 3 -4 Outlook is prepared by a different team than the 6 -10 and 8 – 14 day Outlooks. |
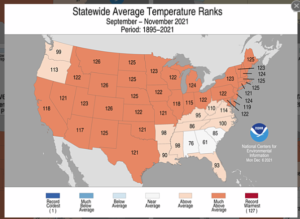
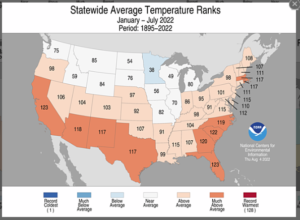
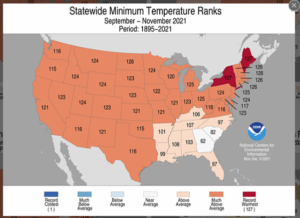
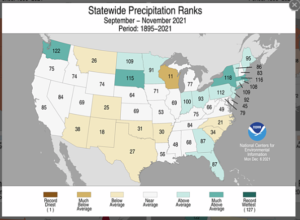
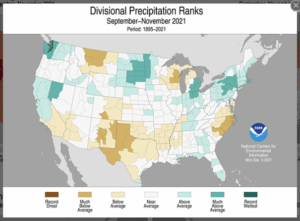
Now we are going to do something silly. We are going to look at SON last year and this year YTD through July 2022.
The state rankings show where for each state, their SON 2021 weather on the left and their year-to-date (YTD) weather on the right fits within their 128-year modern set of data which is considered the most reliable. They are color-coded to make them easier to read. I have no idea why the images are of different sizes. Actually, I do but I do not want to make the considerable effort to fix that. In early December we will see how SON this year compares to SON Last Year. It may tell us something about how a La Nina behaves as it weakens and dies. It certainly would not be statistically significant but it may suggest a research project that I could do since the data is available. It can be useful to be curious.
| September to November Last Year 2021 |
Year to Date 2022 |
|
|
|
|
|
|
|
|
|
|
|
|
|
|
|
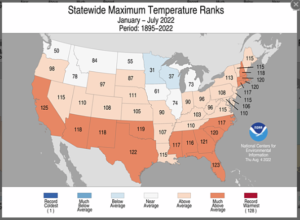
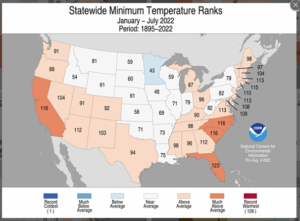
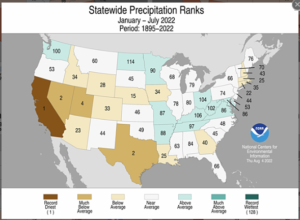
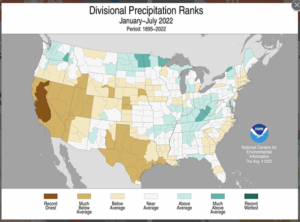
| YTD, California has had the driest year in modern history. The Climate Division Maps provide more information with respect to where in each state the lows and highs were. |