Here is what we are paying attention to this evening and the next 48 hours from this evening’s NWS Forecast.
...Heavy rain and flash flooding possible across the Southwest and
Southern Rockies through at least the end of the week...

...Showers and thunderstorms near a slow-moving frontal boundary to
produce locally heavy rain over the Middle/Lower Mississippi Valley
tonight into the Deep South on Wednesday and Thursday...

...Dangerous heat and humidity across eastern Texas and the Gulf Coast to
mostly dissipate by Thursday, while record-breaking heat builds into the
Pacific Northwest...
Continuation of the NWS Short Range Forecast (It is updated twice a day and these updates can be found here.
The threat for flash flooding is expected to continue across the
southwestern U.S. and into the southern/central Rockies over the next
several days as the summer monsoon persists through mid-August. An
approaching cold front stretching towards the central Rockies from the
southern Plains will help focus additional rounds of thunderstorms across
the high terrain of southern Colorado and northern New Mexico into
Wednesday. Flash Flood Watches have been issued in order to further
highlight the concern. For the Southwest, widespread anomalous atmospheric
moisture content remains entrenched over the region and will allow for
developing thunderstorms to contain heavy rainfall rates. Overall, impacts
through Thursday are expected to be localized and occur underneath
isolated downpours. The greatest risk for more scattered flash flooding
extends along the U.S.-Mexico border from southern Arizona to far West
Texas. An influx of additional moisture associated with a low pressure
system, which originated across the western Gulf of Mexico last weekend,
will aid in numerous thunderstorms across this region on Wednesday and
Thursday. A Slight Risk (level 2/4) of Excessive Rainfall has been issued.

The other area at risk for flash flooding over the next few days is along
and near a stationary boundary draped from the Southeast to the southern
Plains. Numerous showers and thunderstorms are likely to the north of this
boundary from southern Missouri to northern Arkansas tonight, which could
add up to a few inches of rain and scattered flash flooding. By Wednesday
and Thursday, the threat of locally intense rainfall rates should expand
along the aforementioned boundary and stretch from the Lower Mississippi
Valley to the coastal Carolinas. Some spots within this area could receive
several inches of rainfall, leading to localized flooding concerns.
Additionally, a few storms will have the potential to strengthen and
produce frequent lightning along with isolated damaging wind gusts.

Elsewhere, scattered thunderstorms are possible across the northern Plains
and Upper Midwest through Thursday. A few storms could turn severe and
produce damaging wind gusts and large hail through tonight. For New
England, a developing coastal storm is forecast to swing northward into
the Gulf of Maine on Wednesday. Moderate-to-locally heavy rain is possible
from eastern Massachusetts to northern Maine beginning late tonight, with
most rainfall characterized as beneficial for the drought-stricken
regions. Gusty winds along coastal sections of New England are also
expected, which has prompted High Surf and Wind Advisories to issued for
much of Cape Cod and eastern Massachusetts.

A few more days of dangerous heat is in store for parts of Texas and the
Gulf Coast before the approaching frontal boundary offers additional cloud
cover and cooler temperatures. Highs on Wednesday are still anticipated to
reach the triple digits throughout central/eastern Texas and northern
Louisiana, with humidity causing heat indices to near 110 degrees. By
Thursday, the above average and oppressive temperatures are forecast to
shrink and consolidate to south-central Texas and the middle/upper Texas
Gulf Coast. The most anomalous and potentially record-breaking heat shifts
into the Northwest through the end of this week as upper-level ridging
builds over the regions. Highs are forecast to soar into the upper 90s and
triple digits from central California to the northern Great Basin. This
equates to high temperatures around 10-20 degrees above average compared
normal mid-August conditions. Several daily high temperature records are
expected to be either tied or broken on Wednesday throughout
central/northern California, Idaho, Oregon, and Washington, with
additional records possible on Thursday. Excessive Heat Warnings and Heat
Advisories have been issued along the western United States. For the rest
of the Nation, comfortable below average to near average temperatures are
anticipated.
Maps that relate the forecast to geography can be found by clicking Here for Day 1 and Here for Day 2.
Here is a 60-hour animated forecast map that shows how the short-term forecast is expected to play out.
If it needs to be updated click here.
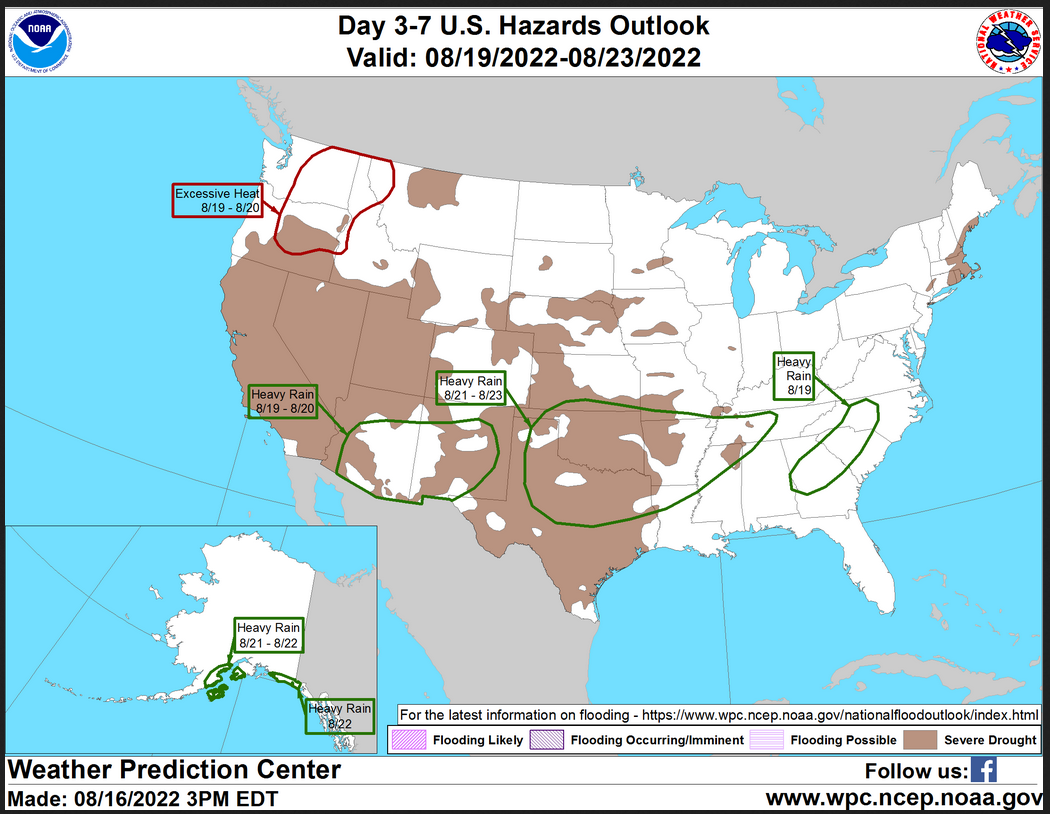
HAZARDS OUTLOOKS
Click here for the latest complete Day 3 -7 Hazards forecast which updates only on weekdays. Once a week probably Monday or Tuesday I will update the images. I provided the link for readers to get daily updates on weekdays. Use your own judgment to decide if you need to update these images.
Worldwide Tropical Forecast
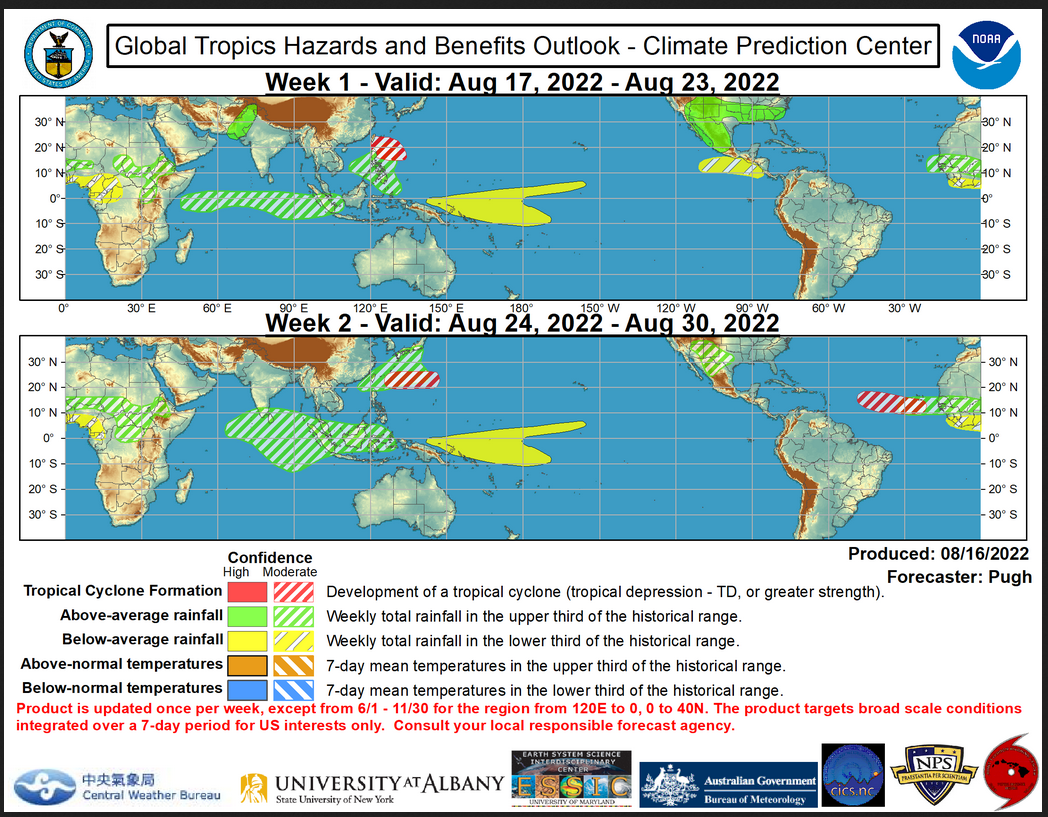
(This graphic updates on Tuesdays) If it has not been updated, you can get the update by clicking here
Detailed Maps and Reports for the Western Atlantic and the Pacific Oceans
Below are three maps that summarize the situation for the Atlantic, Eastern and Central Pacific. Additional information can be accessed by clicking HERE
First the Atlantic
Click to view the forecast map and have access to additional information https://www.nhc.noaa.gov/gtwo.php?basin=atlc&fdays=5
Then Eastern Pacific
Click to view the forecast map and have access to additional information https://www.nhc.noaa.gov/gtwo.php?basin=epac&fdays=5
Then Central Pacific
Click to view the forecast map and have access to additional information https://www.nhc.noaa.gov/gtwo.php?basin=cpac&fdays=5
And the Western Pacific
Click to view the forecast map and have access to additional information https://www.metoc.navy.mil/jtwc/jtwc.html
Some Intermediate-Term Outlooks
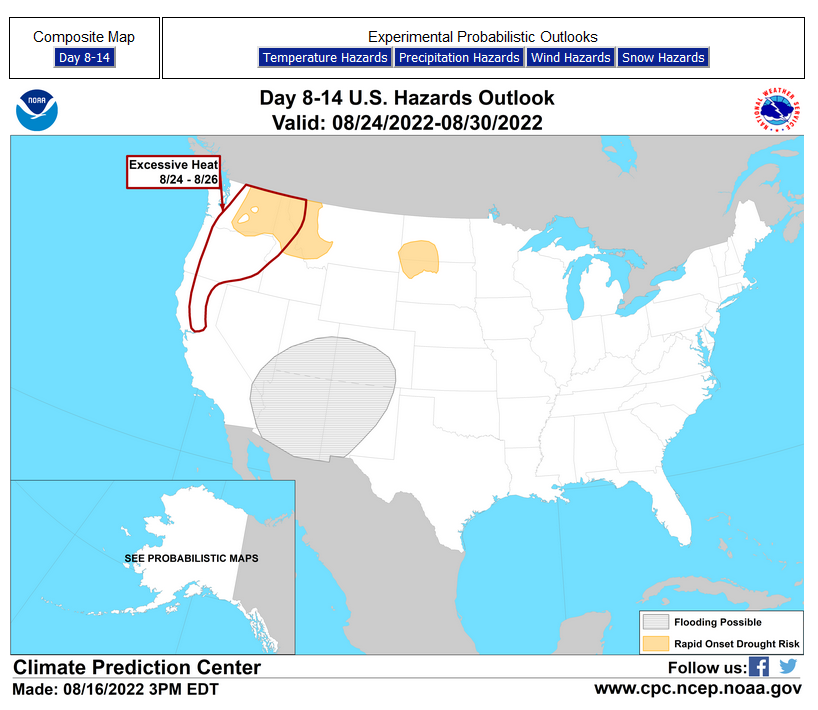
Links to “Outlook” maps and discussions for three time periods. Days 6 – 10, Days 8 – 14, and Weeks 3 and 4. An outlook differs from a forecast based on how NOAA uses these terms in that an “outlook” presents information from deviation from normal and the likelihood of these deviations.
You have to click on the links because they do not update automatically and I do not want to have stale images in the article. But it is not difficult to click on a link and you get a large image plus a discussion. On Fridays in a separate article, we will show the images and provide a link in this article that article. But remember what you will see is the images as of Friday. But here you can get the current images simply by clicking on them. Then hit the return arrow at the upper left of your screen to return to the article. You will not find this information easily anywhere else.

Right now you can find these maps here (We show them every Friday there but you can click above and find them).
World Forecast for Day 6 (Currently Set for Day 6 but the reader can change that)
World Weather Forecast produced by the Australian Bureau of Meteorology. Unfortunately, I do not know how to extract the control panel and embed it into my report so that you could use the tool within my report. But if you visit it Click Here and you will be able to use the tool to view temperature or many other things for THE WORLD. It can forecast out for a week. Pretty cool. Return to this report by using the “Back Arrow” usually found top left corner of your screen to the left of the URL Box. It may require hitting it a few times depending on how deep you are into the BOM tool. Below are the current worldwide precipitation and air pressure forecasts for six days out. They will not auto-update and right now are current for Day 6. If you want the forecast for a different day Click Here I will try to update this map each day but you have the link so you can access the dashboard and get a wide variety of forecasts.
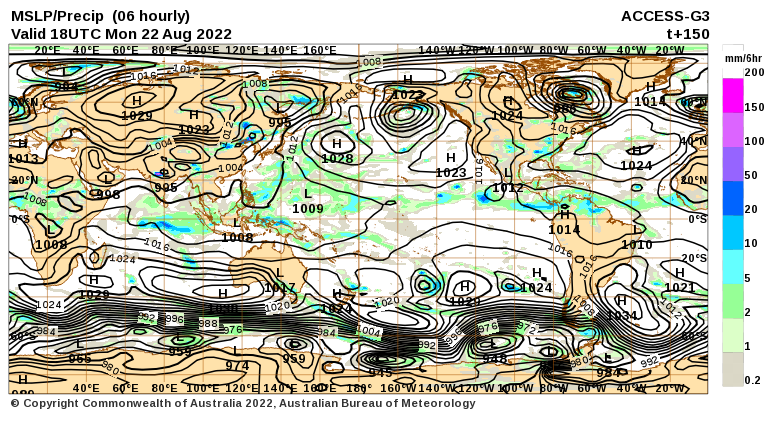 I mostly rely on the reader to interpret world maps. For this map, areas of expected precipitation for the date and time shown are clearly shown.
The number of High-Pressure systems shown is called the Wave Number. Maybe I will discuss WN someday. But it shows how many Rossby Waves there are around the World. Sometimes they are hard to count. Counting Low-Pressure systems should provide the same WN. Rossby Waves are the way the temperature distribution of the Planet remains in balance. It is basically the science of fluid dynamics. It can be very helpful in predicting the movement of weather patterns.
Month to Date Information
Month to date Temperature can be found at https://hprcc.unl.edu/products/maps/acis/MonthTDeptUS.png
Month to date Precipitation can be found at https://hprcc.unl.edu/products/maps/acis/MonthPNormUS.png
