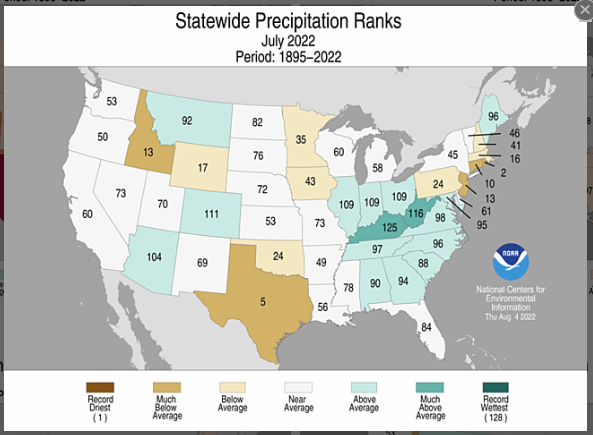
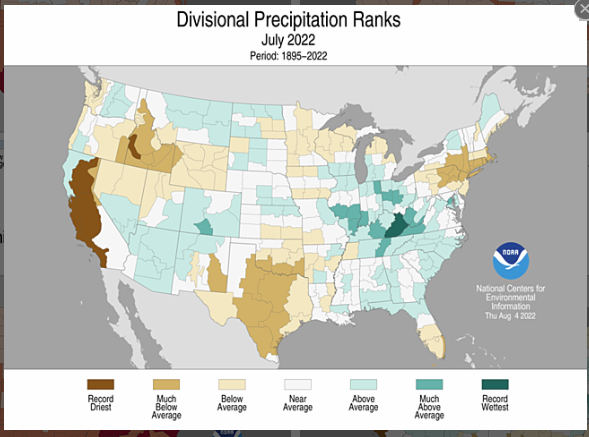
It is a good time to look at how the drought situation in the Continental U.S. has changed over the last couple of months. There is a big debate as to whether the increased precipitation in June and July really changed the situation or was simply a drop in the bucket and I am tending to agree with the “drop in the bucket” assessment. Keep on reading to find out why I have drawn that conclusion.
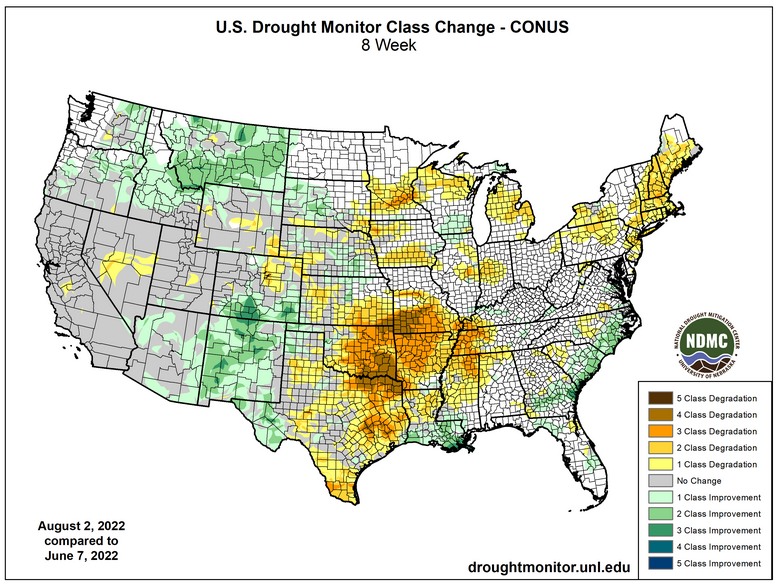
–
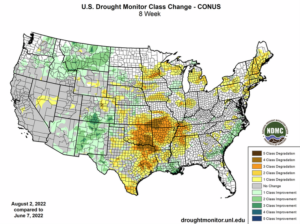
| As you can see the drought situation has improved in New Mexico and Montana but has deteriorated in part of the Great Plains. Below is the current drought situation. I will update that tomorrow so I provided a link to access the updated drought status. One week will not substantially change the analysis although it will improve things. |
–
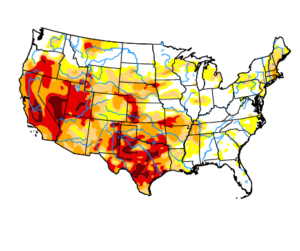
Here is the current Drought Map for CONUS
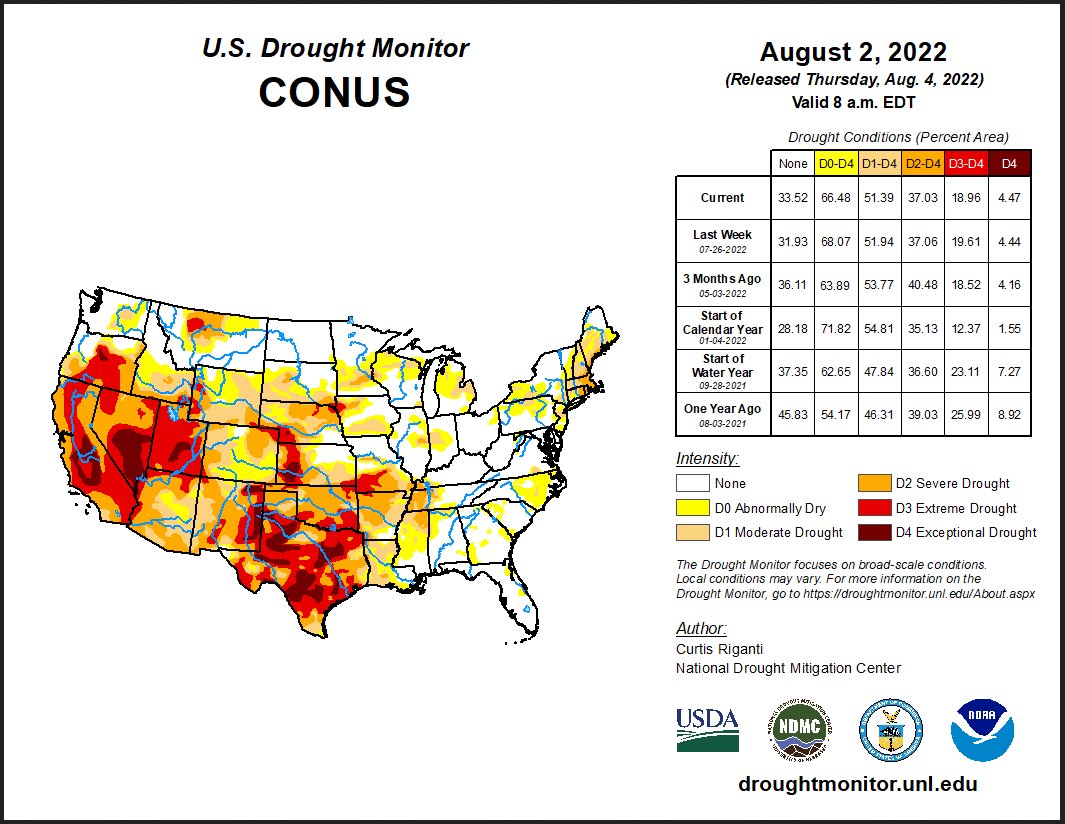
And updates are available here https://droughtmonitor.unl.edu/CurrentMap/StateDroughtMonitor.aspx?conus
–
| There is a lot of information in the above graphic. D0 is not considered drought but predrought. You can see the levels of the various intensities of drought for different time periods in the statistical table on the right. Perhaps of most interest is the D3-D4 Column. It was 26% (coverage of CONUS) a year ago and 19% now which is better but not much. So the “summer rains being a drop in the bucket” proponents may have a strong argument. The data released on Thursday will show some additional improvement. |
–
–
| August 2, 2022 Drought Monitor |
Changes on August 2, 2022
Compared to June 7, 2022 |
 |
 |
–
| It is always important to differentiate the current situation (shown on the left) from the change in a prior condition shown on the right. As an example, there has been a big improvement in New Mexico but New Mexico still remains in drought. |
–
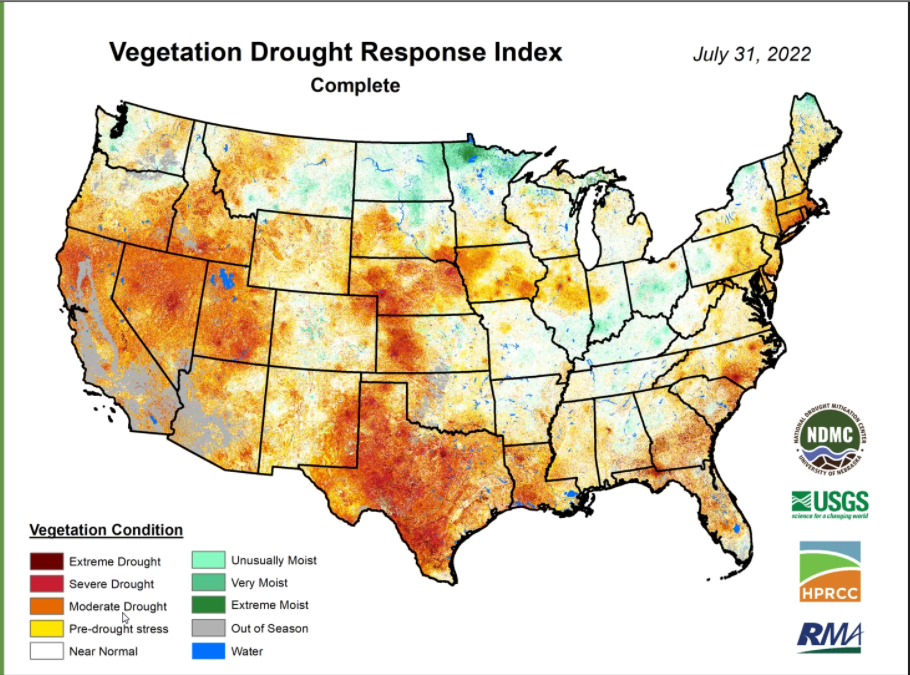
Here is another way to look at drought. What is the level of stress that prevents growing? That is what this graphic shows.
–
| There are many ways to look at things. Updates and more information on this index can be found here https://vegdri.unl.edu/ |
–
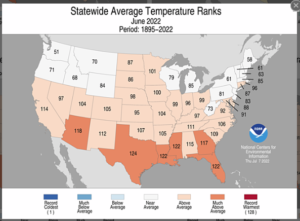
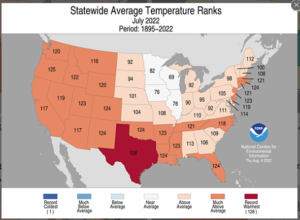
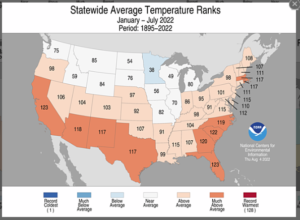
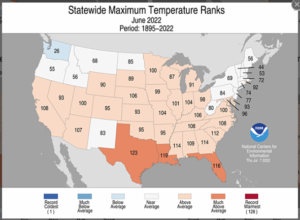
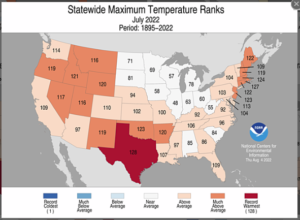
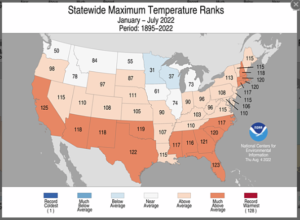
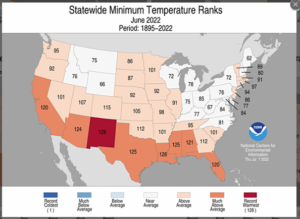
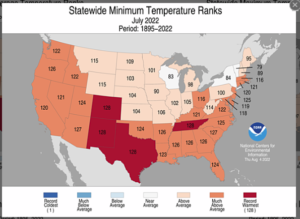
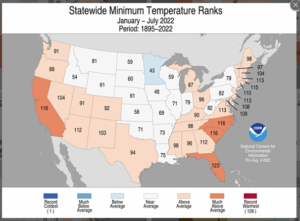
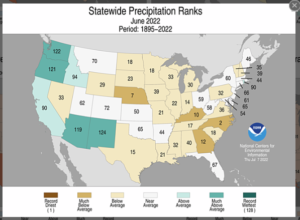
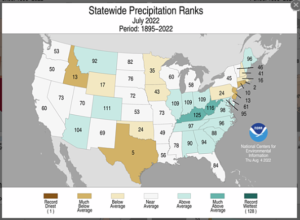
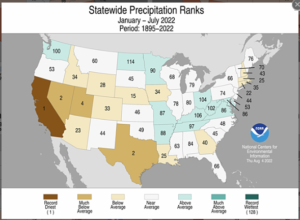
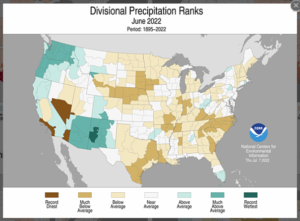
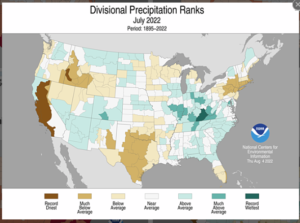
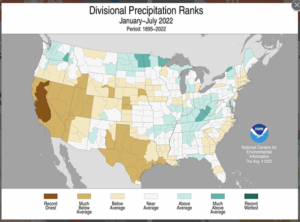
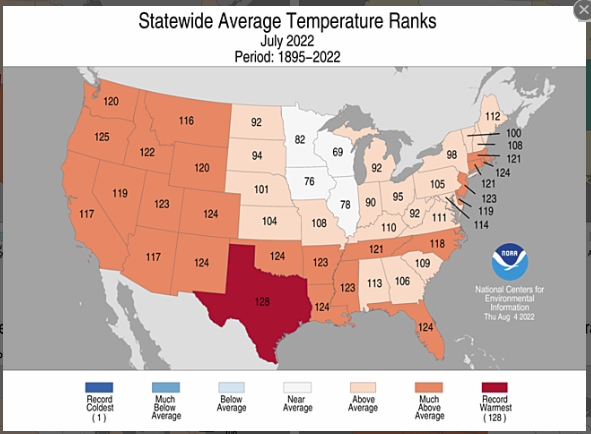
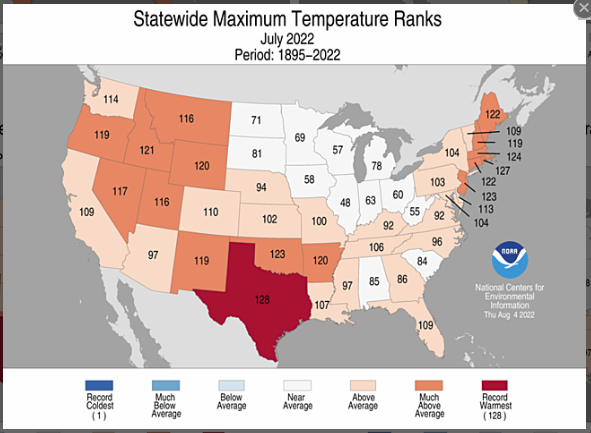
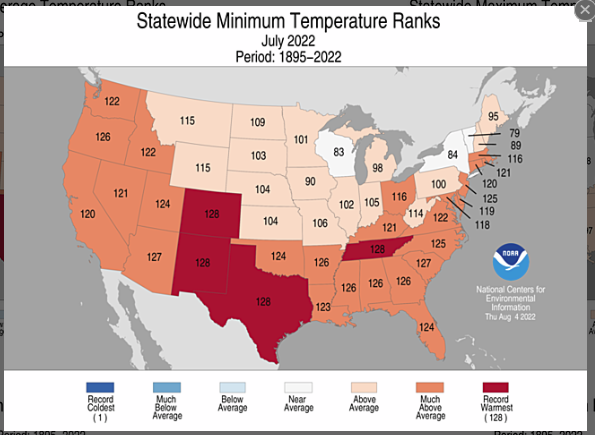
Looking at July and back to June 2022 and the YTD State Rankings.
The state rankings show where for each state, their June and July weather on the left and their year-to-date (YTD) weather on the right fits within their 128-year modern set of data which is considered the most reliable. They are color-coded to make them easier to read.
The images are pretty small so I am showing the July rankings separately
–
looking Ahead`
Intermediate-Term
–
–
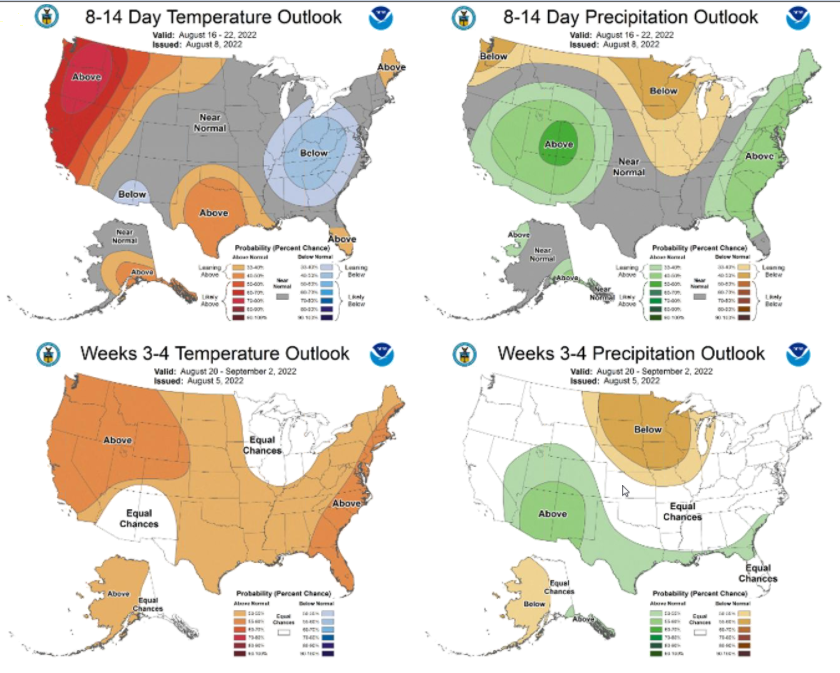
| You can see both the wet areas and the overall higher than usual temperatures. Just two time periods are shown in this graphic: Days 8 – 14 and Weeks 3- 4. We will publish updated graphics on Friday and our Daily report always has links to get updates. For the purposes of this article, the above is useful and is in a convenient format. |
Seasonal
_
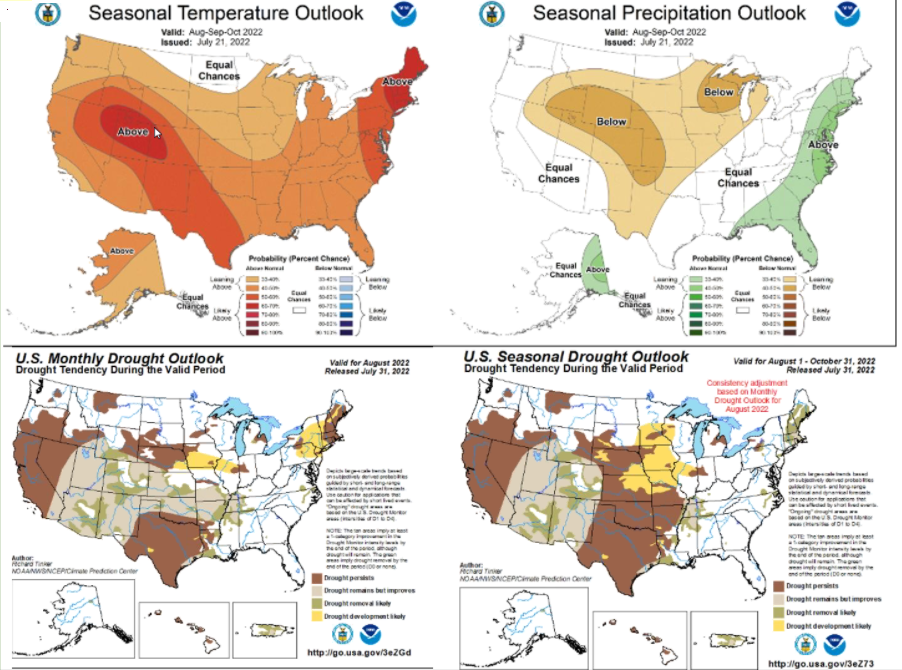
| Here we look out beyond August for an additional two months. The bottom two graphics are good. On shows the drought outlook for August, the other for the three-month period so you can see some relief in August which is reduced in the subsequent two months with drought developing in other areas namely the central and northern Great Plains. |


