Here is what we are paying attention to this evening and the next 48 hours from this evening’s NWS Forecast.
...Monsoonal Rains to continue across much of the Southwest U.S. as heavy
rain and possibly severe thunderstorms move across the Great Lakes/Midwest
during the next couple of days...

...Some relief from the prolonged heatwave across the Northwest but record
high temperatures are possible on Thursday over the northern High Plains
and parts of the Northeast...

...Fire Weather Threat to continue from the Northwest into the northern
High Plains..
Continuation of the NWS Short Range Forecast (It is updated twice a day and these updates can be found here.
A warm upper-level ridge that has been dominating the weather pattern in
the western to central U.S. is forecast to shift eastward as a cool upper
trough reaches the Pacific Northwest.  This change in the upper-level
pattern will break the prolonged heat wave over the Pacific Northwest by
Thursday as cool air will be ushered into the region behind a cold front.
Meanwhile, more triple-digit heat is expected across much of the central
and southern Plains where the upper ridge will remain in place.  For the
northern Plains, triple-digit heat today will be replaced by cooler air
from southern Canada on Wednesday before the resumption of triple-digit
heat on Thursday.   In the meantime, anomalous heat is forecast to reach
the northern Mid-Atlantic into New England by Thursday with record high
temperatures possible as afternoon readings reach into the 95-100 degree
range behind a warm front.

In terms of rainfall prospects, moisture will continue to linger in place
across much of the Intermountain West through the middle of the week and
also the Desert Southwest, although the convective activity should be more
scattered in nature compared to the widespread storms and flooding that
has been observed over the past few days.  A corridor of heavy showers and
possibly severe storms is expected to organize late Wednesday and into
early Thursday across portions of the Midwest and the Great Lakes ahead of
a cold front, with some potential of 1-2 inch rainfall totals.  Heavy rain
threat currently across portions of the Midwest/Ohio Valley should
gradually diminish by this evening.

Fire weather concerns will also continue to make headlines across much of
the interior northwestern U.S. and extending eastward across Montana and
western North Dakota.  A combination of gusty winds and low humidities
will increase the potential for wildfires, and some high based
thunderstorms with limited rainfall and cloud-to-ground lightning may also
be cause for concern on Tuesday.  The fire weather risk is likely to
persist going into Wednesday as well across portions of the interior
Pacific Northwest and central Montana.
Maps that relate the forecast to geography can be found by clicking Here for Day 1 and Here for Day 2.
Here is a 60-hour animated forecast map that shows how the short-term forecast is expected to play out.
If it needs to be updated click here.
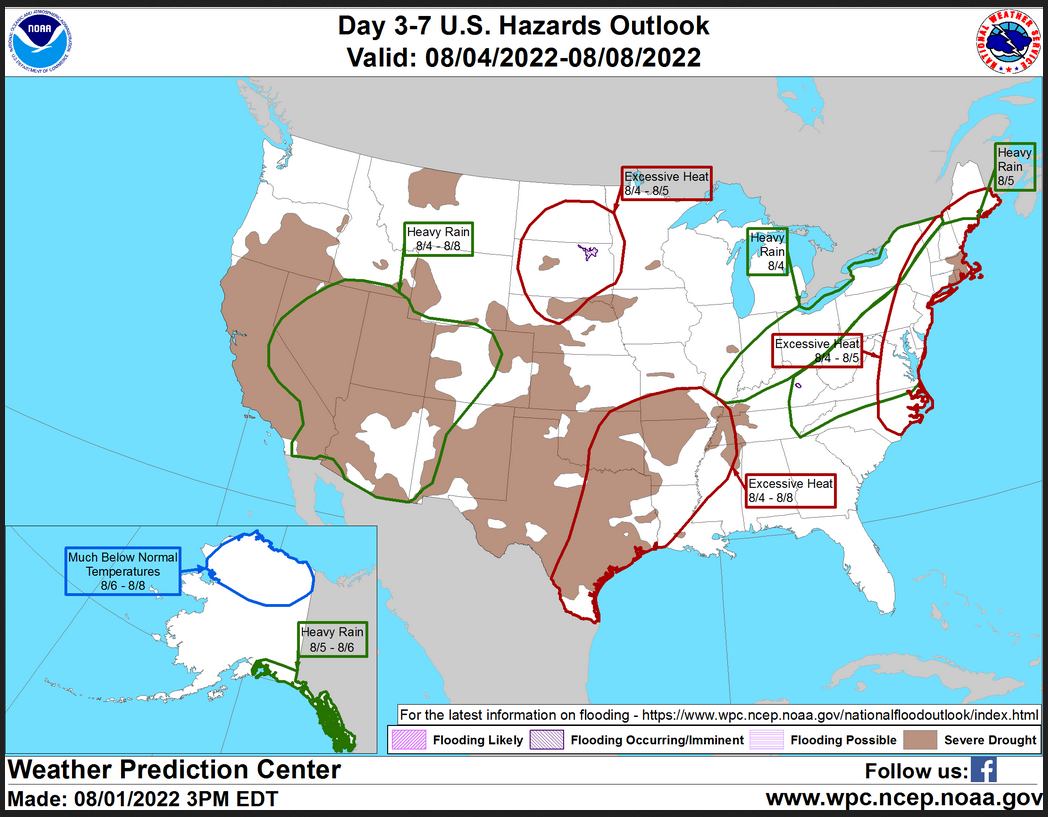
HAZARDS OUTLOOKS
Click here for the latest complete Day 3 -7 Hazards forecast which updates only on weekdays. Once a week probably Monday or Tuesday I will update the images. I provided the link for readers to get daily updates on weekdays. Use your own judgment to decide if you need to update these images.
Worldwide Tropical Forecast
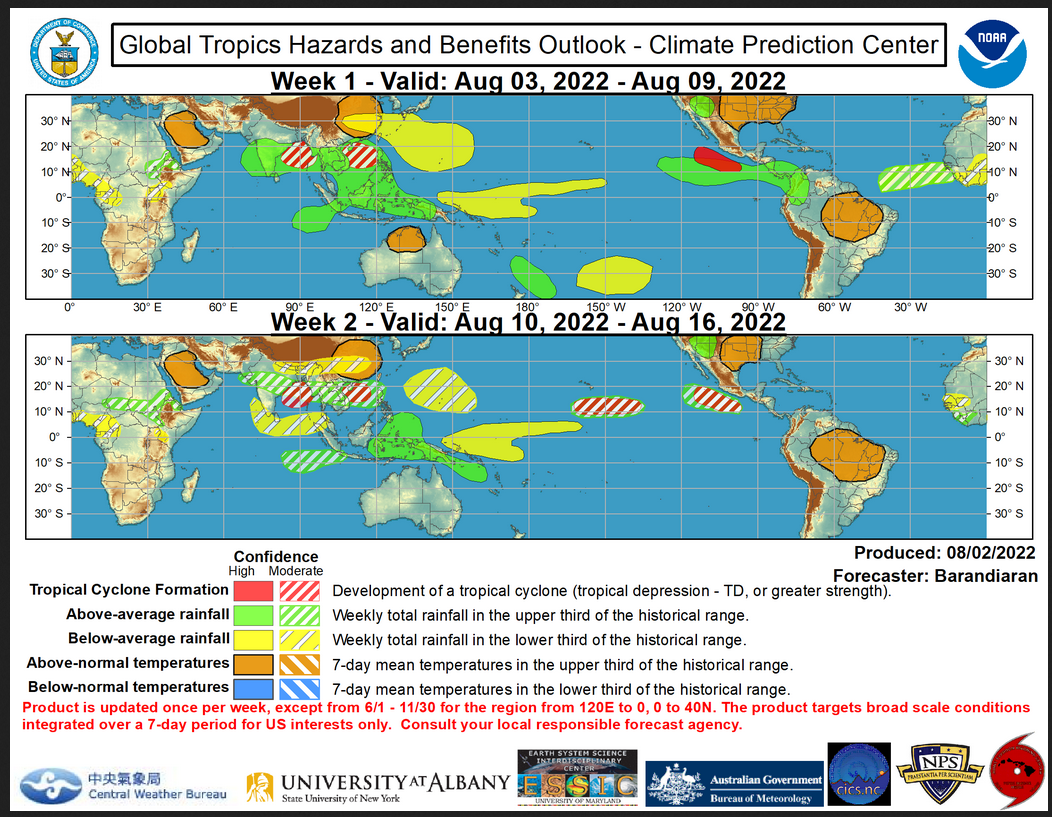
(This graphic updates on Tuesdays) If it has not been updated, you can get the update by clicking here
Detailed Maps and Reports for the Western Atlantic and the Pacific Oceans
Below are three maps that summarize the situation for the Atlantic, Eastern and Central Pacific. Additional information can be accessed by clicking HERE
First the Atlantic
Click to view the forecast map and have access to additional information https://www.nhc.noaa.gov/gtwo.php?basin=atlc&fdays=5
Then Eastern Pacific
Click to view the forecast map and have access to additional information https://www.nhc.noaa.gov/gtwo.php?basin=epac&fdays=5
Then Central Pacific
Click to view the forecast map and have access to additional information https://www.nhc.noaa.gov/gtwo.php?basin=cpac&fdays=5
And the Western Pacific
Click to view the forecast map and have access to additional information https://www.metoc.navy.mil/jtwc/jtwc.html
Some Intermediate-Term Outlooks
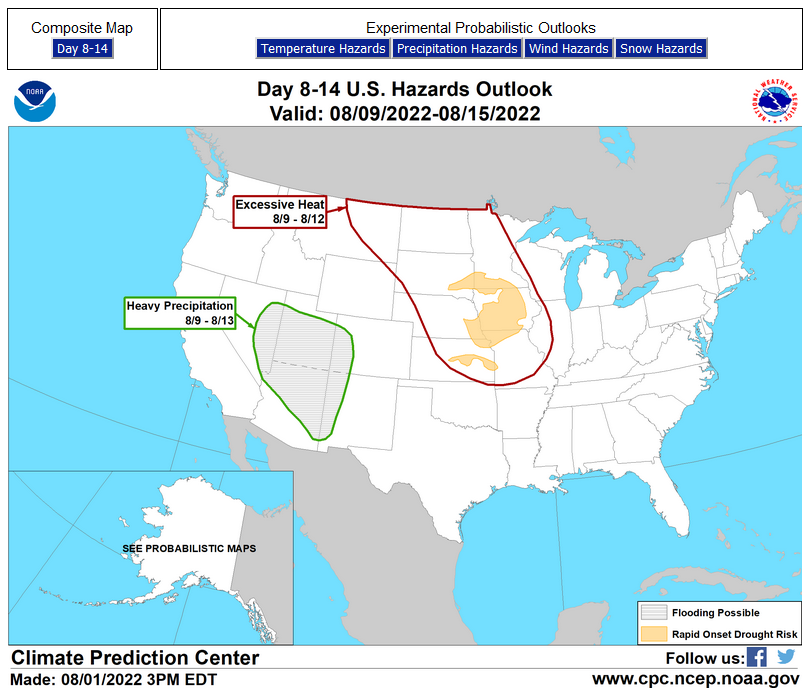
Links to “Outlook” maps and discussions for three time periods. Days 6 – 10, Days 8 – 14, and Weeks 3 and 4. An outlook differs from a forecast based on how NOAA uses these terms in that an “outlook” presents information from deviation from normal and the likelihood of these deviations.
You have to click on the links because they do not update automatically and I do not want to have stale images in the article. But it is not difficult to click on a link and you get a large image plus a discussion. On Fridays in a separate article, we will show the images and provide a link in this article that article. But remember what you will see is the images as of Friday. But here you can get the current images simply by clicking on them. Then hit the return arrow at the upper left of your screen to return to the article. You will not find this information easily anywhere else.

Right now you can find these maps here (We show them every Friday there but you can click above and find them).
Forecast for Day 6 (Currently Set for Day 6 but the reader can change that)
World Weather Forecast produced by the Australian Bureau of Meteorology. Unfortunately, I do not know how to extract the control panel and embed it into my report so that you could use the tool within my report. But if you visit it Click Her e and you will be able to use the tool to view temperature or many other things for THE WORLD. It can forecast out for a week. Pretty cool. Return to this report by using the “Back Arrow” usually found top left corner of your screen to the left of the URL Box. It may require hitting it a few times depending on how deep you are into the BOM tool. Below are the current worldwide precipitation and air pressure forecasts for six days out. They will not auto-update and right now are current for Day 6. If you want the forecast for a different day Click Here I will try to update this map each day but you have the link so you can access the dashboard and get a wide variety of forecasts.
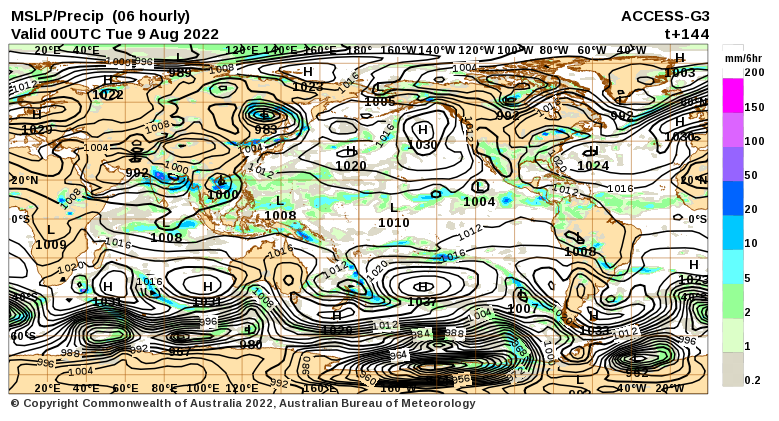
I mostly rely on the reader to interpret world maps. For this map, areas of expected precipitation for the date and time shown are clearly shown.
The number of High-Pressure systems shown is called the Wave Number. Maybe I will discuss WN someday. But it shows how many Rossby Waves there are around the World. Sometimes they are hard to count. Counting Low-Pressure systems should provide the same WN. Rossby Waves are the way the temperature distribution of the Planet remains in balance. It is basically the science of fluid dynamics. It can be very helpful in predicting the movement of weather patterns.
Month to Date Information
Month to date Temperature can be found at https://hprcc.unl.edu/products/maps/acis/MonthTDeptUS.png
Month to date Precipitation can be found at https://hprcc.unl.e d u/products/maps/acis/MonthPNormUS.png
