Short-term improvement in drought for August.
At the end of every month, NOAA updates their Outlook for the following month which in this case is August. They also issue a Drought Outlook for the following month. We are reporting on that tonight.
There have been some significant changes in the Outlook for August and these are addressed in the NOAA Discussion so it is well worth reading. We highlighted some of the important changes within the NOAA Discussion.
Of significant interest is the Drought Outlook for August. It is a big improvement but unfortunately, it probably is a one-month event. We have also included four months of Wildland Fire Potential Outlooks and also a map showing the year-to-date precipitation in the West. We also included a Monsoon related Podcast that is very interesting.
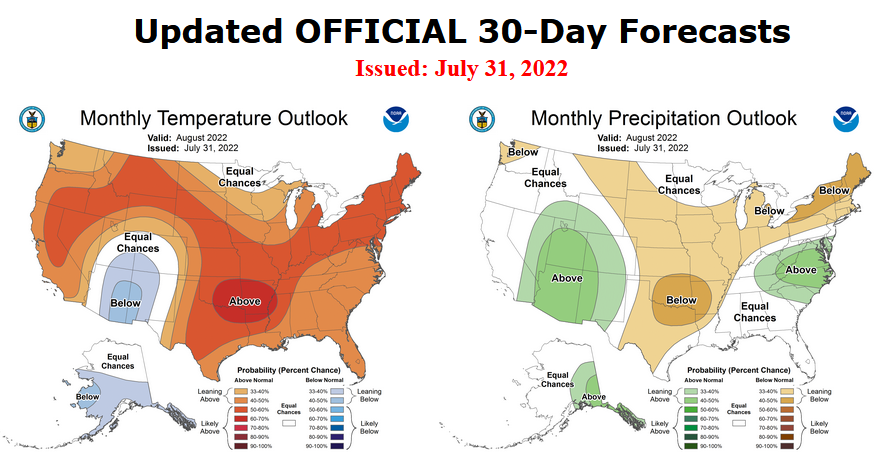
Here is the updated Outlook for August
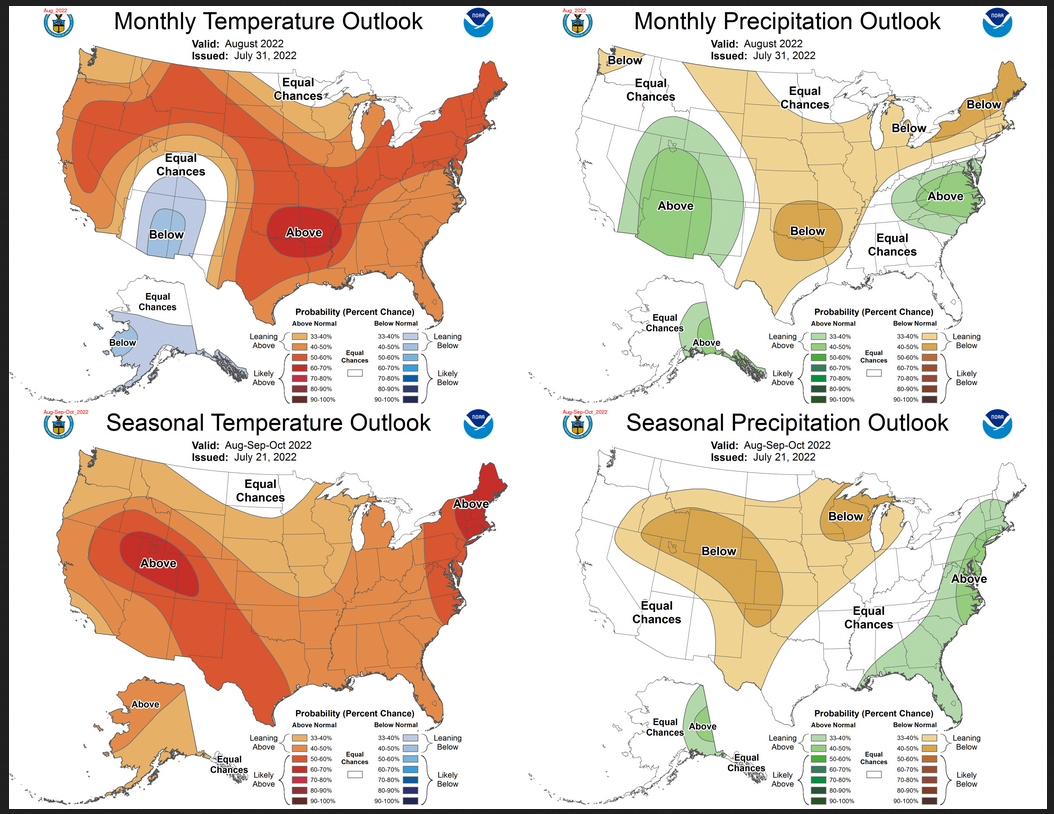
Combination of the Updated Outlook for August and Three-Month Outlook
–
| Most of the difference has to do with the North American Monsoon which for August makes the area most impacted by the Monsoon wetter and cooler than normal. The three-month map suggests that the above normal characteristic of this Monsoon will not extend beyond August. You can also see the shift in the focus of the extreme heat. |
There are some reversals in the new forecast for August relative to the three-month forecast. By a reversal we mean a change from wet to dry or warm to cool. Most of the changes are from Wet/dry/warm/cool to neutral or the reverse.
| For both temperature and precipitation, if you assume the colors in the maps are assigned correctly, it is a simple algebra equation to solve the month two/three anomaly probability for a given location = (3XThree-Month Probability – Month One Probability)/2*. So you can derive the month two/three outlook this way. You can do that calculation easily for where you live or for the entire map. |
It is important to remember that the August Outlook was updated on July 31 and the three-month Outlook was issued on July 21. So we always wonder if a change in the one-month outlook suggests that the three-month outlook would need to also be adjusted. I think that in this case, the answer is a qualified“no”. The stronger than expected Monsoon could slightly impact the three-month outlook but only slightly.
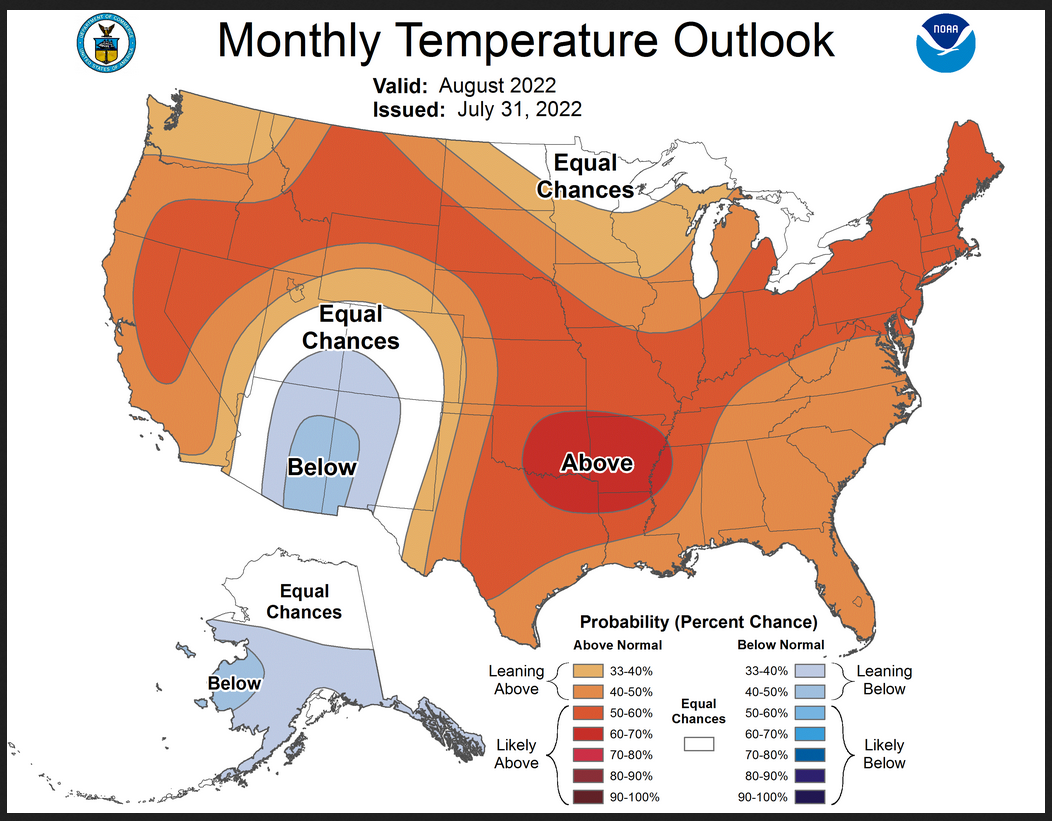
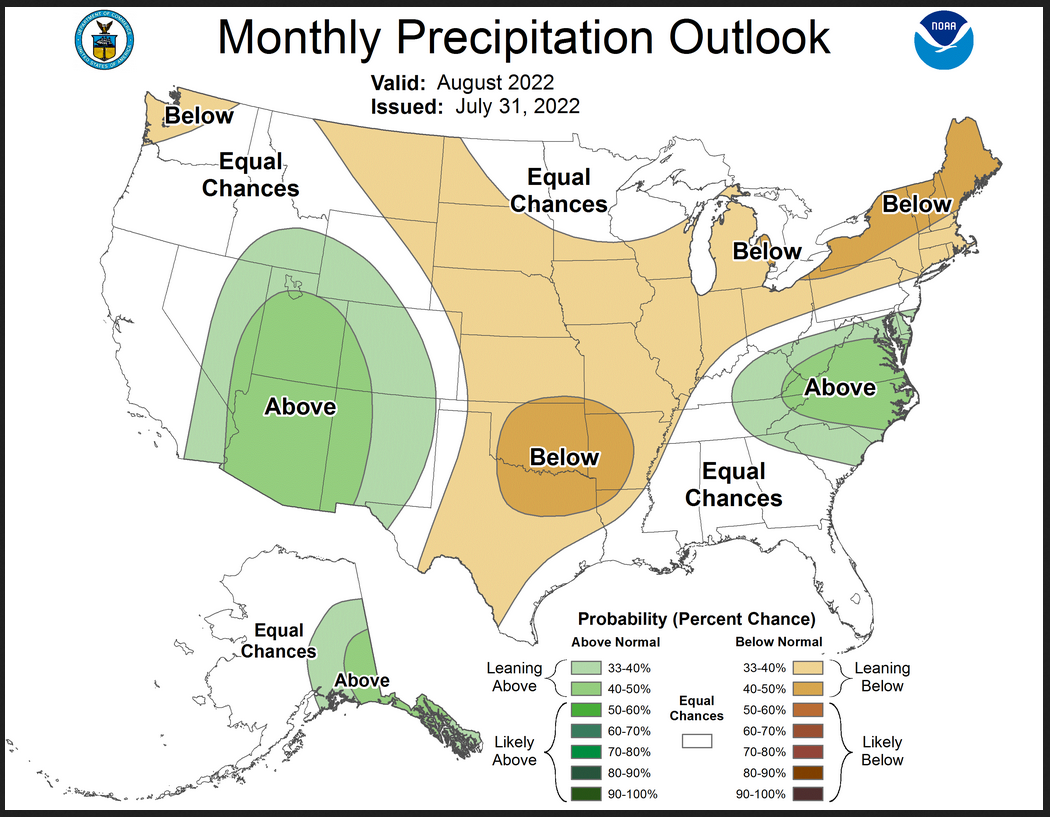
Here are larger versions of the Temperature and Precipitation Outlook maps
NOAA Discussion (I have shown certain important points in bold type)
30-DAY OUTLOOK DISCUSSION FOR August 2022
The August 2022 Temperature and Precipitation Outlooks are updated considering current active La Niña conditions, Weather Prediction Center (WPC) Outlooks for week 1, Climate Prediction Center (CPC) Extended Range and Week 3-4 Outlooks, dynamical model guidance for week 2, weeks 3-4, and the month of August, and current soil moisture conditions. The atmospheric teleconnection pattern remains consistent with that expected during August La Niña events, and recent weekly sea surface temperature (SST) departures in the Niño 3.4 region reached -0.7 degrees C. The Madden Julian Oscillation (MJO) signal weakened through mid-July due to destructive interference from La Niña, and recent Realtime Multivariate MJO (RMM) forecasts from the GEFS and ECMWF depict an inactive MJO signal. Thus, La Niña remains the primary remote influence on the August 2022 Temperature and Precipitation Outlooks.
The previous mid-month August 2022 Temperature Outlook favored enhanced above normal temperature probabilities over most of the contiguous U.S. (CONUS), and a slight tilt toward above normal temperature probabilities over the North Slope of Alaska. Short term 6-10 and 8-14 day consolidated dynamical model forecasts as well as recent CFSv2 and GEFS monthly temperature forecasts now favor enhanced probabilities of cooler temperatures over the Desert Southwest under a robust monsoon signal. Forecasted ridging over the northern CONUS in the beginning of August is expected to persist through the Week 3-4 period given dynamical model forecasts of 500 hPa heights. This forecasted ridging supports enhanced probability of above normal temperatures over the northern CONUS. A weak tilt toward above normal temperature probability is favored for the Pacific Northwest, in contrast to the area of Equal-Chances (EC) of above, near, and below normal temperature previously indicated over the Pacific Northwest in the mid-month outlook. The area of EC previously indicated for parts of eastern Montana and western North Dakota in the mid-month Outlook is shifted eastward to the Upper Mississippi Valley and parts of the Northern Great Lakes following dynamical model guidance from CFSv2, as well as anomalously high soil moisture. Consolidated temperature forecasts for the beginning of August along with monthly CFSv2 forecasts support strengthening of above normal temperature probabilities over the mid-Atlantic (40 to 50 percent). Elevated probability of above normal temperature (60 to 70 percent) is maintained over parts of the Southern Plains and Lower Mississippi Valley in the updated August 2022 Outlook, but is shifted northward given monthly CFSv2 forecasts that favor weaker probabilities along the Gulf Coast. 6-10 and 8-14 day and week 3-4 dynamical model forecasts of 500 hPa heights depict troughing over Alaska and below normal temperature probabilities. Though in contrast to the most recent CFSv2 monthly temperature forecast which favors EC over Alaska, the forecasted persistent troughing supports a tilt toward below normal temperature probabilities over southern Alaska. Anomalously high sea ice off the northern coast of Alaska supports removal of the weak tilt toward positive temperatures previously indicated, and EC is now favored for the North Slope of Alaska in the updated August 2022 Outlook.
The updated August 2022 Precipitation Outlook favors a broad area of below normal precipitation probabilities for parts of the northern, central, and northeastern CONUS. EC was previously indicated in the mid-month outlook for the Pacific Northwest and Northeast, but there is consistent below normal precipitation forecasted for early August and in GEFSv12 Week 3-4 forecasts, as well as elevated probability of below normal precipitation in recent CFSv2 monthly forecasts. This consistency along with the below normal CFSv2 forecast supports a tilt toward below normal precipitation over the Pacific Northwest (33 to 40 percent) and parts of the northeast (40 to 50 percent). Enhanced probability of below normal precipitation (40 to 50 percent) is favored over parts of the Southern Plains and Lower Mississippi Valley in the updated August 2022 Outlook following forecasted elevated probability of above normal temperatures, anomalously low soil moisture, and a confident forecast of below normal monthly precipitation from CFSv2. The area of EC previously indicated for parts of eastern Montana and western North Dakota in the mid-month Outlook is shifted eastward to the Upper Mississippi Valley and parts of the Northern Great Lakes following dynamical model guidance from CFSv2, as well as anomalously high soil moisture, similarly to the updated Temperature Outlook. EC is also indicated along the Gulf Coast and Florida given weak or conflicting signals from available guidance, and an area of enhanced probability of above normal precipitation is maintained in the mid-Atlantic. Short-term, subseasonal, and recent monthly guidance from CFSv2 and GEFS favor probability of above normal rainfall in a large area of the Desert Southwest related to a robust forecasted Southwest Monsoon. Enhanced precipitation may be expected in Southern California due to chance of monsoon pulses but probability remains weak (33 to 40 percent). Finally, elevated probability of above normal precipitation is maintained over eastern Alaska, but recent guidance suggests a southward shift and more coverage of the Alaska Panhandle.
Drought Outlook
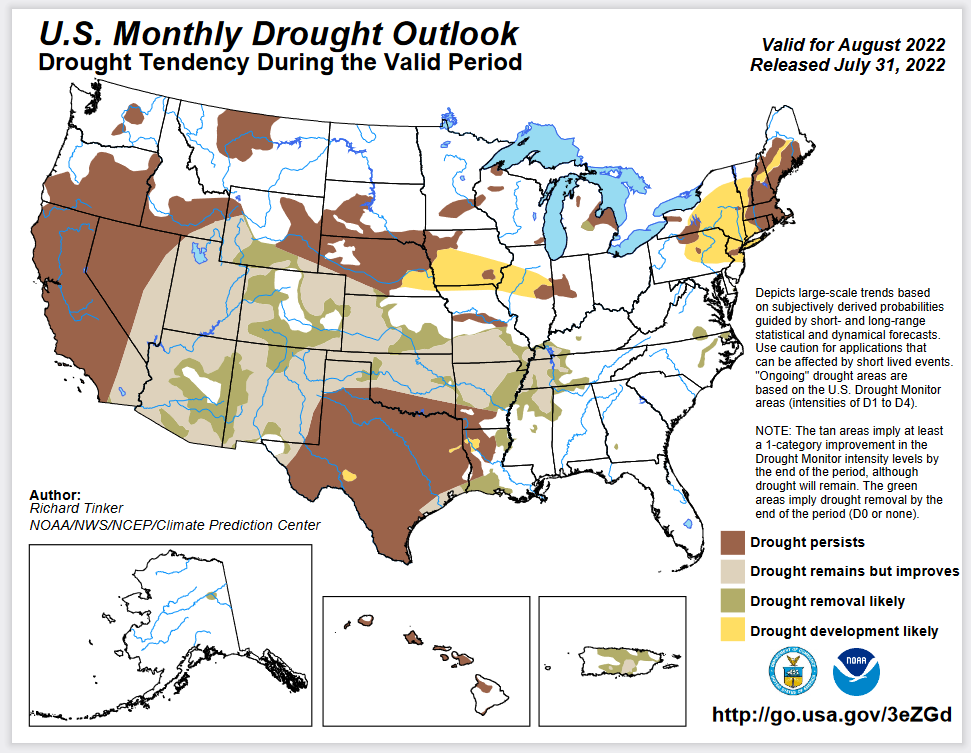
Here is the newly issued Drought Outlook for August 2022
–
| You can see where the Monsoon will improve the drought situation and where drought development is likely. The summary and detailed discussions that accompany this graphic can be accessed here https://www.cpc.ncep.noaa.gov/products/expert_assessment/mdo_summary.php |
Possible Tropical Events
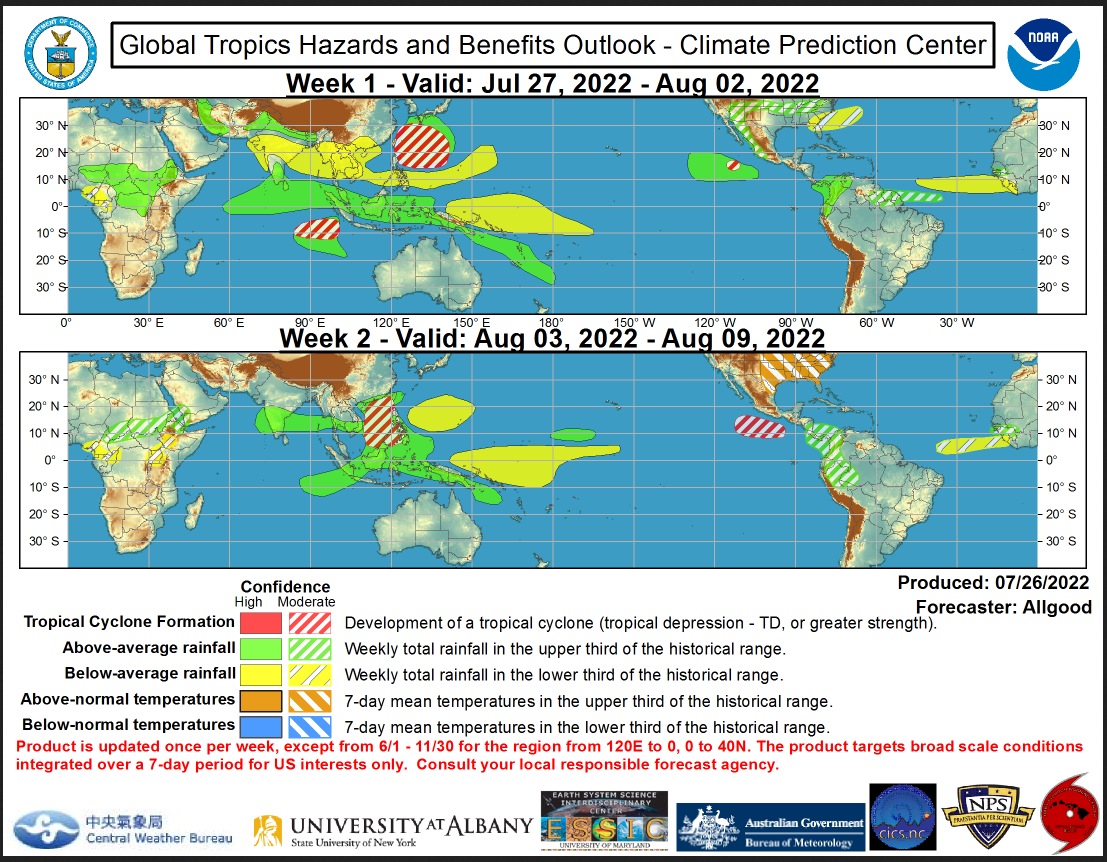
Worldwide Tropical Forecast
–
| Notice the above-normal temperatures predicted for the area bordering the Gulf of Mexico. When this graphic updates the situation may look different. You can track this in the Daily 48-hour and Intermediate-Term Outlook we publish daily. |
To update this forecast (which updates on Tuesdays) click here https://i0.wp.com/www.cpc.ncep.noaa.gov/products/precip/CWlink/ghazards/images/gth_small.png?resize=1100%2C850&ssl=1
Tracking Temperature and Precipitation as the month proceeds
Month to date Temperature can be found at https://hprcc.unl.edu/products/maps/acis/MonthTDeptUS.png
Month to date Precipitation can be found at https://hprcc.unl.edu/products/maps/acis/MonthPNormUS.png
Southwest Monsoon Update.
I am providing the links as the situation changes from day to day. Plus there are a lot of maps and graphics to look at so this would slow down your computer and not everyone is interested.
Arizona
Just click on this link https://cals.arizona.edu/climate/misc/monsoon/az_monsoon.html
New Mexico
Just click on this link https://cals.arizona.edu/climate/misc/monsoon/nm_monsoon.html
Overall Southwest
Just click on this link https://cals.arizona.edu/climate/misc/SWMonsoonMaps/current/swus_monsoon.html
Some might find this interesting. Click to hear the podcast. You will have to click twice. Once to get to the dashboard and then again to start the podcast

Fire Outlook: Current and Forecast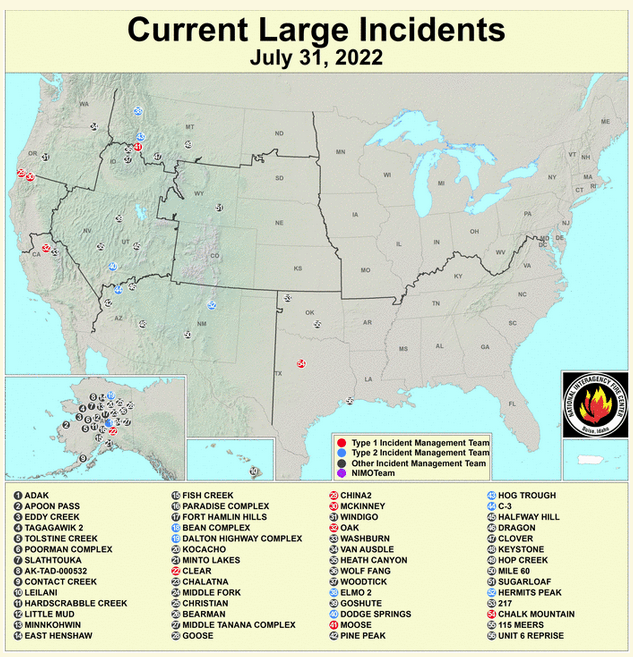

Updates to the major fire situation can be found by clicking here https://fsapps.nwcg.gov/afm/index.php
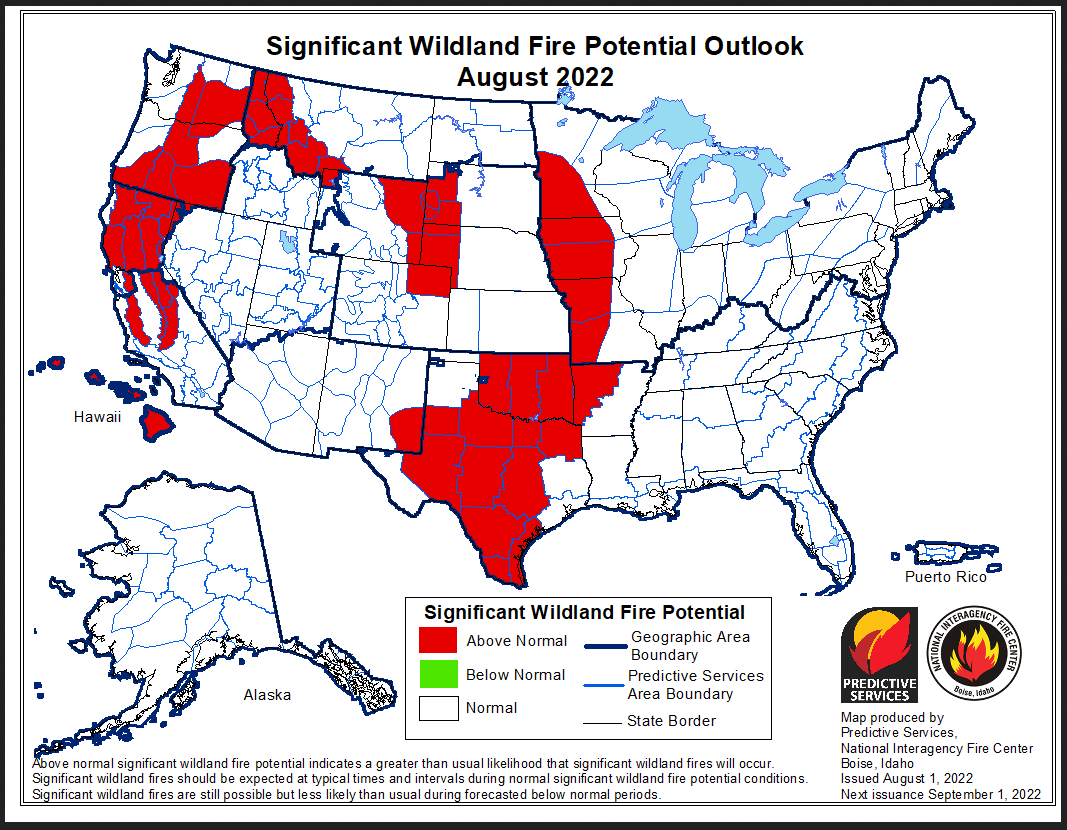
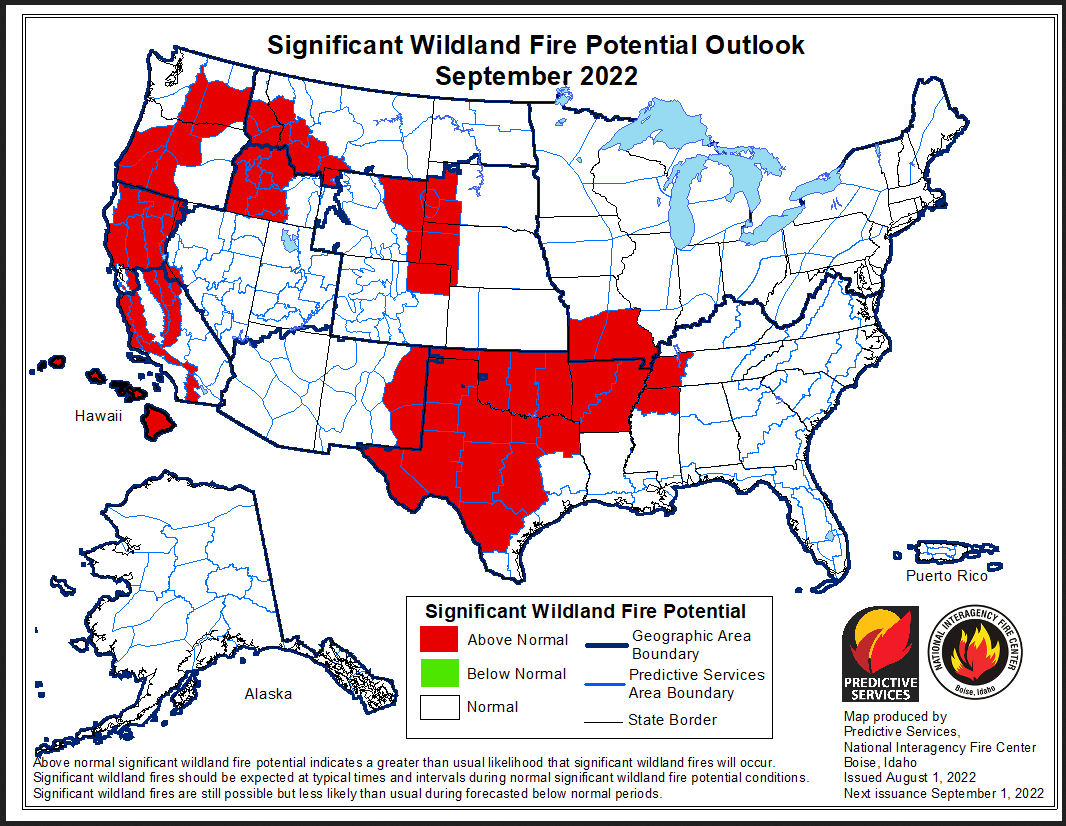
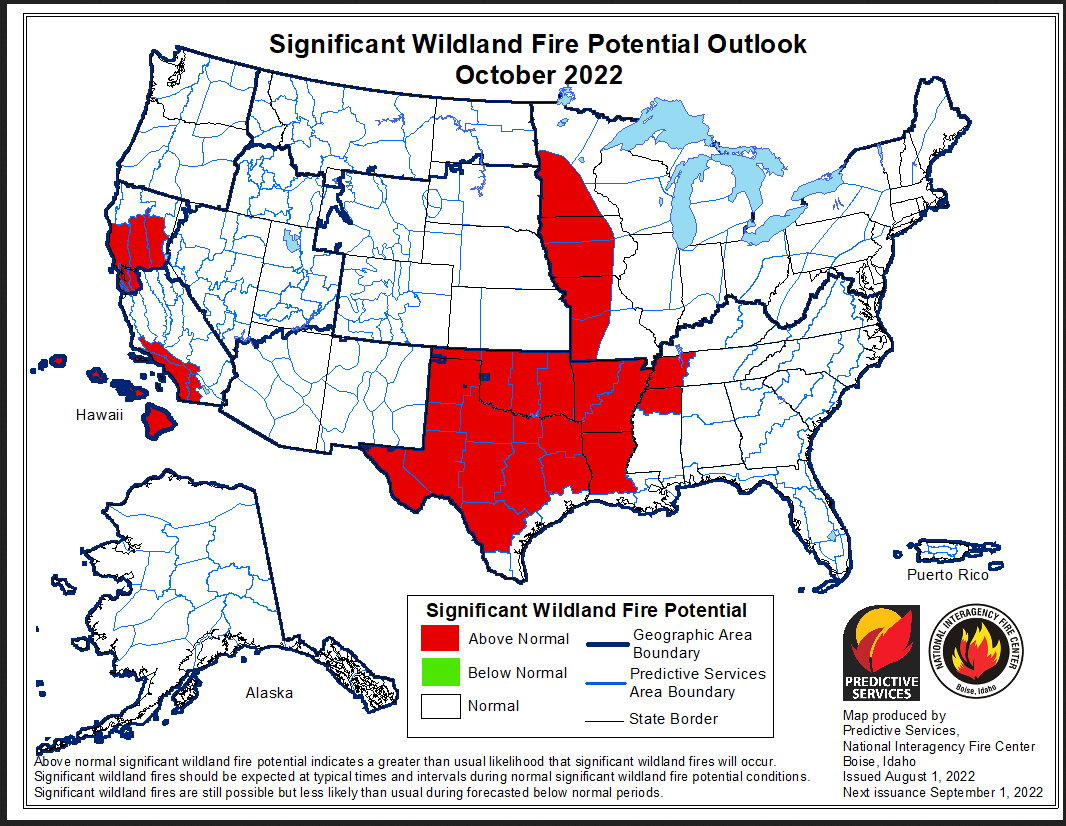
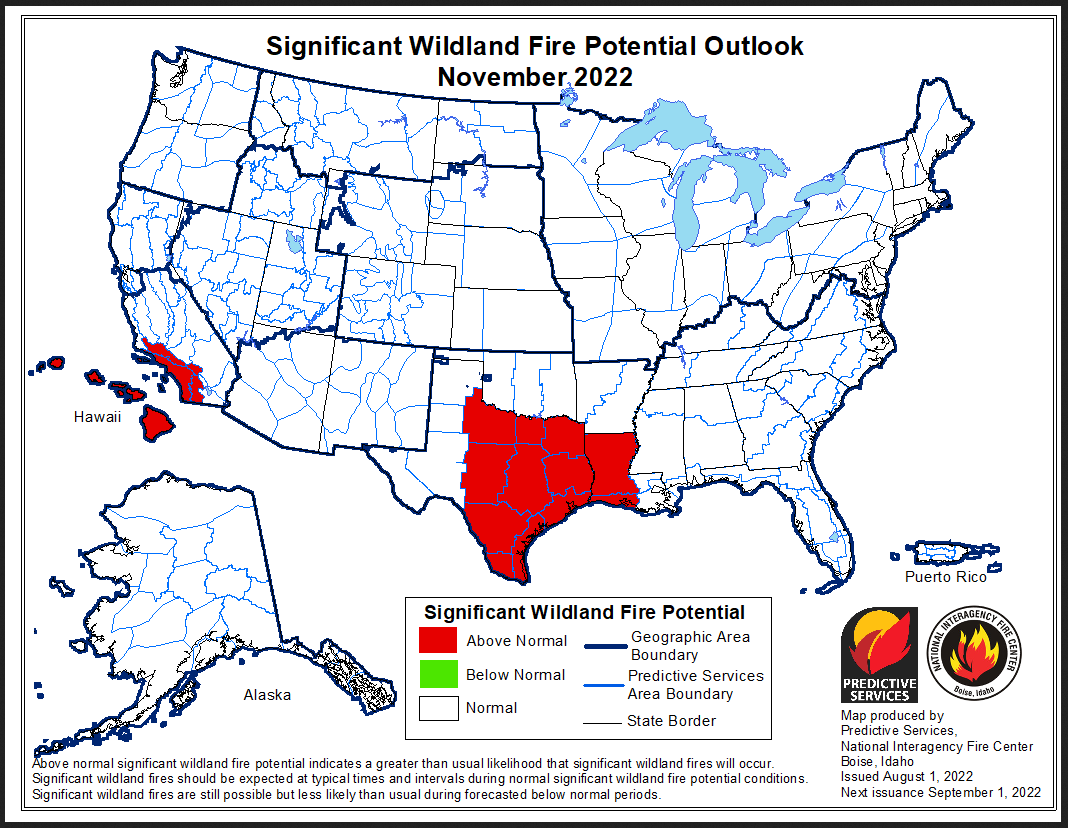
What you are seeing is the August 1 update. There will be a new update on September 1. If you are looking at this article at that time you can update these graphics by clicking here.
Water-Year to Date Precipitation
Water year-to-date precipitation can be found by clicking here https://www.nrcs.usda.gov/wps/portal/wcc/home/ I provided a map current as of July 31, 2022
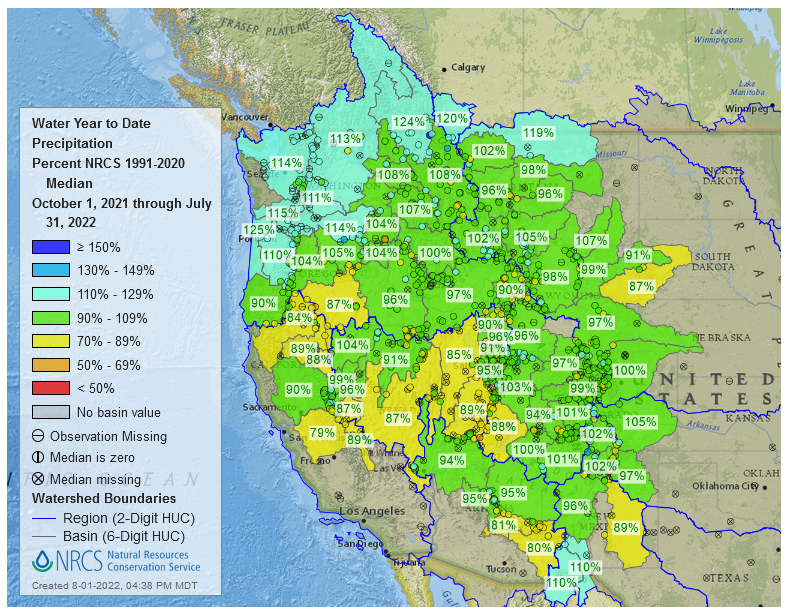
–
| I have some questions about the above graphic. It seems too wet. Compare it to the state rankings we published recently which you can access at https://econcurrents.com/2022/07/30/july-29-2022-looking-ahead-28-days-plus-a-review-of-state-temperature-and-precipitation-rankings/. There are four additional months included in this graphic. So I have decided to leave it in the article. |
| I hope you found this article interesting and useful |