Here is what we are paying attention to this evening and the next 48 hours from this evening’s NWS Forecast.
...Heavy rainfall will continue to support broad concerns for flash
flooding from the Southwest U.S. east to the Middle Mississippi Valley,
the Tennessee Valley, and the southern Mid-Atlantic region through
Monday...

...Some severe thunderstorms will be possible across the Upper Midwest
today...

...Excessive heat persists over the Pacific Northwest and the northern
Great Basin through the weekend...
Continuation of the NWS Short Range Forecast (It is updated twice a day and these updates can be found here.
Moisture will remain well entrenched for the remainder of the weekend for
large swaths of the southern U.S. This will be particularly the case from
the Southwest eastward toward the Lower and Middle Mississippi Valley, the
Tennessee Valley, and the southern Mid-Atlantic region. For the Southwest
U.S., this moisture which is monsoon-driven will couple with daytime
heating, upslope flow locally over the higher terrain, and also some weak
energy aloft for broken areas of heavy showers and thunderstorms. Very
heavy rainfall rates are expected locally, and this will drive concerns
for flash flooding with an emphasis on any of the more sensitive burn
areas, slot canyons and normally dry washes which can fill up suddenly
from heavy rainfall. The Weather Prediction Center has highlighted a large
area of the Southwest in a Slight Risk of excessive rainfall through the
rest of the weekend to address the ongoing active monsoon season across
this region. The expanse of clouds and the threat of rain should keep
temperatures also locally cooler and a bit below normal.

Meanwhile, for areas off to the east, there will be a very slow-moving
front draped generally west to east from the Southern Plains east to the
southern Mid-Atlantic region through Sunday which will act as a regional
focus for areas of heavy showers and thunderstorms. This will especially
be the case as multiple waves of weak low pressure advance east along the
front. Given the amount of moisture that will be pooled along the front,
very heavy rainfall rates will be likely, and there will be notable
concerns for areas of flash flooding which include recently hard hit areas
of the Tennessee Valley and southern Appalachians. Locally a few inches of
additional rain are forecast and the Weather Prediction Center has
depicted a broad Slight Risk of excessive rainfall in the vicinity of this
frontal zone to address the anticipated heavy rainfall. Regarding the
temperatures, just like for the Southwest U.S., the expanse of clouds and
rain will tend to keep temperatures cooler and locally below normal. This
will especially be the case from the Mid-South to the Central and Southern
Appalachians. Showers and thunderstorms likely to develop across the
interior Northeast and Southeast Monday night into Tuesday.

Elsewhere, a cold front will be advancing east across the Northern Plains
and into the Upper Midwest today, which will bring a threat for some
scattered showers and thunderstorms. A few of the thunderstorms may be
severe, and the Storm Prediction Center has depicted a Slight Risk of
severe weather for parts of Minnesota and western Wisconsin given a threat
for some large hail and damaging winds. This front will bring some briefly
cooler temperatures to round out the weekend for parts of mainly North
Dakota and the Upper Midwest.

Excessive and record-setting heat is again expected to continue for the
Pacific Northwest through today as daytime highs reach well over 100
degrees and nighttime lows drop only down into the upper 60s to low 70s.
Several record high temperatures are likely to be set and there are
Excessive Heat Warnings and Heat Advisories in effect for a large area of
the Pacific Northwest and extending east into the northern Great Basin.
The strong ridge of high pressure aloft that is responsible for this heat
is expected to actually strengthen and expand eastward somewhat heading
into next week which will allow for the heat to gradually rebuild farther
east across the Central and Northern Plains.
Maps that relate the forecast to geography can be found by clicking Here for Day 1 and Here for Day 2.
Here is a 60-hour animated forecast map that shows how the short-term forecast is expected to play out.
If it needs to be updated click here.
HAZARDS OUTLOOKS
Click here for the latest complete Day 3 -7 Hazards forecast which updates only on weekdays. Once a week probably Monday or Tuesday I will update the images. I provided the link for reads to get daily updates on weekdays. Use your own judgment to decide if you need to update these images.


Worldwide Tropical Forecast
(This graphic updates on Tuesdays) If it has not been updated, you can get the update by clicking he re
Detailed Maps and Reports for the Western Atlantic and the Pacific Oceans
Below are three maps that summarize the situation for the Atlantic, Eastern and Central Pacific. Additional information can be accessed by clicking HERE
First the Atlantic
Click to view the forecast map and have access to additional information https://www.nhc.noaa.gov/gtwo.php?basin=atlc&fdays=5
Then Eastern Pacific
Click to view the forecast map and have access to additional information https://www.nhc.noaa.gov/gtwo.php?basin=epac&fdays=5
Then Central Pacific
Click to view the forecast map and have access to additional information https://www.nhc.noaa.gov/gtwo.php?basin=cpac&fdays=5
And the Western Pacific
Click to view the forecast map and have access to additional information https://www.metoc.navy.mil/jtwc/jtwc.html
Some Intermediate-Term Outlooks
Links to “Outlook” maps and discussions for three time periods. Days 6 – 10, Days 8 – 14, and Weeks 3 and 4. An outlook differs from a forecast based on how NOAA uses these terms in that an “outlook” presents information from deviation from normal and the likelihood of these deviations.
You have to click on the links because they do not update automatically and I do not want to have stale images in the article. But it is not difficult to click on a link and you get a large image plus a discussion. On Fridays in a separate article, we will show the images and provide a link in this article that article. But remember what you will see is the images as of Friday. But here you can get the current images simply by clicking on them. Then hit the return arrow at the upper left of your screen to return to the article. You will not find this information easily anywhere else.

Right now you can find these maps here (We show them every Friday there but you can click above and find them).
Forecast for Day 6 (Currently Set for Day 6 but the reader can change that)
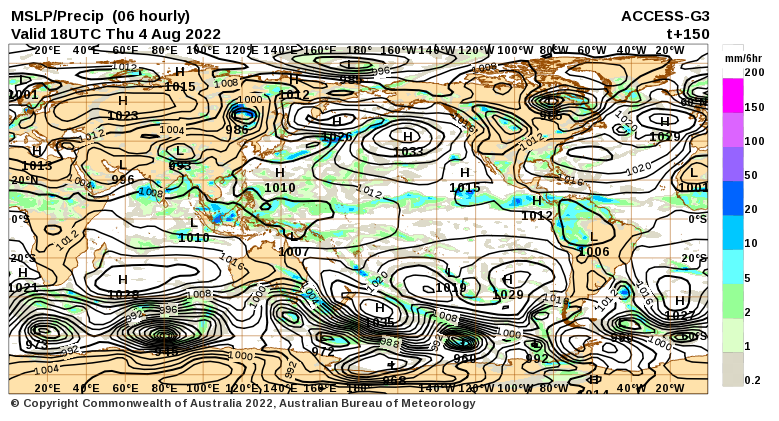
World Weather Forecast produced by the Australian Bureau of Meteorology. Unfortunately, I do not know how to extract the control panel and embed it into my report so that you could use the tool within my report. But if you visit it Click H ere and you will be able to use the tool to view temperature or many other things for THE WORLD. It can forecast out for a week. Pretty cool. Return to this report by using the “Back Arrow” usually found top left corner of your screen to the left of the URL Box. It may require hitting it a few times depending on how deep you are into the BOM tool. Below are the current worldwide precipitation and air pressure forecasts for six days out. They will not auto-update and right now are current for Day 6. If you want the forecast for a different day Click Here I will try to update this map each day but you have the link so you can access the dashboard and get a wide variety of forecasts.
I mostly rely on the reader to interpret world maps. For this map, areas of expected precipitation for the date and time shown are clearly shown.
The number of High-Pressure systems shown is called the Wave Number. Maybe I will discuss WN someday. But it shows how many Rossby Waves there are around the World. Sometimes they are hard to count. Counting Low-Pressure systems should provide the same WN. Rossby Waves are the way the temperature distribution of the Planet remains in balance. It is basically the science of fluid dynamics. It can be very helpful in predicting the movement of weather patterns.
Month to Date Information
Month to date Temperature can be found at https://hprcc.unl.edu/products/maps/acis/MonthTDeptUS.png
Month to date Precipitation can be found at https://hprcc.unl.e d u/products/maps/acis/MonthPNormUS.png