Northeast Quadrant is predicted to be Hot early in August and then the Heat shifts to the Northwest.
NOAA updates many of their weather outlooks and in many cases issues a discussion with those outlooks. On Fridays, they issue a week 3 – 4 outlook which is farther out than the typical 10-day forecast and the discussion is excellent. So we have decided to issue a weekly special report on Fridays.
When the Week 3-4 Outlook is issued, we have a 28-day view of the future. It is important to recognize that the forecasts do not always work out as predicted, but in the article there are links to obtain updated forecasts.
We have also taken a look at the state temperature and precipitation rankings for June and Year to Date (YTD). It is not a surprise that they differ.

| Announcement: We now publish a daily weather report that addresses both short-term and intermediate-term weather issues including tropical events and you can find it at econcurrents.com. To return to this article just hit the return arrow at the upper left corner on your screen. This message is mainly for future reference as this article covers most of what you need to know other than tropical events. I do not include those in this article as generally, it is not possible to predict them out to 28 days. The links to information on tropical events are in the Daily Report. |
What NOAA is predicting for the next 28 days.

We will start with the short-term – It is up to date as of today. If you look at this article after today you can click the links to update (plus you will end up with a lot of additional information)
| Temperature (Maximum Anomaly) for the next five days | Precipitation (Five days of cumulative precipitation) |
| https://www.wpc.ncep.noaa.gov/medr/me dr_mean.shtml | https://www.wpc.ncep.noaa.gov/qpf/day1-7.shtml |
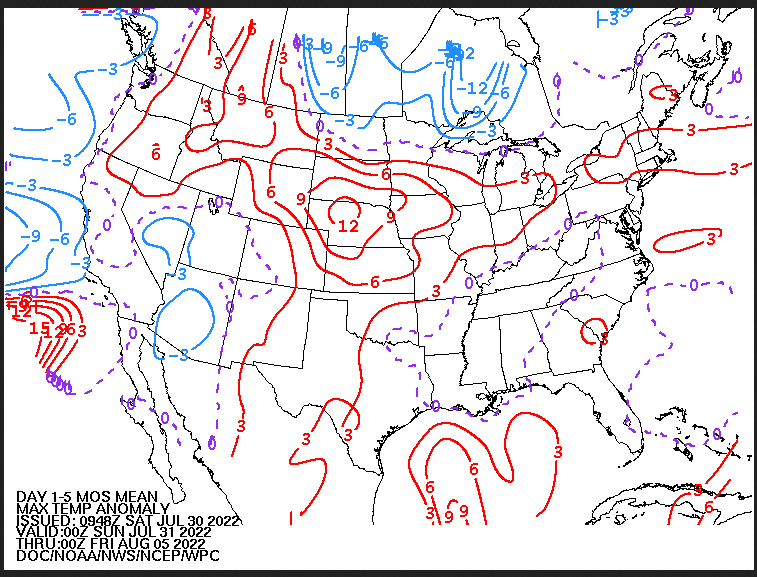
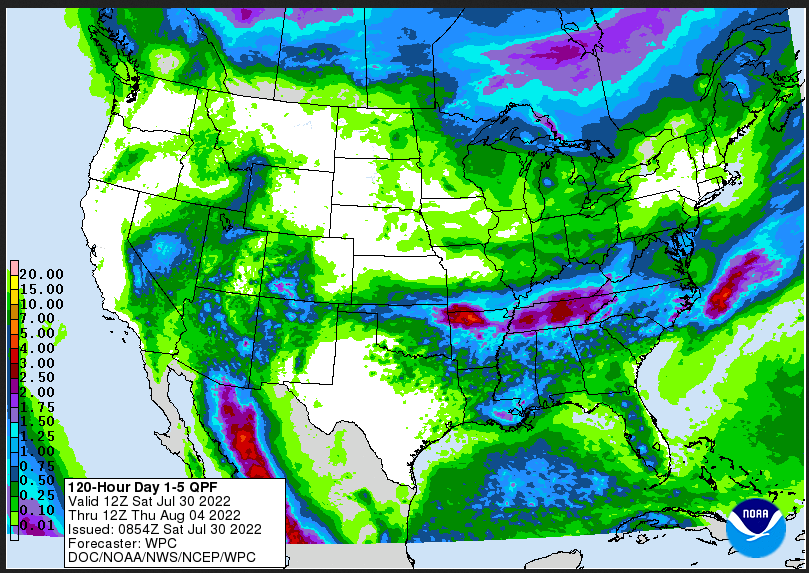
| 12 Degrees above normal in Nebraska: A lot of rain but high values only in a few areas check the color coding on the left. |
Now we look at “Outlook” maps for three time periods. Days 6 – 10, Days 8 – 14, and Weeks 3 and 4. An outlook differs from a forecast based on how NOAA uses these terms in that an “outlook” presents information as deviation from normal and the likelihood of these deviations.
I have provided the maps so you do not need to click to get them. But they do not update daily. But you can get the current images simply by clicking on the links provided. Then hit the return arrow at the upper left of your screen to return to the article. There is no need to do that right away since what is published today is up to date.
Below are the links to obtain updates and additional information.
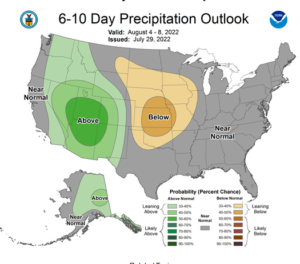
| The Monsoon is extending up to Canada and the rest is normal except for a dry area in the Central Great Plains. |
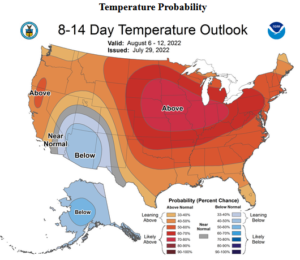
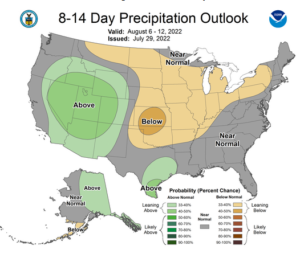
| Temperature moderates a bit and maybe there is ” Southerly flow below the 500-hPa ridge axis in the Western Gulf of Mexico” |
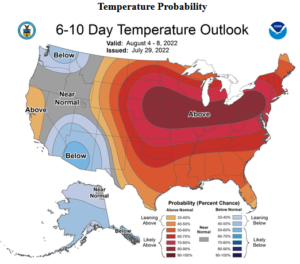
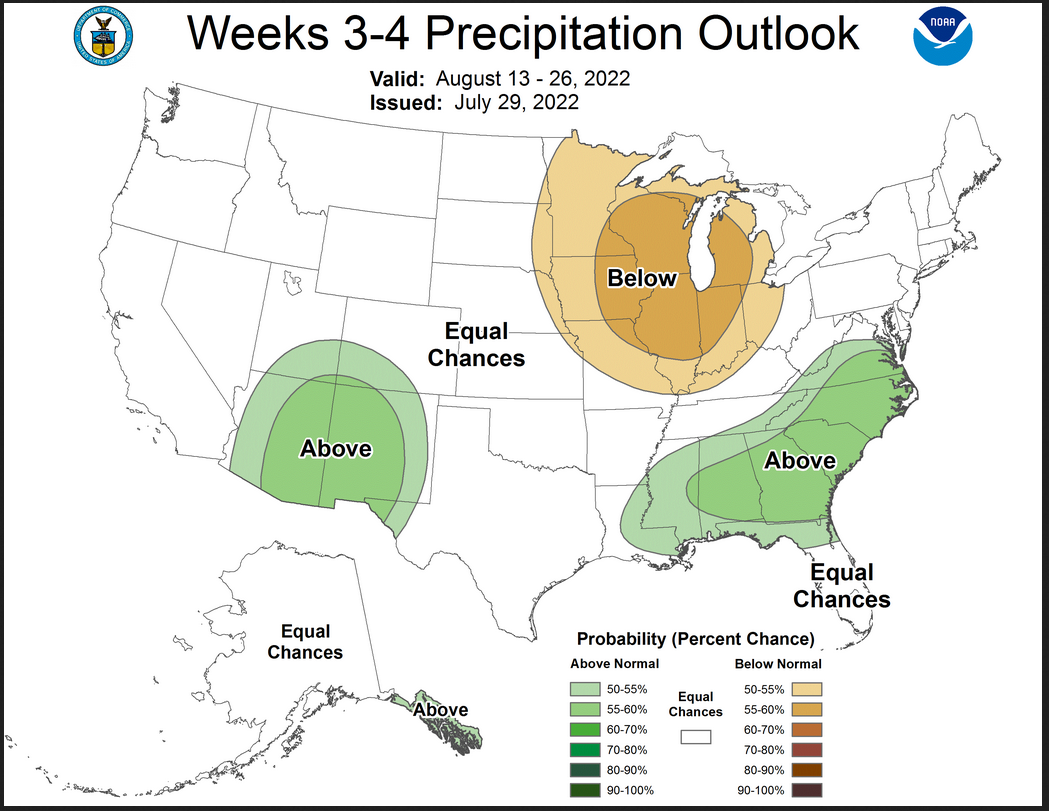
Now we address Weeks 3 and 4. This is a time frame that is very important. It is half of the 28-Day forecast period. That is why we include the discussion that accompanies the maps.
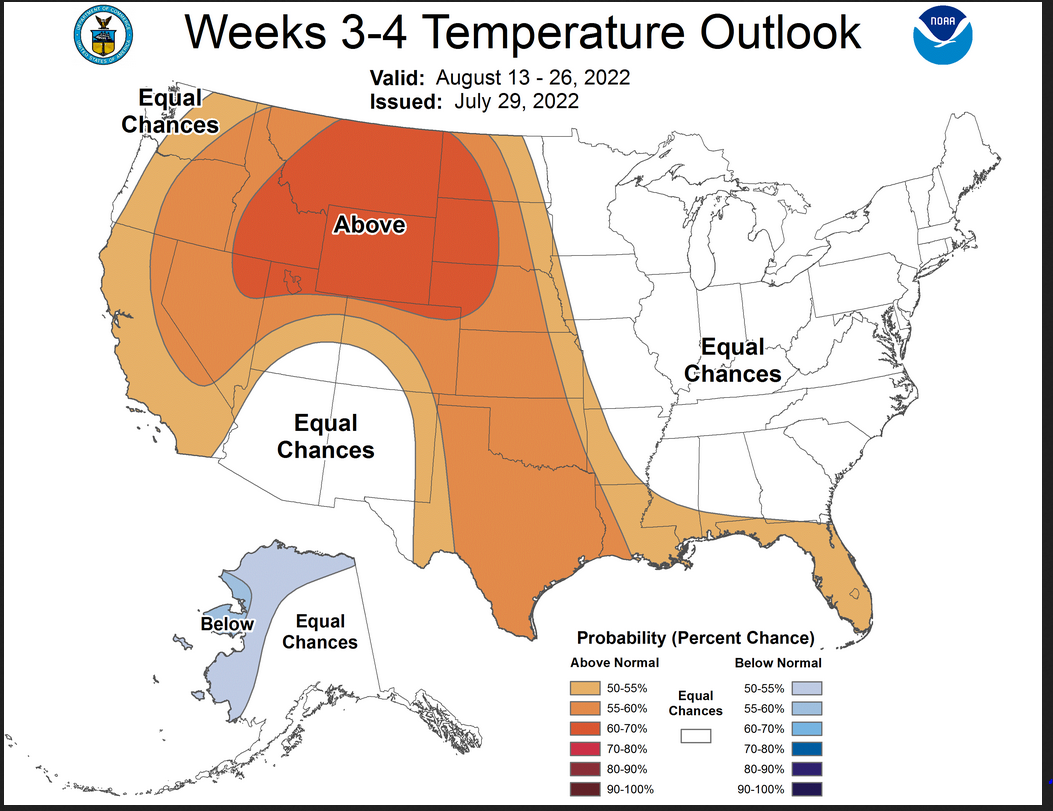
Prognostic Discussion for Week 3-4 Temperature and Experimental Precipitation Outlooks
NWS Climate Prediction Center College Park MD
300PM EDT Fri Jul 29 2022
Week 3-4 Forecast Discussion Valid Sat Aug 13 2022-Fri Aug 26 2022
Many of the large-scale climate signals that influence the Week 3-4 temperature and precipitation forecasts are currently neutral or are forecast to weaken by the start of the outlook period. Tropical convection associated with the Madden Julian Oscillation (MJO) is currently inactive with neither the GEFS nor the ECMWF anticipating an enhancement of convection over the next week. Both the North Atlantic Oscillation and the Pacific North America patterns are also expected to be in neutral phases by the start of the forecast period. La Niña conditions continue across the Tropical Pacific with sea surface temperature (SST) anomalies remaining near -1 degree C in the Niño 4 region and the associated teleconnections may have some influence on this week’s outlook. The temperature and precipitation forecasts for the current Week 3-4 outlook period are based primarily on a combination of dynamical model guidance with additional considerations from long-term trends, soil moisture and the predicted evolution of the Week-2 forecast.
With regards to the large-scale atmospheric circulation, the dynamical models consistently depict anomalous ridging across the northern tier of the CONUS as well as the tip of the Aleutian Islands with strongest anomalies in Week-3. More uncertainty exists in terms of the placement of anomalous troughing over Alaska. Both the CFS and ECMWF solutions favor negative 500-hPa anomalies across the state while the GEFS solution places the trough further north.
With the anticipated anomalous ridging, the forecast for the Week 3-4 period tilts toward above normal temperatures across much of the western two-thirds of the CONUS with strong probabilities over Wyoming and northern Utah where model agreement is strongest. A weak cold signal is consistently placed over the Southwest related predicted enhanced monsoon activity, but the observed temperatures for this region have remained slightly above normal over recent weeks. Therefore, equal chances (EC) of above or below normal temperatures are indicated. East of the Central Plains, the temperature signals are more uncertain with both CFS and ECMWF favoring colder than normal conditions while the GEFS favors warmer than normal conditions. As a result, EC is forecast for the eastern third of the CONUS except for Florida where a warm signal is indicated.
–
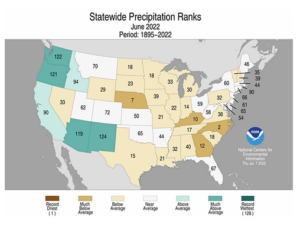
| The Southeast Precipitation is interesting The Monsoon is only impacting Arizona and New Mexico but remains above average. |
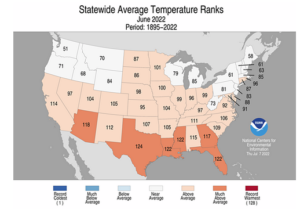
Looking back at June, 2022 and before that.
The state rankings show where for each state, their June weather on the left and their year-to-date (YTD) weather on the right fits within their 128-year modern set of data which is considered the most reliable. They are color-coded to make them easier to read.
| June 2022 | Year to Date 2022 |
|
|
|
|
|
|
|
|
|
|
|
|
|
|
|
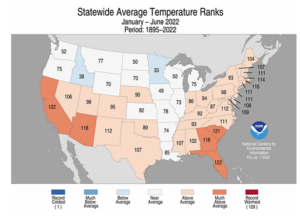
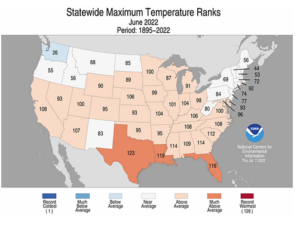
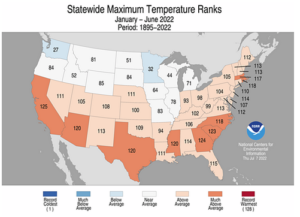
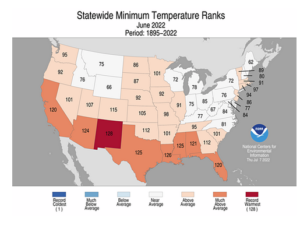
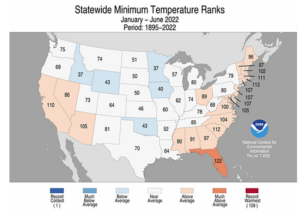
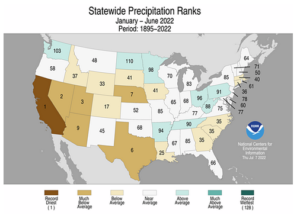
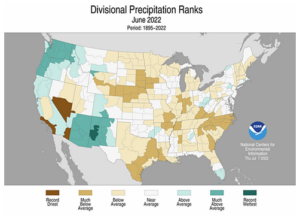
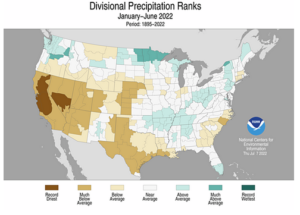
| The June minimum temperatures are interesting. Along the southern tier, these were among the warmest in modern history. YTD, California has had the driest year in modern history. The Climate Division Maps provide more information with respect to where in each state the lows and highs were. |

Nice figures