First half of 28-Day Forecast Period is wetter than the second half. But it is hot throughout the 28-Day Forecast Period.
NOAA updates many of their weather outlooks and in many cases issues a discussion with those outlooks. On Fridays, they issue a week 3 – 4 outlook which is farther out than the typical 10-day forecast and the discussion is excellent. So we have decided to issue a weekly special report on Fridays.
When the Week 3-4 Outlook is issued, we have a 28-day view of the future. It is important to recognize that the predictions do not always work out as predicted but in the article, there are links to obtain updated predictions.
It is somewhat surprising that there is as much difference between the first 14 days and the second 14 days of the 28-Day Forecast Period. The North American Monsoon is strong throughout the 28-Day Forecast Period. It is stronger at the beginning and slowly returns towards what is a normal Monsoon. Heat will be a hazard.

| Announcement: We now publish a daily weather report that addresses both short-term and intermediate-term weather issues including tropical events and you can find it at econcurrents.com. To return to this article just hit the return arrow at the upper left corner on your screen. This message is mainly for future reference as this article covers most of what you need to know other than tropical events. I do not include those in this article as generally, it is not possible to predict them out to 28 days. The links to information on tropical events are in the Daily Report. |
Outlooks for Days 6 – 28
Links to “Outlook” maps and discussions for three time periods. Days 6 – 10, Days 8 – 14, and Weeks 3 and 4. An outlook differs from a forecast based on how NOAA uses these terms in that an “outlook” presents information as deviation from normal and the likelihood of these deviations.
I have provided the maps so you do not need to click to get them. But they do not update daily. But you can get the current images simply by clicking on the links provided. Then hit the return arrow at the upper left of your screen to return to the article. There is no need to do that right away since what is published tonight is up to date.
Below are the links to obtain updates and additional information.
We start with Weeks 3 and 4. That may seem strange but for many purposes that is a time frame that is very important. It is half of the 28-Day forecast period.
Prognostic Discussion for Week 3-4 Temperature and Experimental Precipitation Outlooks
NWS Climate Prediction Center College Park MD
300PM EDT Fri Jul 22 2022Week 3-4 Forecast Discussion Valid Sat Aug 06 2022-Fri Aug 19 2022
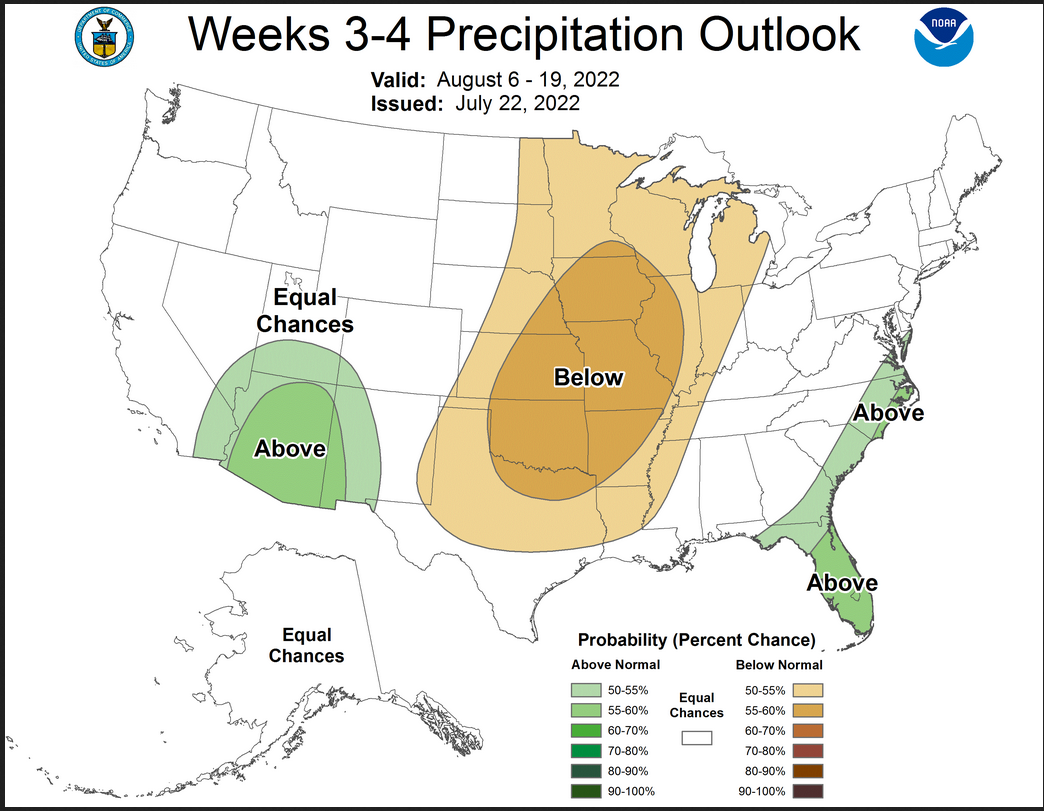
The Week 3-4 Outlook this week provides a probabilistic forecast for above or below the 1991-2020 climatology for temperature and (experimentally) precipitation for the two week period covering Aug 6-19. Dynamical models were the primary source of guidance for this forecast and in particular, the models broadly agreed that, on average during the 14-day forecast period, a ridging height pattern over CONUS would be favored, as well as a troughing pattern to the north of Alaska. The ridging pattern is expected to bring increased chances of above-average temperatures to central CONUS, the Rocky Mountain regions, and the Mid-Atlantic. Probabilities are most enhanced for the center of CONUS where model anomalies are forecast well above-average and experimental extreme heat tools give an early indication that 3-6 consecutive days of well-above average temperatures could occur in the central plains during the forecast period.
Despite generally weak anomalies for above-average temperatures across the west-coast states, equal chances are forecast for the region due to overall differences between the model guidance and experimental statistical guidance. Similarly for the Eastern Seaboard, model guidance indicates a generally weak signal for above average temperature anomalies in the New England and Mid-Atlantic regions during the forecast period, but there is disagreement in the spatial extent of the temperature signals among the models further north and south, so equal chances is forecast for Maine and Florida.
Model guidance for Alaska agreed on moderate chances of below average temperatures for most of the central part of the state. Weak signals and model disagreement in the Panhandle and North Slope of Alaska led to an equal chances forecast for those areas. Given the 14-day average position of a trough to the north of Alaska, rain is likely during the forecast period, but weak signals and low anomaly forecasts for the region could indicate that rainfall is likely to be close to near normal; hence equal chances for the state. Precipitation signals for CONUS are strongest for below average rainfall in the Central Plains and above average rainfall along the Eastern Seaboard and in the Southwest Monsoon region, potentially adding on to a monsoon season that continues to record above average rainfall.
The SubX MME depicts increased probabilities for weakly above-normal temperatures throughout Hawaii during the Week 3-4 period and increased chances for moderately below-average rainfall.
–
| It is summer so the type of forecasting tools used is different than in winter. |
Plus some medium-term outlooks (I am not including the discussions but if you click on the links provided earlier in this article you will be able to obtain them.
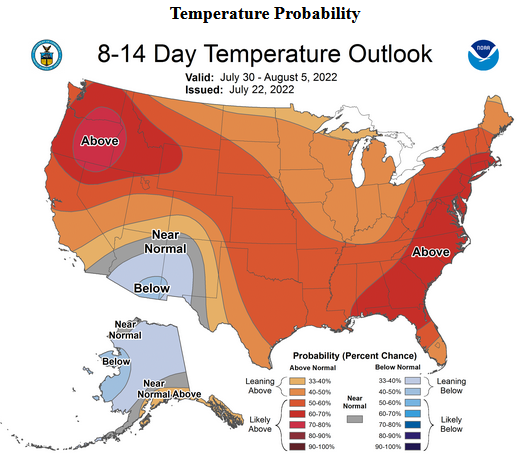
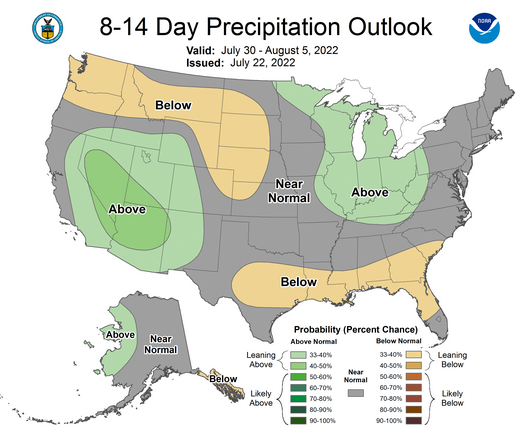
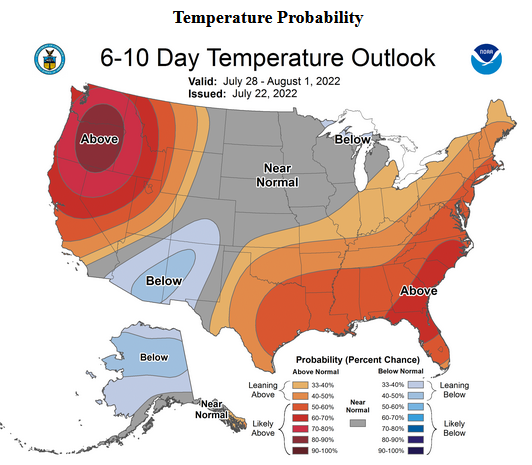
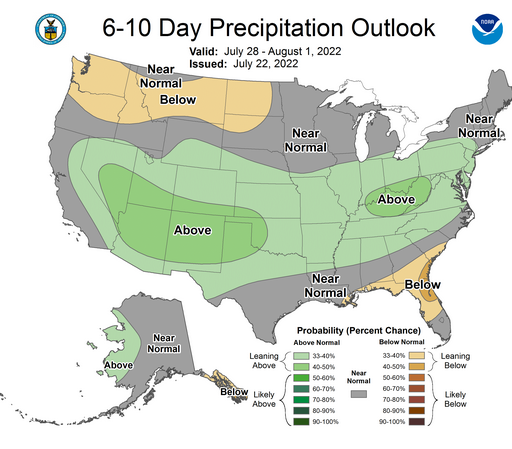
| There is a lot of change from one outlook to another. The 6 – 10 Day Outlook is very wet. |
Plus some short-term – click the links to update (you will end up with a lot of additional information)
| Temperature (Maximum Anomaly) | Precipitation (Five days of cumulative precipitation) |
| https://www.wpc.ncep.noaa.gov/medr/medr_mean.shtml | https://www.wpc.ncep.noaa.gov/qpf/day1-7.shtml |
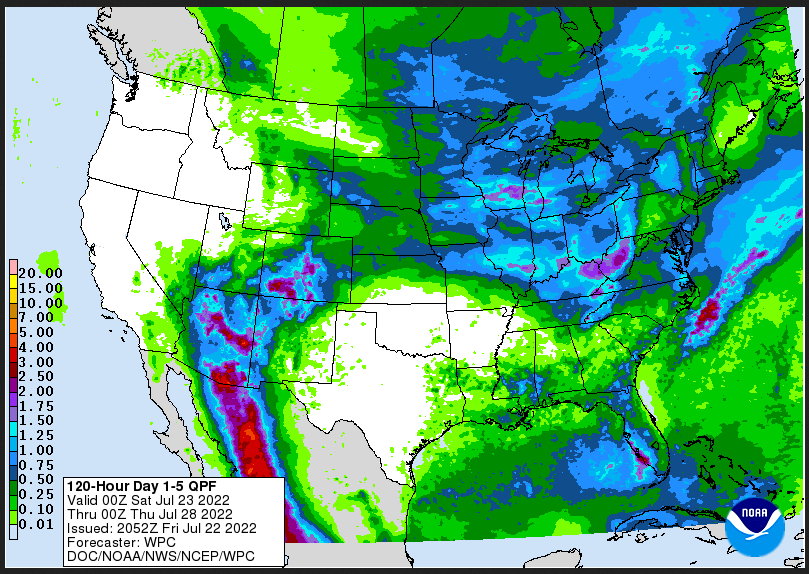
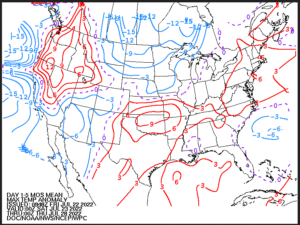
| The temperature map is one I have not used before last week. But you can see warm anomalies of up to 12F which is a lot There are also significant cool anomalies. You can see the Monsoon in Mexico partially entering Arizona and also impacting New Mexico, Utah, Colorado and more. This is only the first five days so there could be even more extreme warm anomalies in this 28-Day Forecast Period. |


