Here is what we are paying attention to this evening and the next 48 hours from this evening’s NWS Forecast.
...Dangerous heat to continue through midweek across the south-central
U.S., building into the Northeast on Wednesday...

...Severe thunderstorms possible into portions of the Ohio Valley on
Wednesday and New England on Thursday...

...Monsoonal moisture to bring locally heavy rains and isolated flash
flooding across portions of the Southwest, Great Basin and Southern Rockies...
Continuation of the NWS Short Range Forecast (It is updated twice a day and these updates can be found here.
Scorching heat will remain a major weather story over at least the next
few days throughout much of the south-central U.S. and extending into
other parts of the Nation as a stagnant upper-level ridge hovers over the
Southwest. Looking ahead to Wednesday, highs well into the triple digits
will once again impact the southern Plains and lower Mississippi Valley
with upper-90s extending into the lower Ohio Valley. Additionally, low
temperatures will be very warm and only dip into the upper 70s or low 80s,
which can exacerbate the dangers of heat due to a lack of substantial
cooling. Even though this is (on average) around the warmest time of the
year, these temperatures are forecast to run nearly 15 degrees above
average in some spots. In fact, several daily high temperature records
could fall across Texas and northern Louisiana on Wednesday. Elsewhere,
steamy temperatures into the 90s will also be felt into the Mid-Atlantic
and Northeast, as well as the central and northern Plains. Heat indices up
to around the century mark across the Northeast have prompted Heat
Advisories to be issued from Philadelphia to Boston. Excessive Heat
Warnings and Heat Advisories also remain in effect across much of the
south-central part of the country.

Periods of severe weather are possible through Thursday as well, mostly
across the northern tier states. A potent upper-level low is forecast to
cross over the Upper Great Lakes on Wednesday and help spark scattered
thunderstorms into the Ohio Valley. A few storms could turn severe,
producing damaging wind gusts, large hail, and isolated tornadoes. SPC has
issued a Slight Risk (level 2/5) of severe thunderstorms from southeast
Michigan through much of Ohio into eastern Indiana and northern Kentucky.
By Thursday, the severe weather threat is expected to shift along the cold
front as it progresses east-southeastward. SPC has issued a Slight Risk of
severe weather across New England and parts of central
Alabama/Mississippi, with damaging wind gusts anticipated to be the
primary hazard. Along with the severe weather threat in these locations,
isolated thunderstorms may contain intense rainfall rates capable of
producing localized flash flooding.

For the Southwest, monsoonal moisture over the region is anticipated to
continue leading to daily chances for isolated flash flood concerns over a
broad area. A Marginal Risk (level 1/4) of Excessive Rainfall has been
issued for Wednesday across much of the central Great Basin, Southwest,
and central/southern Rockies. By Thursday the threat is expected to
consolidate a bit and remain over the Southwest and parts of New Mexico
and Colorado. Areas within and near recent burn scars, as well as slot
canyons and saturated terrain are most at risk to rapid runoff.
Maps that relate the forecast to geography can be found by clicking Here for Day 1 and Here for Day 2.
Here is a 60-hour animated forecast map that shows how the short-term forecast is expected to play out.
If it needs to be updated click here.
HAZARDS OUTLOOKS
Click here for the latest complete Day 3 -7 Hazards forecast which updates only on weekdays. Once a week probably Monday or Tuesday I will update the images. I provided the link for reads to get daily updates on weekdays. Use your own judgment to decide if you need to update these images.


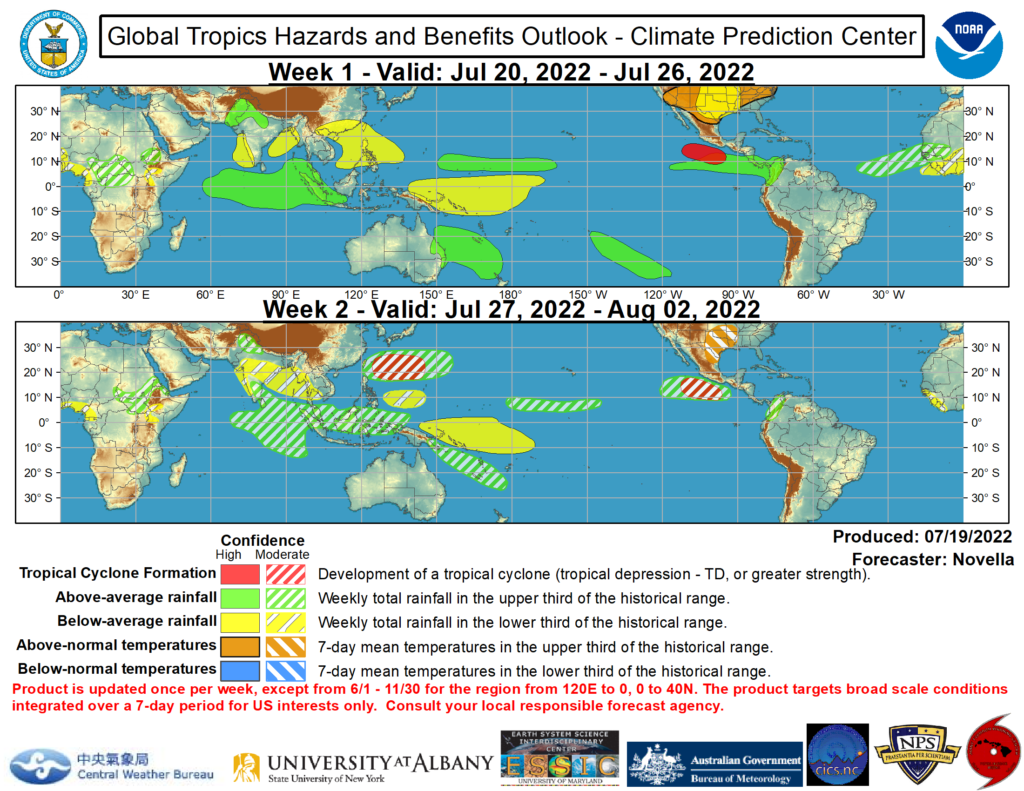
Worldwide Tropical Forecast
(This graphic updates on Tuesdays) If it has not been updated, you can get the update by clicking here
Detailed Maps and Reports for the Western Atlantic and the Pacific Oceans
Below are three maps that summarize the situation for the Atlantic, Eastern and Central Pacific. Additional information can be accessed by clicking HERE
First the Atlantic
Click to view the forecast map and have access to additional information https://www.nhc.noaa.gov/gtwo.php?basin=atlc&fdays=5
Then Eastern Pacific
Click to view the forecast map and have access to additional information https://www.nhc.noaa.gov/gtwo.php?basin=epac&fdays=5
Then Central Pacific
Click to view the forecast map and have access to additional information https://www.nhc.noaa.gov/gtwo.php?basin=cpac&fdays=5
And the Western Pacific
Click to view the forecast map and have access to additional information https://www.metoc.navy.mil/jtwc/jtwc.html
Some Intermediate-Term Outlooks
Links to “Outlook” maps and discussions for three time periods. Days 6 – 10, Days 8 – 14, and Weeks 3 and 4. An outlook differs from a forecast based on how NOAA uses these terms in that an “outlook” presents information from deviation from normal and the likelihood of these deviations.
You have to click on the links because they do not update automatically and I do not want to have stale images in the article. But it is not difficult to click on a link and you get a large image plus a discussion. On Fridays in a separate article, we will show the images and provide a link in this article that article. But remember what you will see is the images as of Friday. But here you can get the current images simply by clicking on them. Then hit the return arrow at the upper left of your screen to return to the article. You will not find this information easily anywhere else.

Right now you can find these maps here (We show them every Friday there but you can click above and find them).
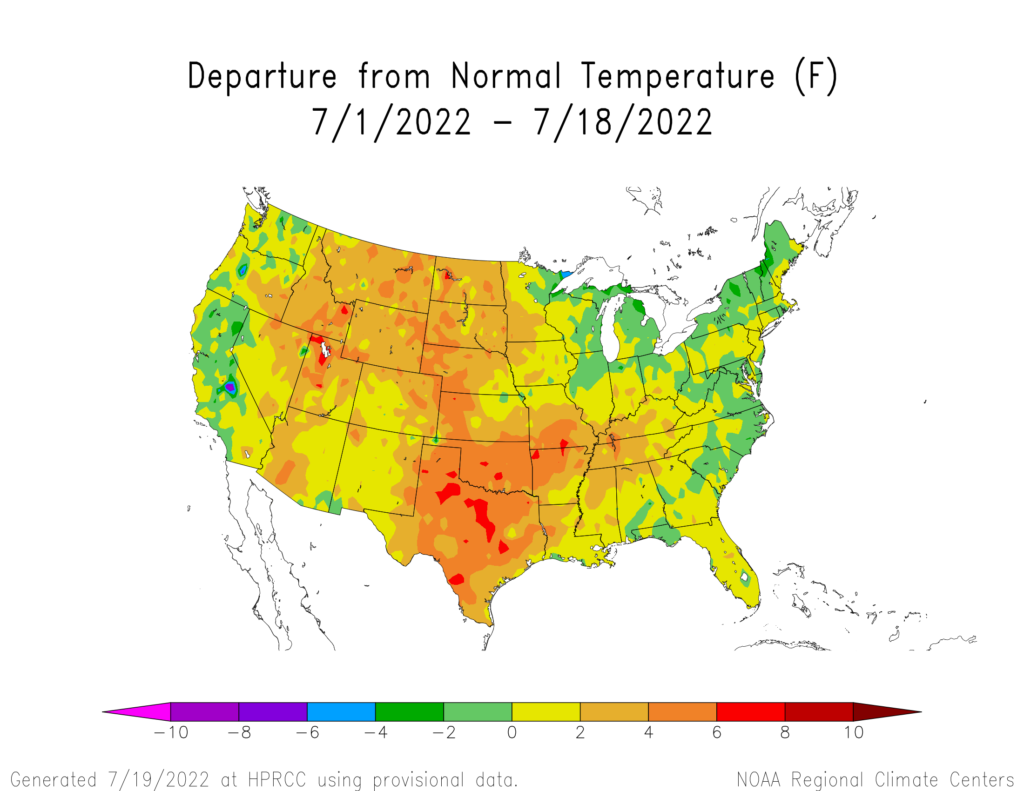
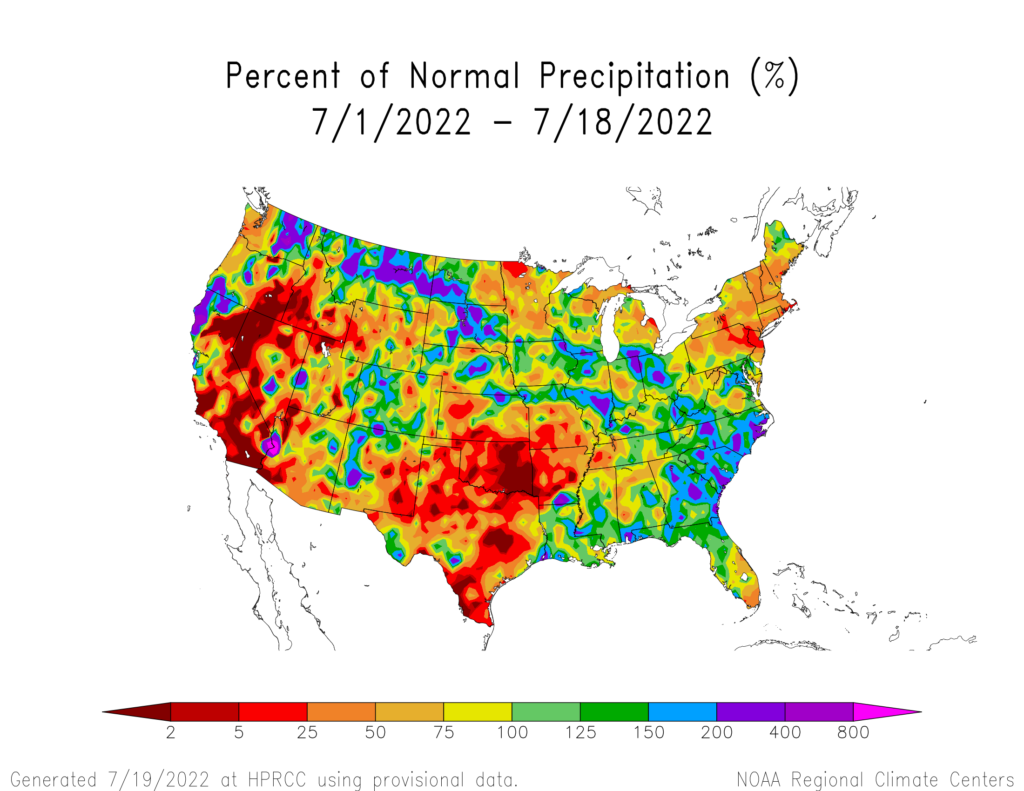
Month to Date Information
(These images do not auto-update – I update them from time to time, but the links are there just click on them)
Temperature
Precipitation
Month to date Temperature can be found at https://hprcc.unl.edu/products/maps/acis/MonthTDeptUS.png
Month to date Precipitation can be found at https://hprcc.unl.e du/products/maps/acis/MonthPNormUS.png
