The EIA Monthly Energy Review is long and does not change much from month to month since a lot of the information is historical. Some running for political office might have benefited by studying the data. Here I present the graphics from just the first three chapters. It is enough to see that coal is being phased out, electricity is increasingly important and our incorporation of alternative sources of energy is slow. I may provide more information in a future article but this should be enough for people to decide if they want more detail on the rest of the report.
At the end of the article, I provided a link to the full Monthly Review. The EIA Monthly Energy Review is separate from its annual reporting on crude oil and natural gas reserves. My prior article on their estimates of reserves can be accessed HERE. I think that reserves are only updated once a year.

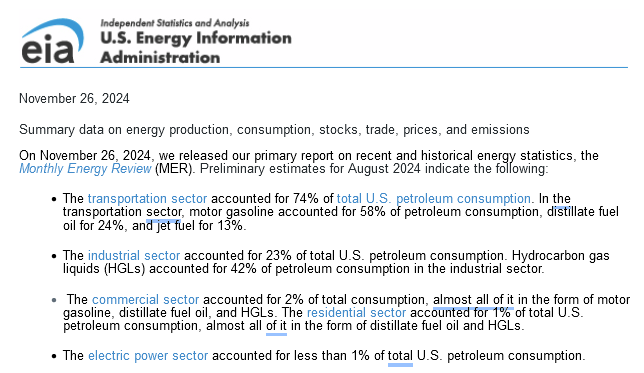
| The numbers here might look funny until you realize that in their summary they are only reporting on petroleum consumption. I have no idea why they did this. |
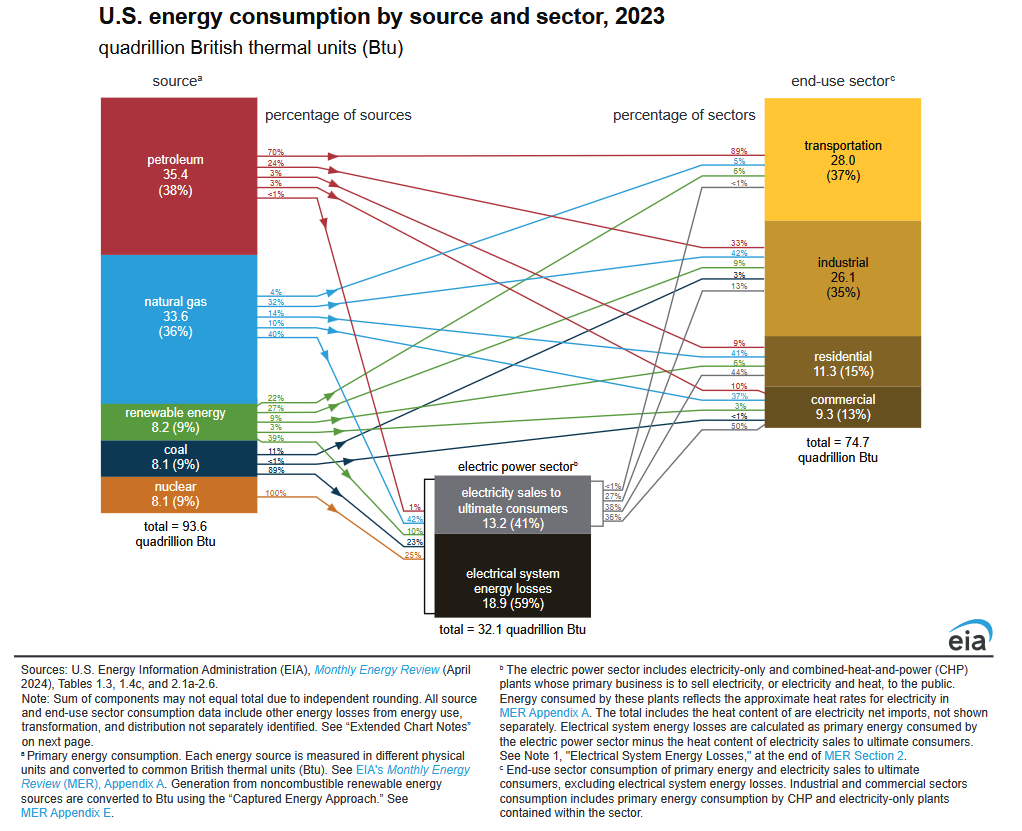
| This is a good graphic as it shows the source of energy and where it is used and what the losses are in the transmission of electricity. It is showing the situation for the full year of 2023. Notice that in this graphic Transportation and Industrial are about equal in terms of usage. |
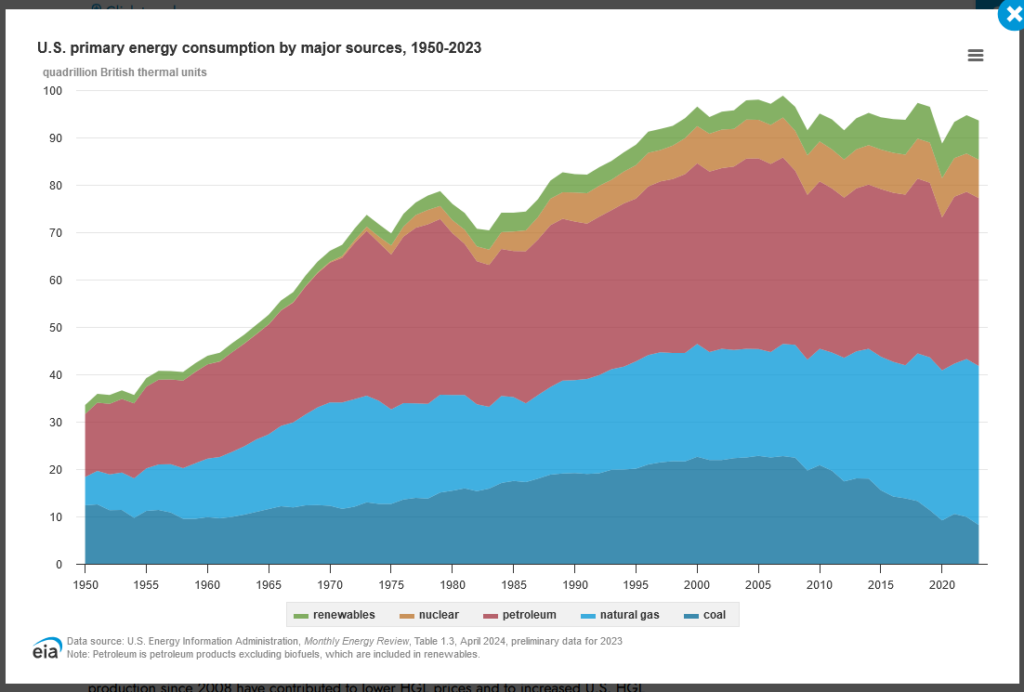
| The main takeaway here is the small role of renewables. Also, the increasing role of natural gas is important. |
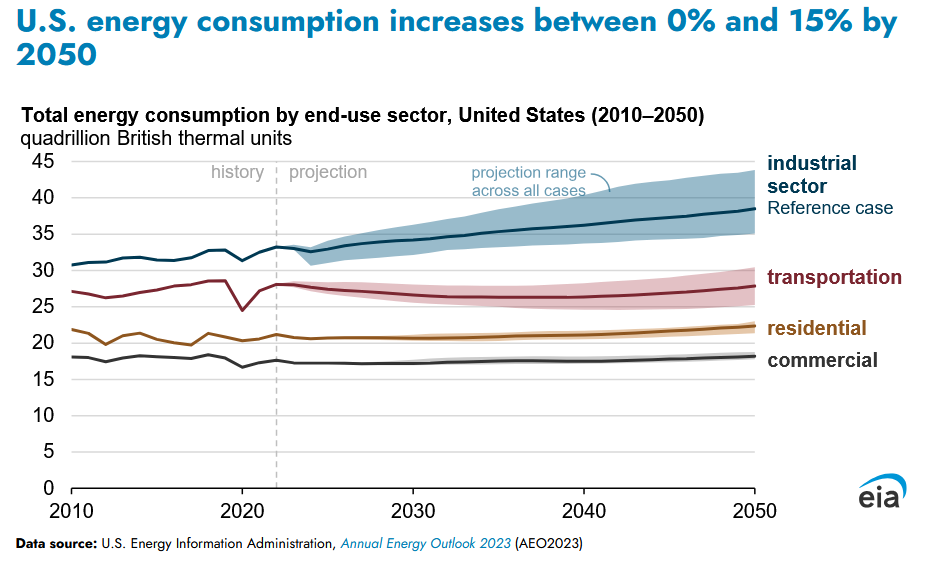
| This is from the 2023 EIA Annual Energy Outlook. I did not have enough time to really review this but it seems inconsistent with the data in the Monthly Report. It is important to remember that the information in the November Monthly Report may only be current as of August as it takes the EIA a lot of time to collect and validate information. That information indicated that transportation far exceeded the industrial sector and the commercial sector used very little energy. So I will try to sort that out. For sure there is a seasonal impact with respect to transportation. It is always difficult for me to work with EIA data. |
–
Some will need to click on “Read More” to access the rest of this article.
Now we will look at some of the information in the Monthly Report. It has a lot of information.
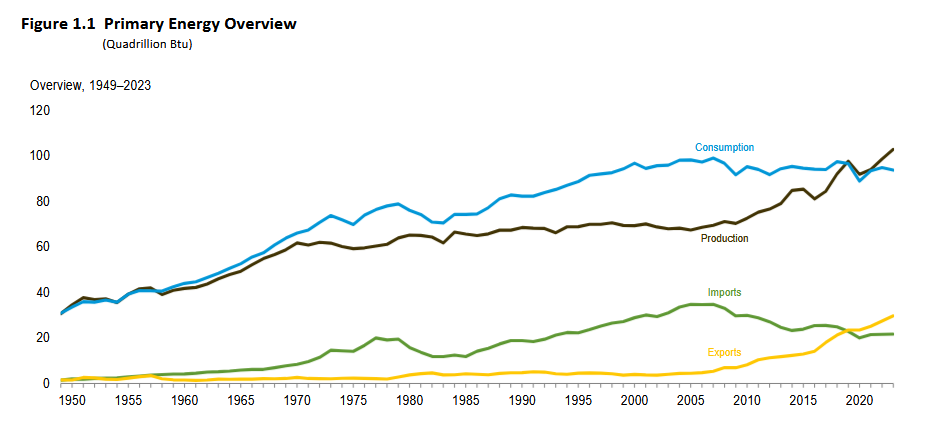
| Consumption is flat and energy production is increasing. Thus we have a trade surplus in energy. |
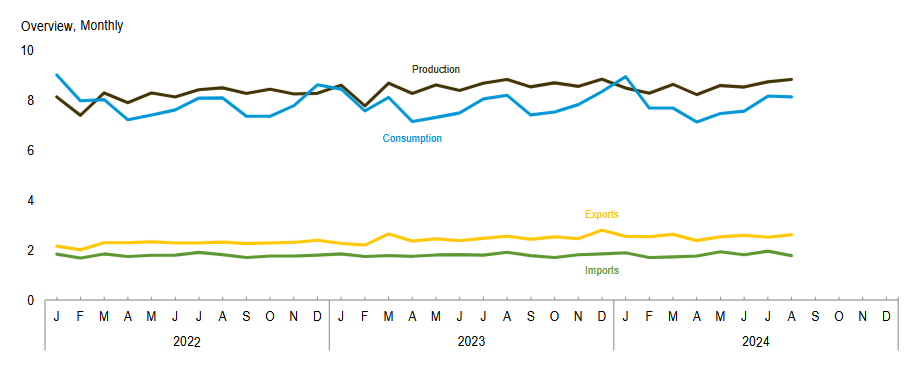
| On a monthly basis you see no change. That is the case for most of the data in this report so I am not showing the monthly graphics. |

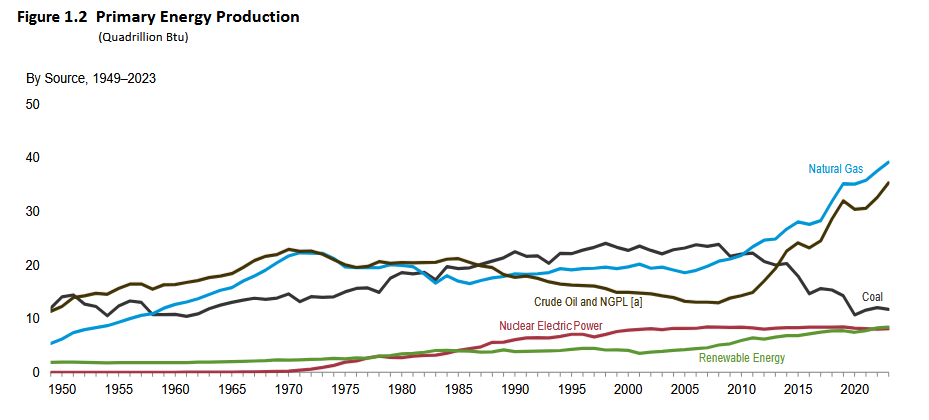
| Crude oil and natural gas have increased dramatically while coal has declined. Percentage-wise renewables have increased but the remain a small part of energy production. |
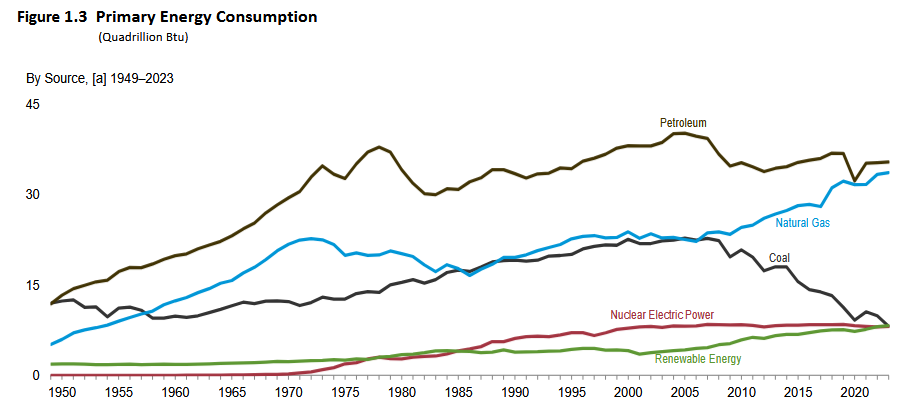
| Natural gas has been replacing coal. |
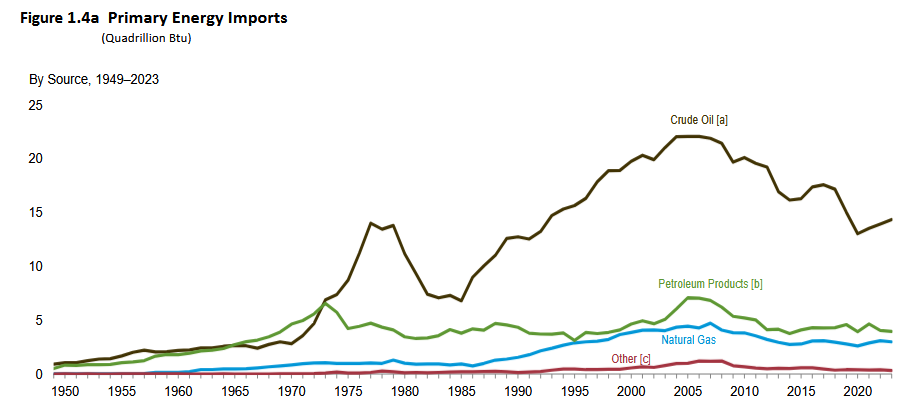
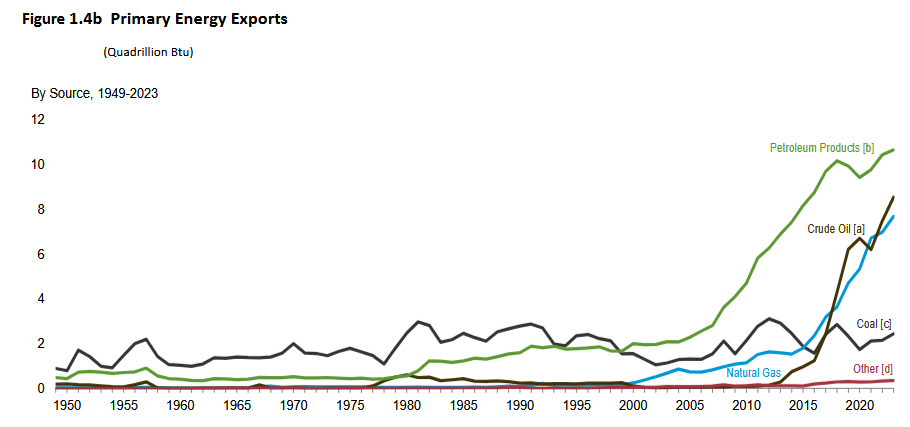
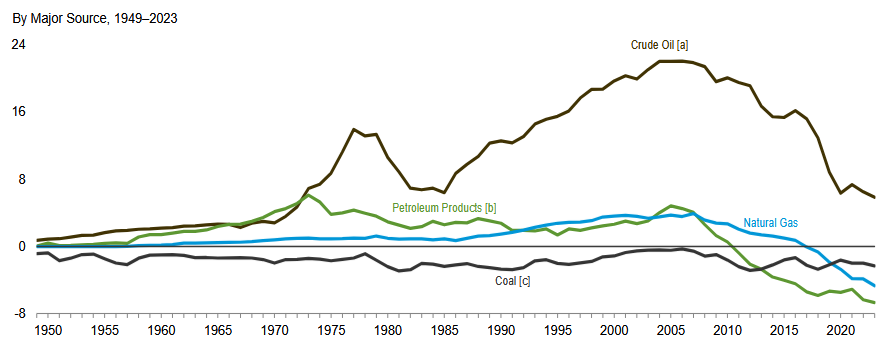
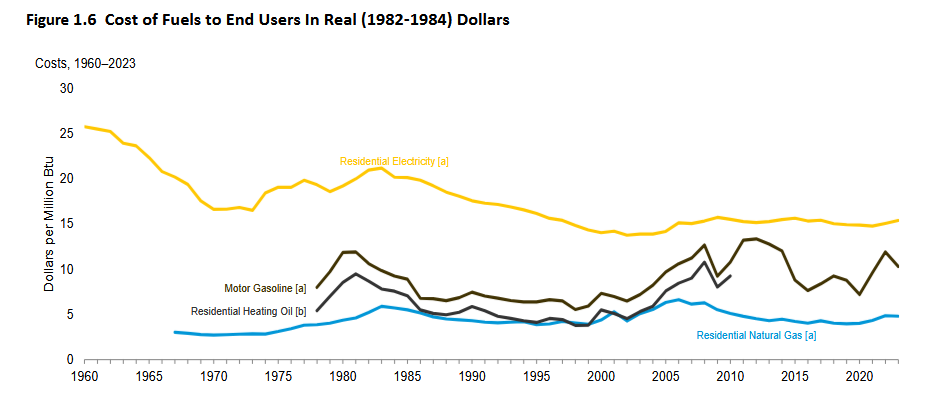
| Energy costs have declined. However, the cost of electricity has stopped declining due to government policy. |
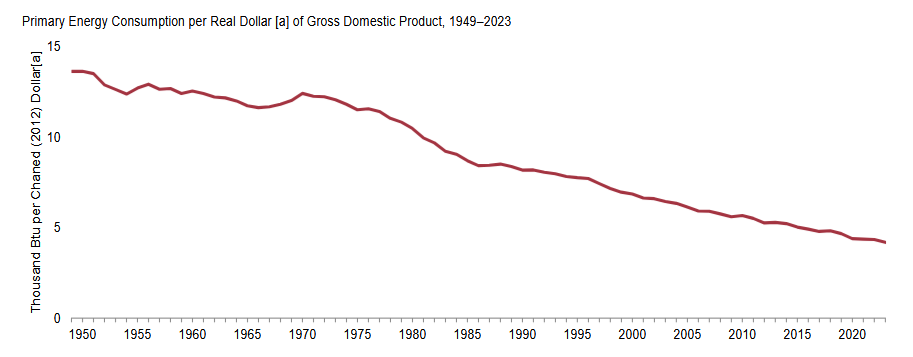
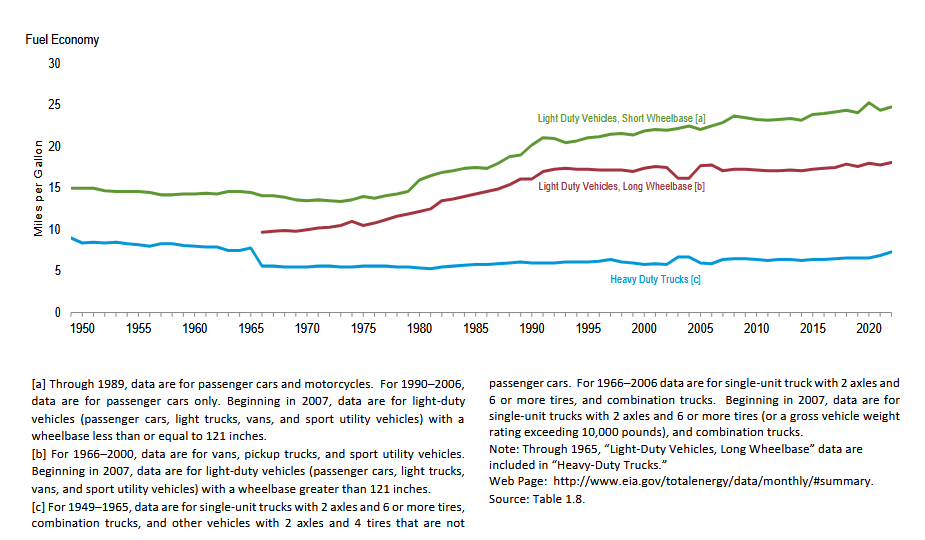
| MPG has not improved much recently. |
HERE is the PDF version of the report. They also publish an Annual Report with projections and this can be accessed HERE. It is their 2023 Report as they are updating their methodology and will not publish the report in 2024.
| I hope you found this article interesting and useful. |
–


