The National Centers of Environmental Information (NCEI) publishes a monthly analysis of the U.S. climate as well as an annual report. John Bateman, a meteorologist, and an NOAA Public Affairs specialist, sends out an email that summarizes the NCEI report. This article is based on the summary written by John Bateman. At the end of the article is the link to the full NCEI Report. The key takeaways: CONUS had the fourth warmest year in recent history and 20 billion-dollar disasters were identified.
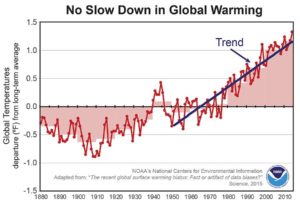
The graphic above is not up to date as it extends only through about 2015. I chose it because it provides a clear picture of the situation over 130 years. Notice it is a worldwide analysis, not an analysis that just covers the U.S. The upward trend beyond 2015 (not shown) seems to be similar but 2021 was cooler than 2020. You can see in the chart above that the temperature graph is not a smooth line. There are scientific reasons for this – the ability to compute an average temperature for the planet is less than perfect.
Below are text and graphics from John Bateman’s email plus two additional graphics. I added some subheadings in addition to those which were in John Bateman’s email.
For 2021, the average contiguous U.S. temperature was 54.5°F, 2.5°F above the 20th-century average and ranked as the fourth-warmest year in the 127-year period of record. The six warmest years on record have all occurred since 2012. The December contiguous U.S. temperature was 39.3°F, 6.7°F above average and exceeded the previous record set in December 2015.
There were 20 separate billion-dollar weather and climate disasters in 2021, just two events shy of the record set in 2020. These events caused at least 688 fatalities and scores more injured. Two disasters occurred in December — the Southeast, Central Tornado Outbreak and the Midwest Derecho and Tornado Outbreak.
The annual precipitation total for the contiguous U.S. was 30.48 inches, 0.54 inch above average, ranking in the middle third of the historical record. Despite near-normal precipitation at the national scale, 2021 witnessed several significant events at the regional scale, including an above-average monsoon season across the Southwest and several atmospheric river events along the Pacific Coast. Drought remained extensive across much of the western U.S. throughout 2021.
Temperature
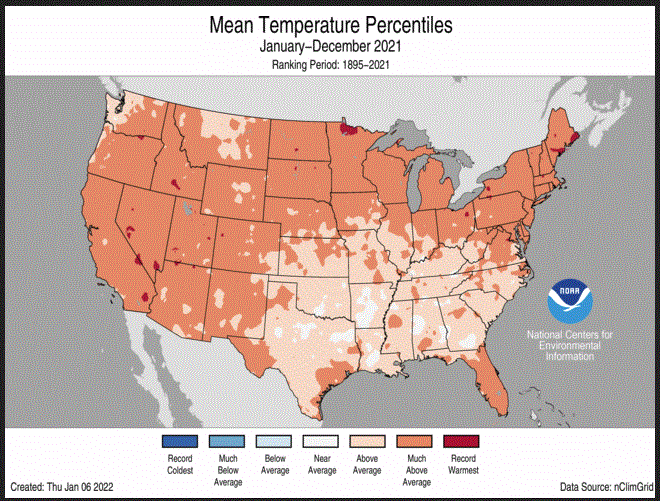
Map of average U.S. temperature percentiles for 2021 (Jan-Dec)
Here is another way of looking at it by the rankings of states. It uses the 127-year history of what is considered to be good data.
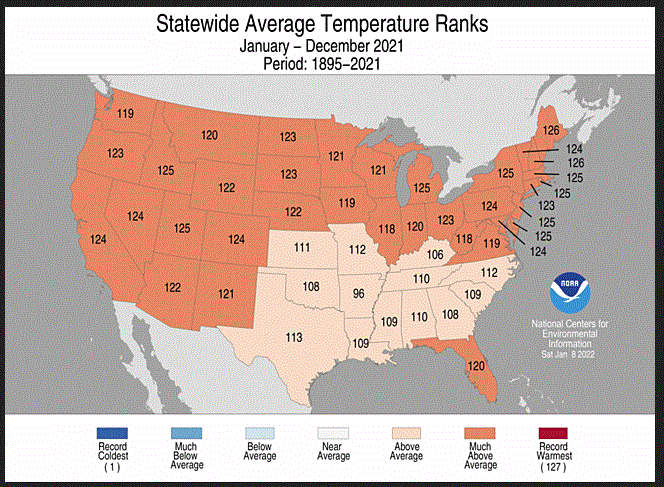
Most of the contiguous U.S. experienced above-average temperatures during 2021. Maine and New Hampshire both had their second-warmest year on record with 19 additional states across the Northeast, Great Lakes, Plains and West experiencing a top-five year. Temperatures were near average for the year in pockets across the South and Gulf Coast states.
A cold-air outbreak across the central U.S. from February 10-19 brought frigid temperatures, snow, and ice from the Plains to southern Texas and into the Mississippi River Valley. It was the coldest event observed across the contiguous U.S. in more than 30 years and caused power outages for nearly 10 million people as well as other costly impacts across 15 states.
Some unusually warm weather
A record-warm June across the contiguous U.S. ended with an unprecedented heat wave across the Pacific Northwest. Approximately 14.6 percent of the contiguous U.S. observed its warmest June on record. This is the largest extent of record warm temperatures on record for the U.S. during June.
A record-warm December across the contiguous U.S. was punctuated by record-warm temperatures across 10 states from the central Plains to the Gulf Coast. An additional 23 states from the Rockies to the East Coast ranked among their top-five Decembers.
The Alaskan statewide average annual temperature was 26.4°F, 0.4°F above the long-term average and was the coldest year since 2012. It was also the second year in a row with near-average annual statewide temperatures in contrast to the pronounced warmth across the state during 2014-2019. Despite the relatively mild year, Kodiak Harbor reported a temperature of 67°F on December 26. This is the highest December temperature on record for the entire state of Alaska, eclipsing the previous record of 65°F reported at Sitka Airport on December 12, 1944.
Precipitation
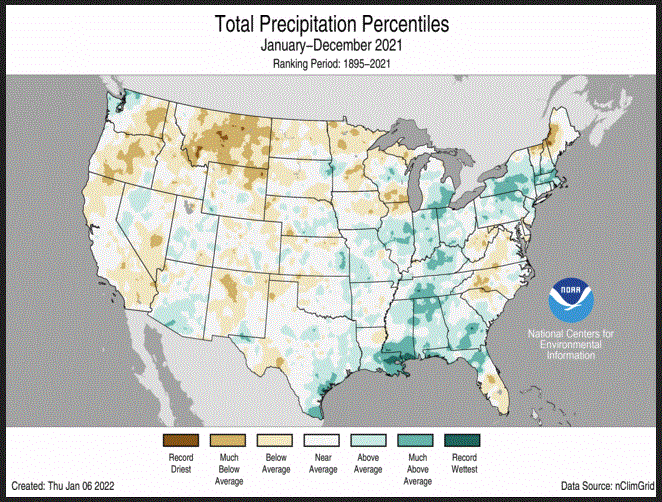
Map of total U.S. precipitation percentiles for 2021 (Jan-Dec):
Here is another way of looking at it by the rankings of states. It covers the 127-year history of what is considered to be good data.
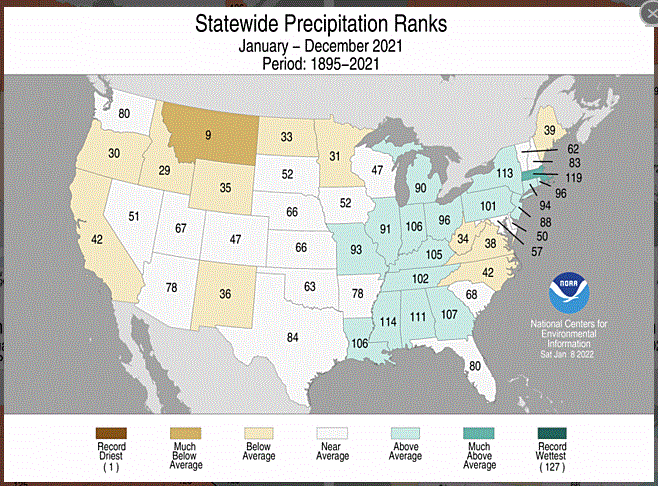
For the year as a whole, precipitation was above average in pockets from the Gulf Coast to the Great Lakes and into portions of the Northeast. Precipitation was below average across parts of the West, northern Rockies, Plains, western Great Lakes, Mid-Atlantic coast and parts of the Northeast and Florida. A strong winter storm brought heavy snowfall to the central Rockies and High Plains March 13-14. Denver had its fourth-largest snowstorm on record while Cheyenne reported its heaviest multi-day storm on record. Blizzard conditions and heavy snowfall rates disrupted transportation throughout the region.
Some drought relief
The Southwest monsoon season returned in July following two relatively inactive seasons. Tucson reported its wettest July and month on record followed by its wettest August on record. Consequently, flash flooding and fatalities resulting from the heavy rain were juxtaposed with the beneficial rainfall received from these events in the drought-stricken locations across the West and Southwest.
Several strong atmospheric river events from October to December along the West Coast brought ample rainfall and snow to several western states and mountain ranges. Drought intensity and coverage were reduced across some western states and end-of-year snowpack in the Sierra Nevada range broke December records, in excess of 200 percent of average at the end of the calendar year.
It was the wettest year since 2015 for the state of Alaska. Percentage of average precipitation received during 2021 varied by region with the West Coast region ranking wettest on record and the North Slope and interior regions receiving above-average precipitation. Meanwhile, parts of south-central Alaska and the Gulf regions received below-average precipitation for the year. Fairbanks had its wettest year on record with 18.74 inches of precipitation. This exceeded the previous record of 18.52 inches set in 1990.
Drought persisted in many areas
According to the U.S. Drought Monitor (USDM), drought coverage for the contiguous U.S. remained fairly significant and steady throughout much of 2021 with a minimum extent of 43.4% occurring on May 25 and maximum coverage of 55.5% on Dec 7. Drought conditions remained intact for much of the western U.S. and northern to central High Plains throughout 2021 and blossomed along portions of the Lower Mississippi Valley and the Carolinas near the end of the year. Extreme (D3) and exceptional (D4) drought covered about 26.8 percent of the CONUS on August 17 — the largest extent of D3 and D4 drought in USDM history. Hawaii’s moderate (D1) to exceptional drought extent grew rapidly during the summer months, peaking at 59 percent in July and was most intense in November and early December with extreme and exceptional drought at nearly 11 percent coverage. Mid-December precipitation nearly eliminated drought across the islands by the end of the year. Drought across Puerto Rico ebbed and flowed throughout the year, peaking in November with 29 percent coverage; Alaska was nearly drought free during most of 2021.
Billion-Dollar Disasters
Map of U.S. billion-dollar climate and weather disasters in 2021
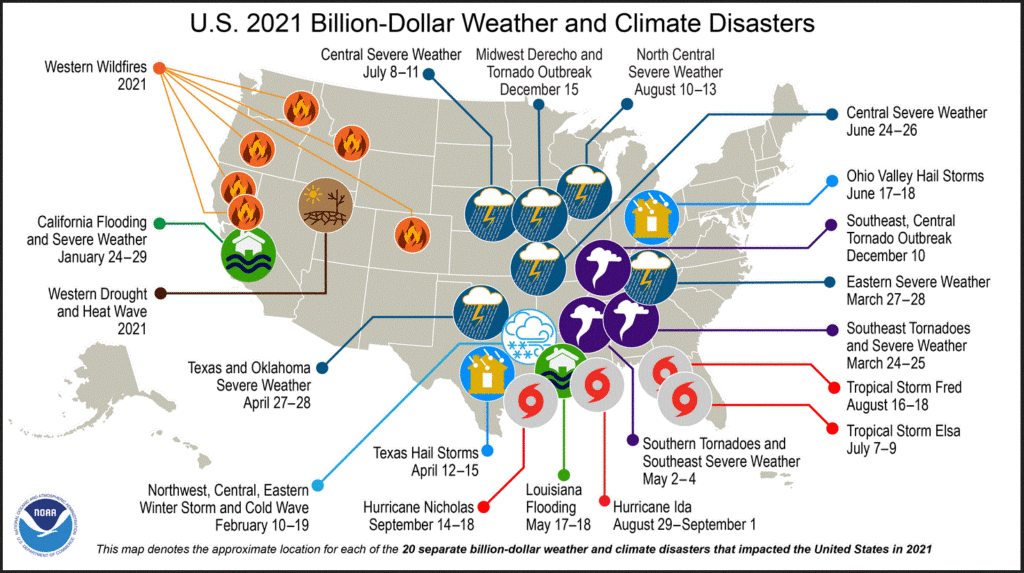
During 2021, 20 weather and climate disaster events had losses exceeding $1 billion each across the U.S. These events include eight severe weather events, four tropical cyclone events, three tornado outbreaks, two flooding events, one drought/heat wave event, one winter storm/cold wave event and one wildfire event, that includes the December 30 Marshall Fire in Boulder County, Colorado. This is the second-highest number of events on record and is two events shy of the 2020 annual record of 22 events.
The U.S. disaster costs for 2021 exceeded $145 billion, which is the third-highest cost on record.
Hurricane Ida was the most costly event of the year ($75 billion) and ranks among the top-five most costly hurricanes on record (since 1980).
The historic mid-February winter storm/cold wave was the costliest winter storm on record ($24 billion) — in inflation-adjusted terms, twice as costly as the Storm of the Century in March 1993.
Disasters in 2021 have caused more than twice the number of fatalities than all the events that occurred in 2020 (688 versus 262) and were the highest in a decade for the contiguous U.S.
2021 marks the seventh consecutive year (2015-2021) in which 10 or more separate billion-dollar disaster events have impacted the U.S.
Since records began in 1980, the U.S. has sustained 310 separate weather and climate disasters where overall damages/costs reached or exceeded $1 billion (based on the CPI adjustment to 2021) per event. The total cost of these 310 events exceeds $2.16 trillion. Disaster costs over the last five years (2017-2021) exceeded a record $742 billion, reflecting the increased exposure and vulnerability of the U.S. to extreme weather and climate events.
Other Notable Extremes
During 2021, 21 named storms formed in the North Atlantic Basin. This was the third most-active Atlantic hurricane season on record. Above-average tropical activity across the Atlantic Basin occurred for the sixth year in a row.
Category 4 Hurricane Sam formed during September and was the most intense Atlantic hurricane of the season. Sam maintained Category 4 strength for several days and remained far from land in the central Atlantic Ocean.
On August 29, Category 4 Hurricane Ida made landfall in Louisiana and was the fifth-strongest landfalling hurricane to hit the contiguous U.S., and the second year in a row that a Category 4 hurricane hit Louisiana. More than 1 million residents, including all of New Orleans, were without power. Remnants of Ida merged with a frontal system and brought unprecedented rainfall, strong tornadoes and many fatalities to parts of the Northeast on September 1. Hurricane Ida was the strongest landfalling and most destructive hurricane of the season with end-of-year cost estimates at $75 billion.
Wildfires
It was an active wildfire year across the western U.S. with more than 7.1 million acres consumed, 96 percent of the 10-year average.
The second-largest fire in California history, the Dixie Fire, consumed nearly 964,000 acres in 2021.
Smoke from several large fires created air quality and health concerns across the West and contiguous U.S. throughout much of the season.
Wildfire activity across Alaska was below average and consumed approximately 253,000 acres in 2021 — only 22 percent of the 2011-2020 average.
Snowfall
Snowfall during the 2020-2021 snow season was consistently below average across the Sierra Nevada range and parts of the northern Rockies. Several storm systems in January and the cold-air outbreak in February brought significant snowfall to the Lower 48. By February 16, snow covered 73.2 percent of the contiguous U.S — the highest daily value in the historical record. Additional late-season snowfall occurred in March, bringing record snowfall to portions of the central Rockies and High Plains and in April across the Ohio Valley and Northeast.
Active year for tornadoes
The 2021 preliminary tornado count was above average across the contiguous U.S. with 1,376 tornadoes reported. 193 December tornadoes were confirmed by early January 2022 — the greatest number of tornadoes for any December on record and nearly twice the previous record of 97 in 2002.
The most notable events during the year include two outbreaks, with a combined total of about 100 tornadoes, including an EF-4 tornado, on March 17 and March 25 across Dixie Alley, an outbreak in Iowa on July 14, the December 10-11 Mid-Mississippi River Valley Tornado event that spawned two EF-4 tornadoes, and the December 15 Midwest derecho event that produced more than 60 tornadoes across Nebraska and Iowa — the most tornadoes confirmed on any day during 2021. No EF-5 tornadoes were reported during 2021. The most recent tornado classified as an EF-5 occurred in 2013.
Portions of the Northeast, including Pennsylvania, Delaware, New Jersey and New York, experienced a very active tornado season in 2021 with seven days of severe weather producing more than 30 tornadoes across the region.
The Mid-Mississippi River Valley experienced an historic severe weather event on December 10-11 — the Quad State Tornadoes — that produced two long-tracked EF-4 tornadoes across Arkansas, Missouri, Tennessee and Kentucky. The longest tornado track was nearly 166 miles across Kentucky and a small portion of Tennessee. This is a record length for the month of December, the longest-tracked tornado on record in Kentucky and the ninth-longest tornado track on record for the country. Damage estimates are ongoing and are in excess of $3.9 billion.
Third highest Climate Extremes Index
The U.S. Climate Extremes Index (USCEI) for 2021 was 115 percent above average and ranked third highest in the 112-year record, second highest when taking the tropical cyclone indicator into consideration. Warm extremes in both maximum and minimum temperature across much of the U.S., in addition to dry Palmer Drought Severity Index values and extremes in 1-day precipitation across the U.S., contributed to this elevated USCEI value. The USCEI is an index that tracks extremes (falling in the upper or lower 10 percent of the record) in temperature, precipitation, drought and landfalling tropical cyclones across the contiguous U.S.
My Observations
It is very difficult for me to draw conclusions from a single year of data. But I can not help but conclude that warmer temperatures impact other variables. The precipitation data is fairly normal even a bit higher than average. But drought conditions were not good. From the report: Extreme (D3) and exceptional (D4) drought covered about 26.8 percent of the CONUS on August 17 — the largest extent of D3 and D4 drought in USDM history. It is not difficult to draw the conclusion that warmer temperatures cause more evaporative losses and can create drought conditions. Looking at the climate disasters map it seems as if warmer and wetter than usual are associated with disasters. But it is difficult to assess disasters when population is increasing and there is a higher percentage of urban population. It is something that we need to monitor closely.
Alaska was discussed but not shown on the maps. What happens in Alaska does not stay in Alaska. Since our winter weather comes from the west, how the jet stream impact Alaska is very important to much of the weather of North America. I noted that there was a good Southwest Monsoon in 2021 and that also is key to the overall summer pattern in the U.S.
So this report does not answer a lot of questions but it provides guidance as to what we should be paying attention to.
Credits
The full NCEI Report can be accessed at https://www.ncei.noaa.gov/news/national-climate-202112
I do not have a link for the email sent by John Bateman but it closely tracks the NCEI Report. He has not included every sentence in the report. I used his email because it was organized a bit better than the NCEI Report. With some of the material in the report omitted, the email is a little easier to read. The link to the full report is provided above. It is John Bateman’s job to present a lot of NOAA reports to the public. John Bateman, john.jones-bateman@noaa.gov
There is also a larger report that is available at https://www.ncdc.noaa.gov/sotc/. It may not be fully complete at this point as the website says it will be available on January 13, 2022
I added the state ranking graphics and the source for them is https://www.ncdc.noaa.gov/temp-and-precip/us-maps/.
Absolutely fascinating! But at the same time scary and disappointing. I live in New Mexico like Mr Silber and our experience with climate change is frightening. This comprehensive report puts it all in focus.
Most likely bad news for New Mexico and a number of other states but I thought I would let CPC (part of NOAA) address that in their Seasonal Outlook which will be issued this Thursday. When I look at the subsurface analysis I wonder when this La Nina will be over. I also have thoughts about whether or not our current approach to assessing ENSO is impacted by Warming. So I think William is right on target that we should worry about this. I will be writing more on this. ENSO impacts the weather around the World. Plus it impacts marine life.