It was forecast to be a subpar monsoon, but it is not turning out that way.
But first a digression.
| American Monsoons |
 |
NOAA/ National Weather Service
NOAA Center for Weather and Climate Prediction
Climate Prediction Center
5830 University Research Court
College Park, Maryland 20740
Page Author: Climate Prediction Center Internet Team
HERE is a link for more information on Monsoons.
| The above is pretty interesting because it shows that what we call The Monsoon (with the use of different names) is a process that impacts the Northern Hemisphere in the summer and South America in their summer. Very few people are aware of this. The above shows this. For South America, their Monsoon occurs over a period of time first impacting the Amazon Basin and then the La Plata Basin. I only mention this because the Monsoon is a more significant weather pattern than most realize. I found this graphic to be hard to decipher but did not have time to find a better one. But you can see the change in direction of the wind which is the definition of a monsoon namely a seasonal change in the direction of the prevailing wind. |
Now we will focus on the North American Monsoon (NAM)
The organization CLIMAS is an expert in this area and they recently issued an update report. Most of the rest of this article is taken from their report but they had a couple of three-month forecast slides which I have replaced with what NOAA issued on July 31, 2024, so they are a bit more current.
Where I have comments on their slides my comments are in boxes.
Some will need to click on “Read More” to access the full article.
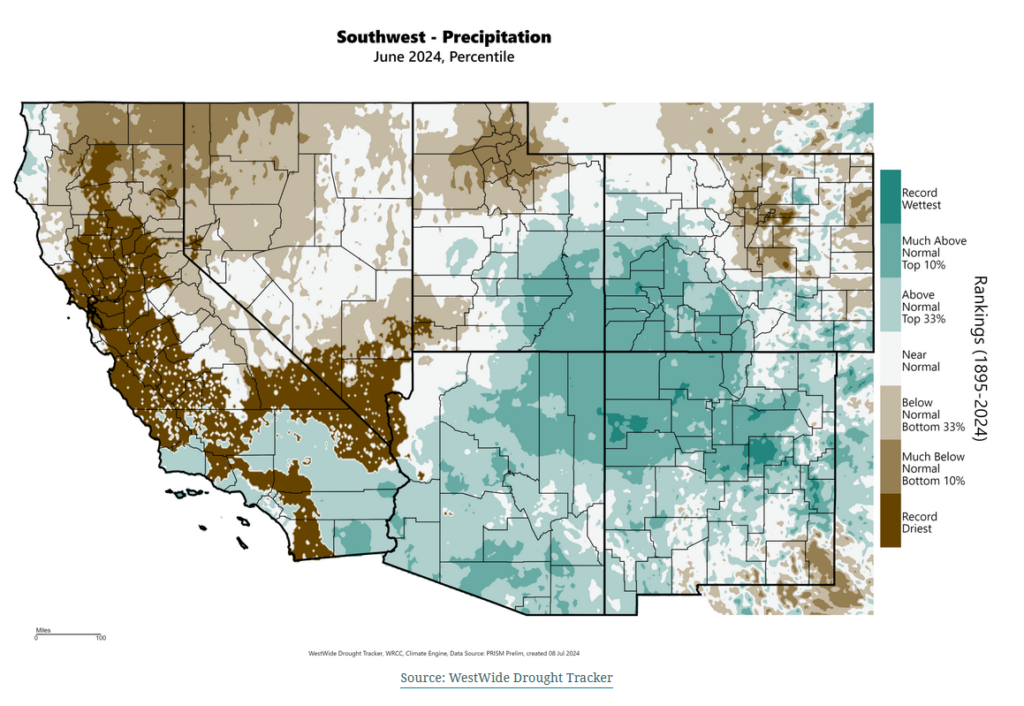
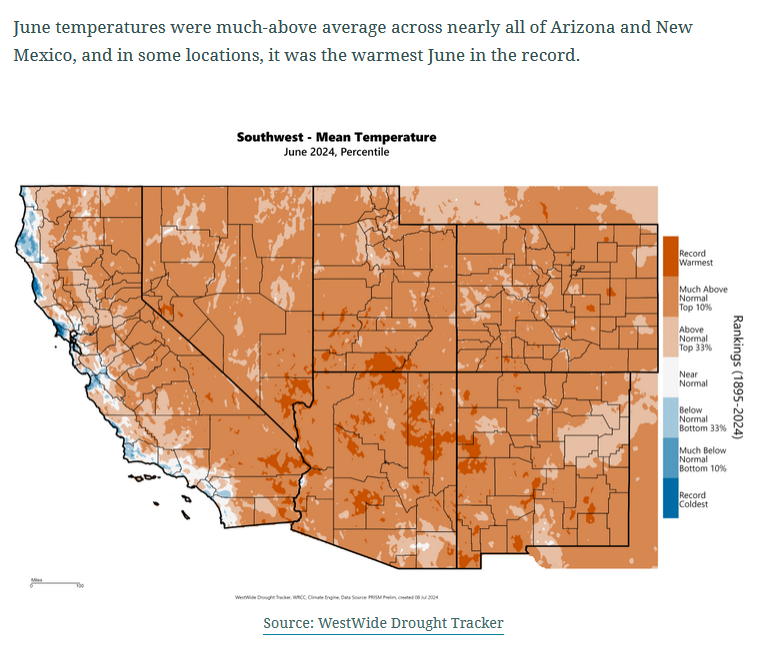
| Notice that these maps cover a number of states, not just Arizona and New Mexico. The impact of the North American Monsoon (NAM) impacts a large part of the U.S. but it impacts Arizona and New Mexico the most but the impacts are important for a large number of states. |
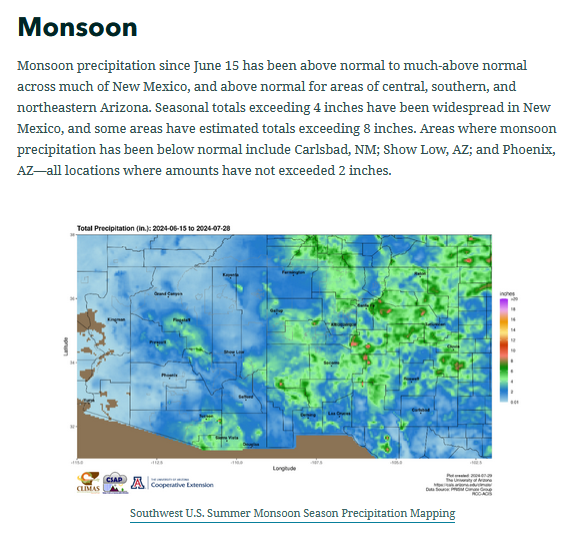
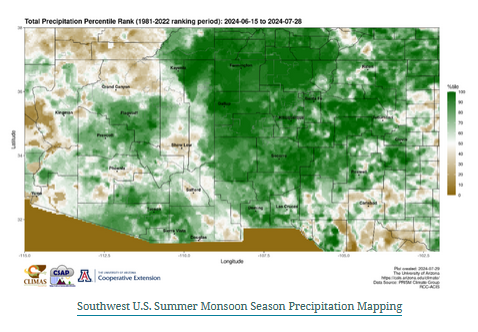
| The graphic above this one shows the actual precipitation that has occurred. The next graphic shows the ranking of that level over a forty year period. So you can more easily see where it has been wetter than usual. It is similar to some earlier graphics but covers just the period from June 15 to now. |
 Click HERE to access. It provided more information and that information auto-updates. For New Mexico, the information may be easier to read.
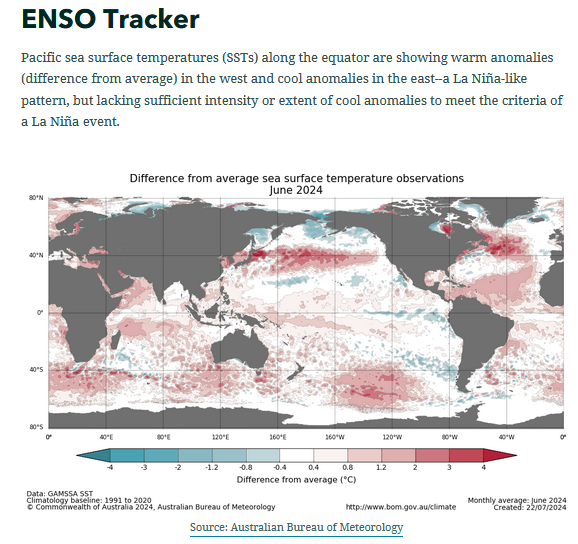
| The above are the current sea surface temperature anomalies estimated by the Australian Bureau of Meteorology. Looking at the Equator for the Eastern Pacific, it is showing ENSO Neutral. |
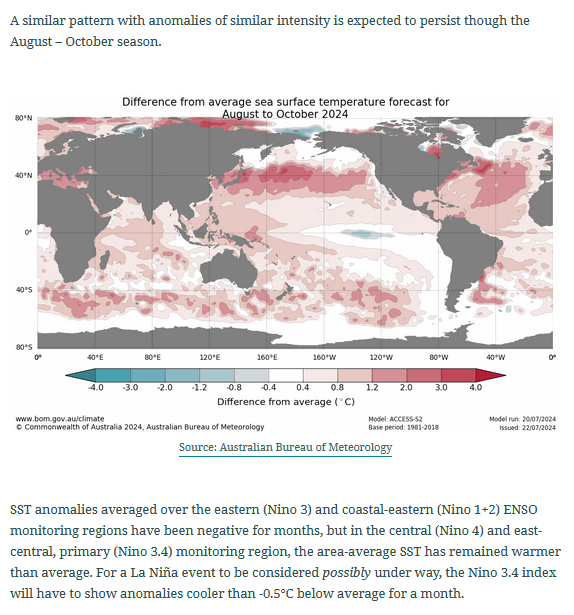
| These are the predicted sea surface temperature anomalies. The Australian Bureau of Meteorology is less convinced that we will have a La Nina. You can see a cool water anomaly along the Equator in the Pacific but it is small and westerly displaced and is what JAMSTEC calls a Modoki. It raises questions about the reliability of the NOAA Seasonal Outlook. Perhaps their models will handle this correctly. |
You can access the full CLIMAS Article HERE. The next graphic is more recent.
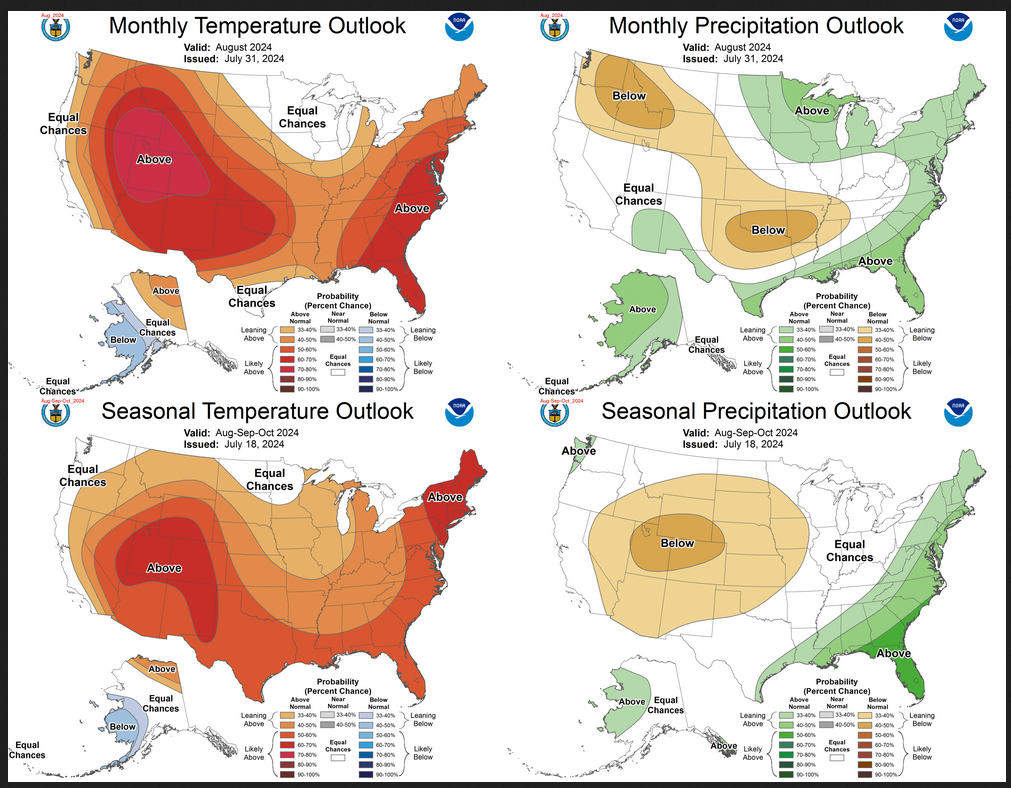
| The top pair of maps are again the Updated Outlook for the new month which is August. There is a temperature map and a precipitation map. The bottom row shows the three-month outlooks which includes August the new month. I think the outlook maps are self-explanatory. But it is important to remember that the NOAA Seasonal Outlook was issued on July 18, 2024 while the August Outlook was issued on July 31, 2024. |
–
| I hope you found this article interesting and useful. |