On the third Thursday of the month right on schedule NOAA issued their updated Seasonal Outlook which I describe as their Four-Season Outlook because it extends a bit more than one year into the future. The information released also included the Mid-Month Outlook for the following month plus the weather and drought outlook for the next three months. I present the information issued by NOAA and try to add context to it. It is quite a challenge for NOAA to address the subsequent month, the subsequent three-month period as well as the twelve successive three-month periods for a year or a bit more.
With respect to the long-term part of the Outlook which I call the Four-Season Outlook, there is a rapid transition from El Nino to ENSO Neutral to LaNina. So getting the timing right is challenging. La Nina is now the likely scenario for this summer almost to the end of the forecast period. The Outlook beyond May has not been significantly changed from what was issued last month. This suggests increasing confidence in the outlook. I may write another article on the implications of this forecast for agriculture and perhaps energy usage.
First, Let’s Take a Look at the (mid-month) Outlook for May
It will be updated on the last day of April.
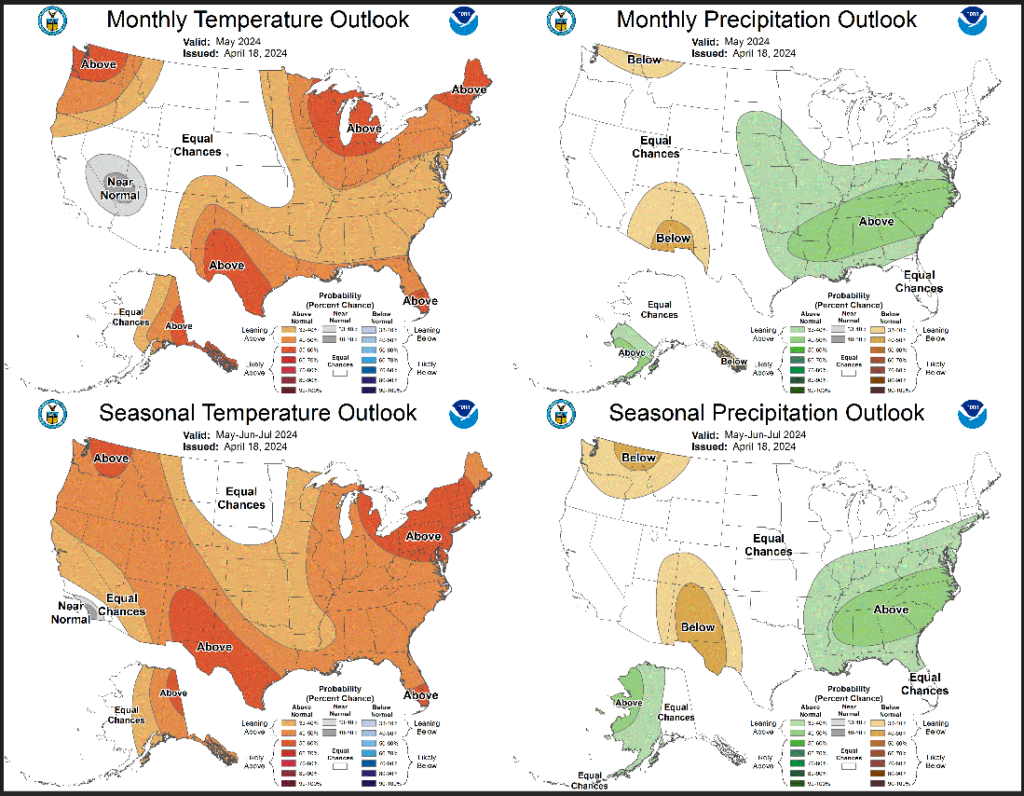
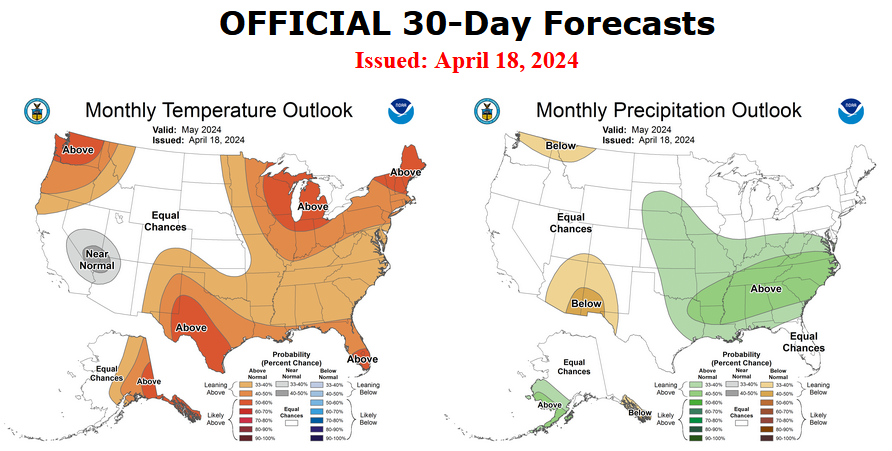
The top row is what is now called the Mid-Month Outlook for next month which will be updated at the end of this month. There is a temperature map and a precipitation map. The second row is a three-month outlook that includes next month. I think the outlook maps are self-explanatory. What is important to remember is that they show deviations from the current definition of normal which is the period 1991 through 2020. So this is not a forecast of the absolute value of temperature or precipitation but the change from what is defined as normal or to use the technical term “climatology”.
| Notice that the Outlook for next month and the three-month Outlook are somewhat different, especially with regard to temperature. This tells us that June and July will be different than May to some extent. |

The full NOAA Seasonal Outlook extends through May/June/July of 2025 (yes that is more than a year out). All of these maps are in the body of the article. Large maps are provided for May and the three-month period May/June/July. Small maps are provided beyond that through May/June/July of 2025 with a link to get larger versions of these maps.
NOAA provides an excellent discussion to support the maps. It is included in the body of this article. In some cases, one will need to click on “read more” to read the full article. For those on my email list where I have sent the url of the article, that will not be necessary.
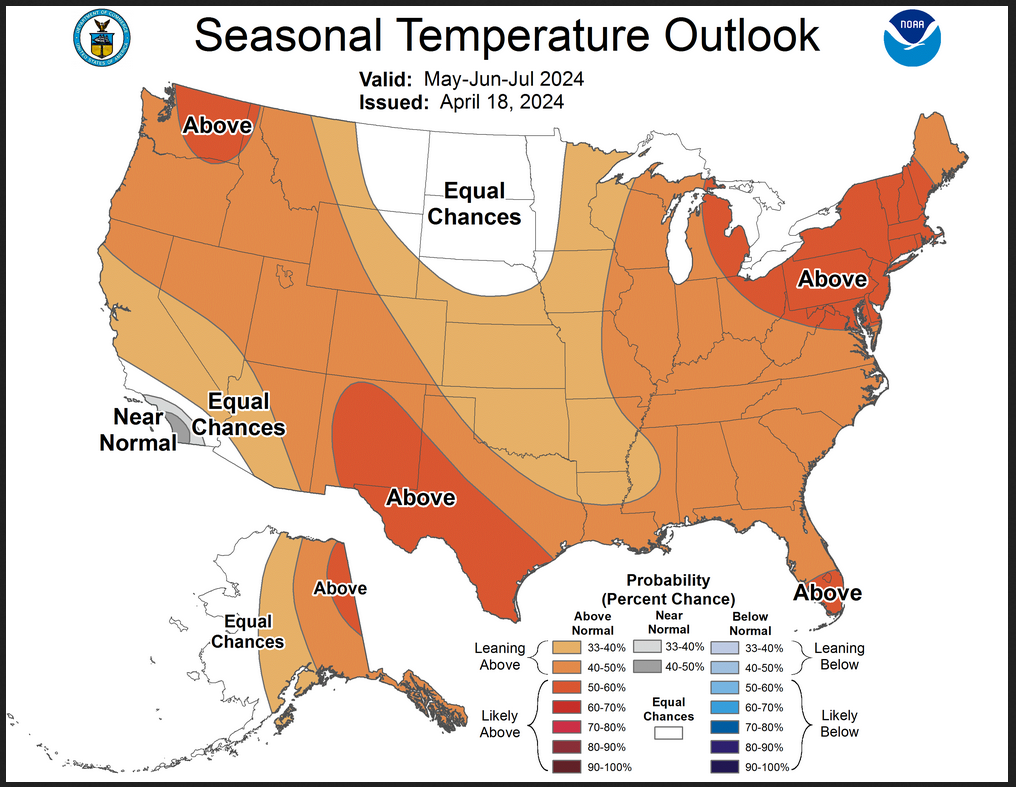
Here are larger versions of the Temperature and Precipitation Outlook maps for next month.
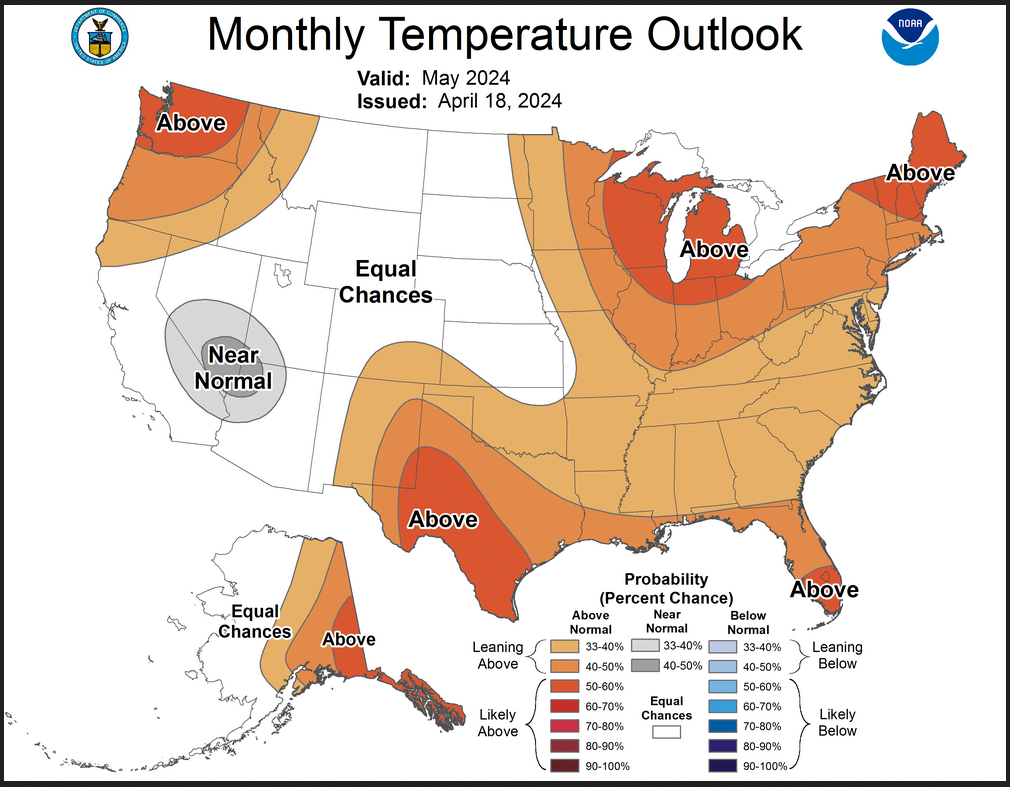
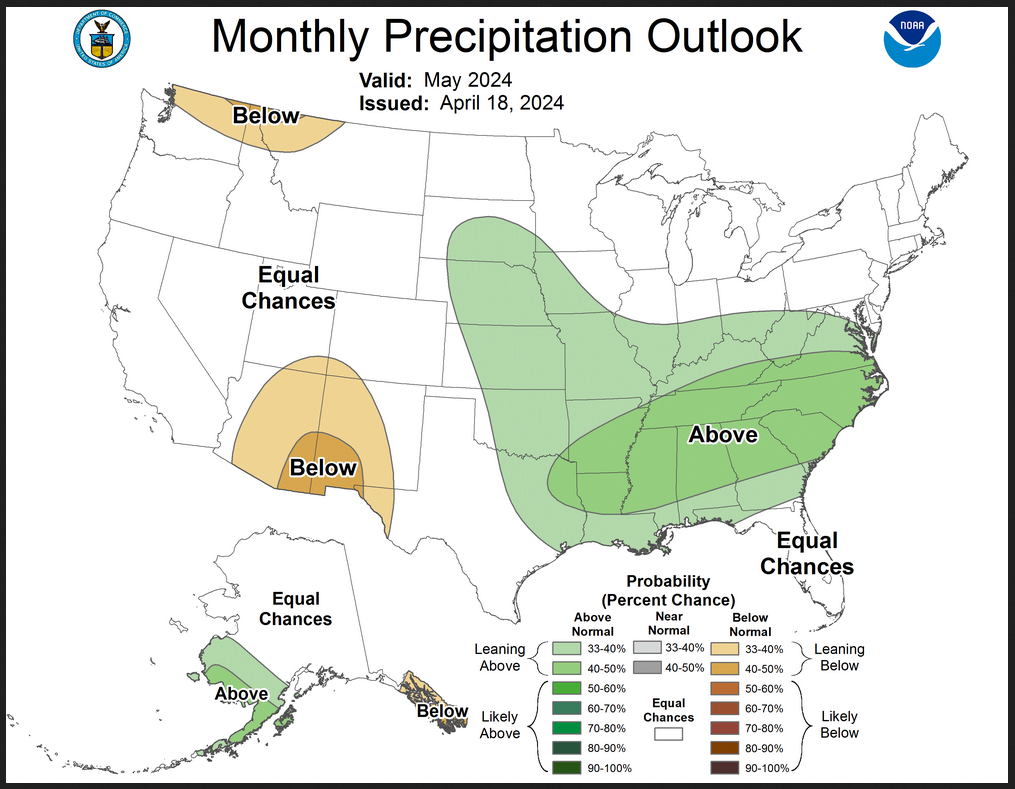
The maps are pretty clear in terms of the outlook.
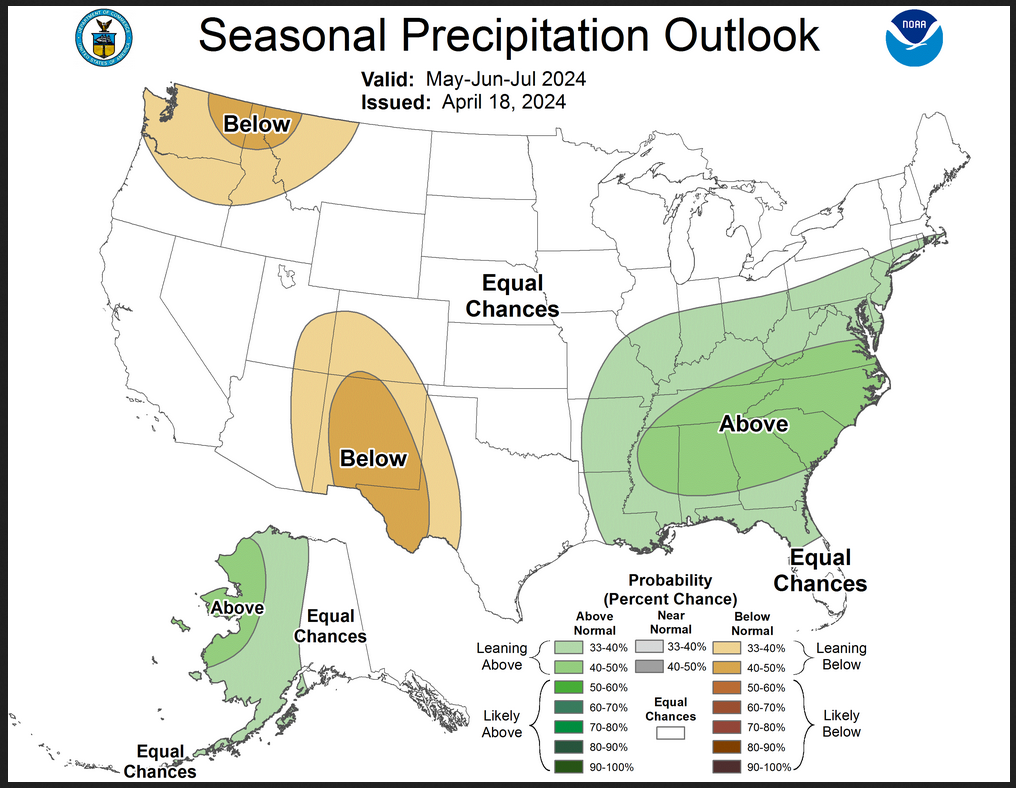
And here are large versions of the three-month MJJ 2024 Outlook
First temperature followed by precipitation.
| These maps are larger versions of what was shown earlier. |
Drought Outlook
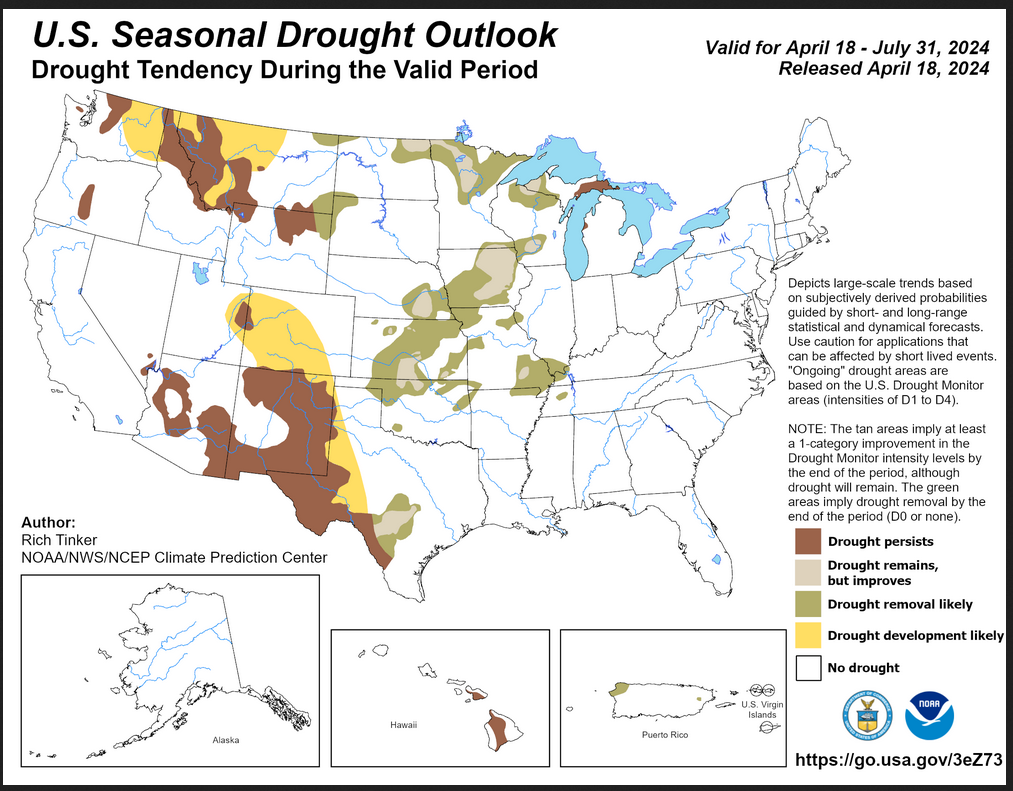
| The yellow is the bad news and there is a lot of it. And there is a large area where drought is expected to persist. To the east, there is a lot of area where drought improves or is eliminated. Overall the level of drought is expected to remain about the same which is fairly low but with a La Nina winter ahead, it is likely to go higher. |
Short CPC Drought Discussion
Latest Seasonal Assessment – During the past month, an active weather pattern covered much of the United States. In areas where drought existed in mid-March, improvement or removal was widespread by mid-April. Drought persistence, deterioration, or development was limited to the south-central Great Plains, areas near the Mississippi and Ohio Rivers’ Confluence, and small scattered areas in the central Gulf Coast region, the northern Great Plains, the southern High Plains, the Pacific Northwest, and Hawaii. According to the Drought Monitor, the proportion of the country covered by drought dropped from 18.7 percent on March 12 to 14.7 percent on April 9, which was the smallest amount in almost 4 years (14.6 percent on May 12, 2020; the lowest on record was 2.4 percent in mid-May 2019). The dearth of drought is particularly notable in eastern parts of the country. As of April 16, both the Southeast and Northeast Regions were free of any drought.
El Nino conditions are currently waning, a trend expected to continue through the end of the period, thus El Nino correlations will have declining influence on the outlooks going forward. Climatology, antecedent conditions, trends, and dynamical model output (for both the last half of April, and as incorporated into the May Monthly and May-July Long-Lead Outlooks) were the primary factors Considered.
For the outlook from mid-April through the end of July 2024, a line could be drawn from the Rockies and the southern High Plains to delineate the forecast. West of this line, drought is expected to persist or intensify where it exists, and a Long-Lead Outlook favoring below-normal May-July precipitation led to a forecast for drought development in a few areas with some degree of pre-existing dryness; specifically, much of western Texas, a large portion of Colorado, part of adjacent Utah, and farther north in a swath from eastern Washington through central Montana where drought is not already in place. Drought persistence or intensification is similarly forecast for Hawaii, where the Long-Lead Outlook also favors below-normal precipitation. In drought areas from the northern High Plains and the central and southern Great Plains eastward, drought improvement or removal is anticipated due to model forecasts for heavy precipitation in some areas over the next few weeks, and climatology, with May-July being a relatively wet time of the year when many areas see an increase in soil moisture more often than a decrease. The only exception is in eastern Michigan, where neither climatology nor short-term forecasts are as wet as in areas farther west. In addition, an above-normal precipitation pattern across Puerto Rico is expected to continue, which is forecast to remove drought from the Island by the end of the period. No drought currently exists in either the U.S. Virgin Islands nor Alaska, and none is expected to develop at this time, although southeasternmost Alaska will need to be monitored for impacts from a cold season with unusually little snowfall.
Looking out Four Seasons.
Twelve Temperature Maps. These are overlapping three-month maps (larger versions of these and other maps can be accessed HERE)
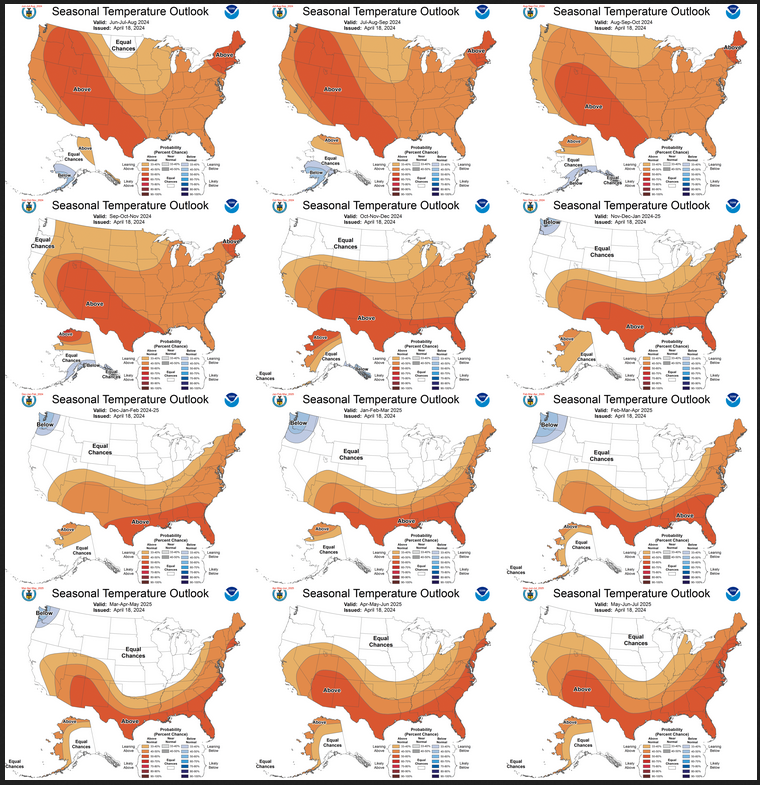
Notice that this presentation starts with June/July/August 2024 (MJJ) since MJJ is considered the near-term and is covered earlier in the presentation. The changes over time are generally discussed in the discussion but you can see the changes easier in the maps.
Comparing the new outlook with the prior Outlook,
The 12 temperature maps issued last month.
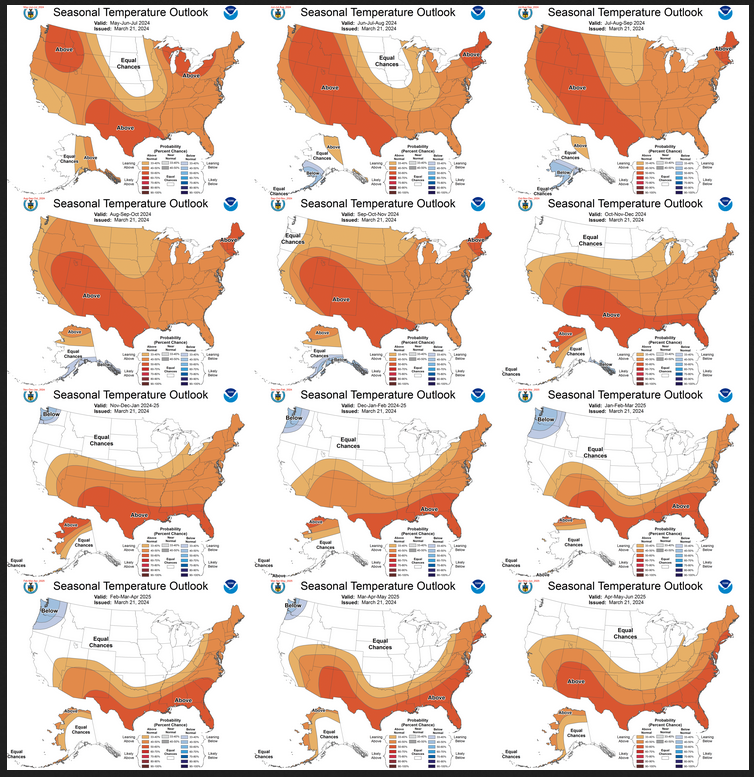
The easiest way to do the comparison is to print out both maps. If you have a color printer that is great but not needed. What I do is number the images from last month 1 – 12 starting with “1” and going left to right and then dropping down one row. Then for the new set of images, I number them 2 – 13. That is because one image from last month in the upper left is now discarded and a new image on the lower right is added. Once you get used to it, it is not difficult. In theory, the changes are discussed in the NOAA discussion but I usually find more changes. It is not necessarily important. I try to identify the changes but believe it would make this article overly long to enumerate them. The information is here for anyone who wishes to examine the changes. I comment below on some of the changes from the prior report by NOAA and important changes over time in the pattern.
| Usually, it is difficult to identify the changes in the temperature pattern because most of the changes are changes in the likelihood of it being warmer than climatology. This month however it seems that I can tell that other than JJA 2024 which is a bit warmer in the north the rest seems to be unchanged. They are basically saying that other than the short term there is no significant change in the drivers of weather so there was no reason to change the outlook. We noticed that when they issued the ENSO forecast a week ago. |
Now the Twelve New Precipitation Maps
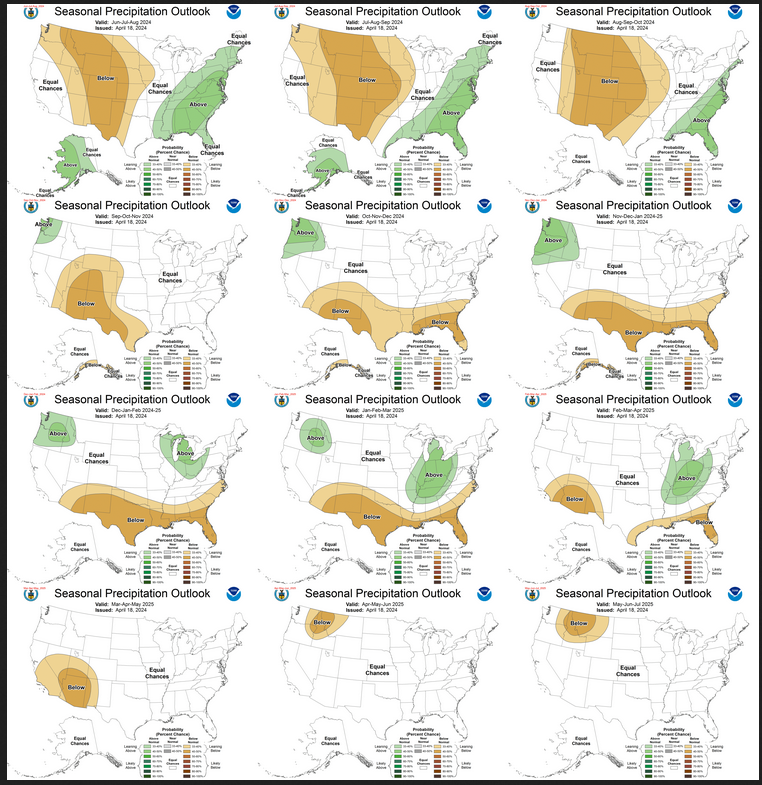
Similar to Temperature in terms of the organization of the twelve overlapping three-month outlooks.
Comparing the new outlook with the prior Outlook,
The maps that were released last month.
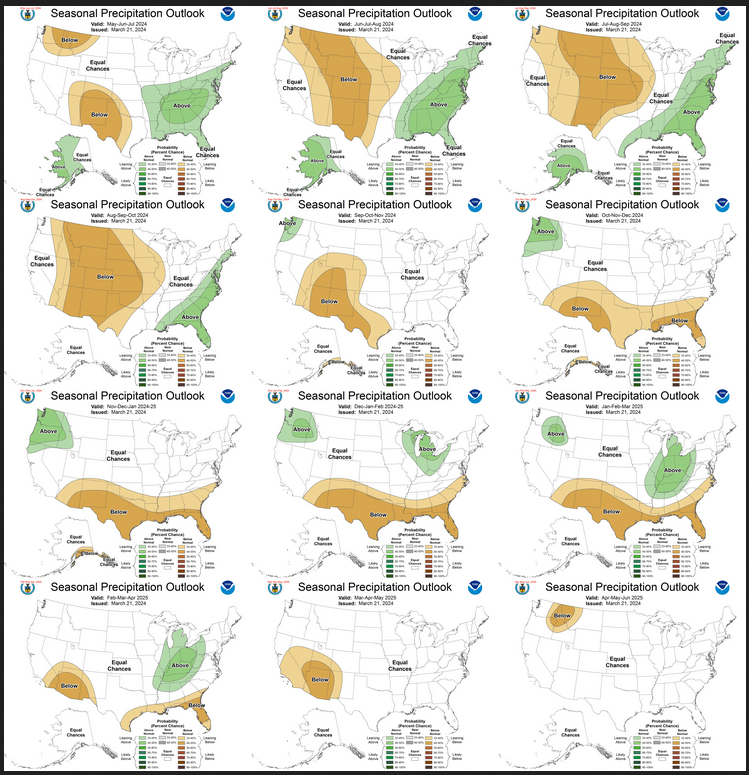
A good approach for doing this comparison is provided with the temperature discussion.
| The overall outlook is the same as last month. It is fairly well described in the NOAA Discussion. Below are images of two representative three-month outlooks that illustrate the pattern. |
| The bottom winter map suggests a more northern Jet Stream. I do not know how to interpret the summer map. It includes a failed monsoon but the dry anomaly covers a large area as does the wet anomaly. It is the west/east divide that is discussed in the drought outlook but it extends beyond the MJJ three-month time period. |
NOAA Discussion
Maps tell a story but to really understand what is going you need to read the discussion. I combine the 30-day discussion with the long-term discussion and rearrange it a bit and add a few additional titles (where they are not all caps the titles are my additions). Readers may also wish to take a look at the article we published last week on the NOAA ENSO forecast. That can be accessed here.
I will use bold type to highlight some especially important things. All section headings are in bold type; my comments, if any, are enclosed in brackets [ ].
CURRENT ATMOSPHERIC AND OCEANIC CONDITIONS
El Niño is fading rapidly as equatorial Pacific sea surface temperatures (SSTs) continue to cool, associated with upwelling from an oceanic Kelvin wave. The most recent weekly value of the Niño3.4 SST index is a surprisingly high +0.9 degrees C, which is a bit misleading given the very shallow layer of subsurface warmth underlying this area. Relatively cold water (departures ranging from -0.5 degrees C to at least -6 degrees C) is in place from the surface between 120W and 100W longitude, extending westward and deepening across most of the equatorial Pacific, reaching a depth of 150 to 300 meters at 150E longitude (the approximate longitude of the Solomon Islands and Coral Sea). Tropical convection is now slightly suppressed across the vicinity of the Date Line and the equator, and close to average over Indonesia. These anomalies, in addition to the return of low-level easterly wind anomalies to the west-central Pacific Ocean are indicative of the underlying transition from El Niño to ENSO-neutral.
As of mid-April 2024, above-normal soil moisture is present in many areas of the CONUS – including many areas west of the Continental Divide, the north-central Plains, from the southern Great Lakes eastward across the Northeast and Mid-Atlantic region, and from the vicinity of the Texas-Oklahoma Panhandles east-southeastward across the Arklatex region and Gulf Coast states. Drier than normal soils are evident over northern North Dakota, northwestern Minnesota, in the vicinity of the Washington Cascades rain shadow and Northern Rockies, and across much of New Mexico and southwestern Texas. Drier than normal soils are also indicated in a wishbone-shaped pattern that extends from the Upper Great Lakes region southwestward across Iowa, southeastern Nebraska, and Kansas, which then largely reverses direction and continues eastward across the Middle Mississippi, southern Ohio, and Tennessee Valleys. Soil moisture anomalies are an important consideration for the Seasonal Outlooks through the warm half of the year.
PROGNOSTIC DISCUSSION OF SST FORECASTS
Forecasts of the Niño 3.4 SST index from the North American Multi-Model Ensemble (NMME) are generally in good agreement for a nominal La Niña (Oceanic Niño Index or ONI <=-0.5 degrees C) by June. Most participant model predictions are slightly cooler than the NMME average, with the exceptions of the GFDL SPEAR and Canadian CanCM4i models. The former does not reach the La Niña threshold until mid-August. The International Multi-Model Ensemble (IMME, C3S, or Copernicus) average reaches the La Niña threshold by August. Three of the participant models (German DWD, ECMWF, and METEO-France) stay within the confines of ENSO-neutral limits at least into September, while the UKMO and CMCC are considerably cooler and reach marginal La Niña conditions by late May into June. The CFS is the coldest of solutions, exceeding the minimal La Niña threshold even before MJJ, and predicts a strong La Niña (ONI>=-1.5 degrees C) by July-August-September (JAS) 2024. CPC’s SST Consolidation for the Niño 3.4 region passes into La Niña territory by JJA, peaks during the overlapping seasons of September-October-November (SON) and October-November-December (OND) at -1.4 degrees C (just short of a strong cold event), and then retreats into Neutral territory by March-April-May (MAM) 2025. As noted earlier, CPC’s ENSO Team predicts the transition from El Niño to ENSO-neutral should be completed within the AMJ season (85% chance), with the odds of La Niña developing by JJA (60% chance). Historically, La Niña tends to follow strong El Niño events, adding confidence to the forecast.
30-DAY OUTLOOK DISCUSSION FOR MAY 2024
El Niño conditions are currently observed, and equatorial sea surface temperatures (SSTs) are above average across the much of the central and eastern equatorial Pacific Ocean, reaching 0.9 degrees Celsius above normal in the Niño3.4 region, 0.6 degrees Celsius above normal in the Niño3 region, but have decreased to -0.2 degrees Celsius below normal in the Niño1+2 region. Above average SSTs have weakened across most of the equatorial Pacific Ocean in the last 4 weeks, and tropical Pacific atmospheric anomalies are weakening as well. Given the weakening signals in the equatorial Pacific, a transition from El Niño to El Niño Southern Oscillation (ENSO)-neutral conditions is likely by April-May-June 2024. The Madden Julian Oscillation (MJO) has continued to weaken recently and though there has been eastward propagation in the past week, the amplitude has dropped. Dynamical model forecasts of the Realtime Multivariate MJO (RMM) index through close to the end of April are weak and incoherent due to an emerging low-frequency feature over the western Indian Ocean which appears to be interfering with the MJO. While we may see some lingering impacts to temperature and precipitation due to El Niño, the influence is expected to weaken throughout the next few months. Moreover, the weak amplitude of the MJO does not support much of a teleconnection response over the Contiguous United States (CONUS). As such, the May 2024 Temperature and Precipitation Outlooks are mainly supported by the lingering influence of El Niño, local SST anomalies, influence of soil moisture anomalies, dynamical model guidance from the North American Multi-Model Ensemble (NMME), Copernicus model suite (C3S), and the Climate Forecast System version 2 (CFSv2), as well as statistical models that include the influence of trend and ENSO. The Week 3-4 Outlook for the early part of May was also considered, as was the expected evolution from the Week 2 forecast period.
Temperature
The May 2024 Temperature Outlook favors above normal temperatures over the Northwest, much of the eastern half of the CONUS, and southeastern Alaska. A relatively small region of near normal temperatures is indicated over parts of California, Arizona, Nevada, and Utah. The highest probabilities of above normal temperatures, 50 to 60 percent, are located over Washington, the Great Lakes, northern New England, southeastern New Mexico and parts of southwestern Texas, the southern tip of Florida, and southeastern Alaska. Probabilities are enhanced over these regions given good consistency among tools on above normal probabilities. Decadal trends also support above normal probabilities over the northwest and northern New England. Anomalously warm Great Lakes temperatures provide additional support for above normal probabilities over the region. Lower than normal soil moisture along with forecasted below normal rainfall in dynamical models, and strong probabilities for above normal temperatures in recent CFSv2 forecasts of May temperatures adds to confidence over the Southwest. Signals were more mixed over western Alaska given cooler SST anomalies and sea ice, but NMME and C3S favor a transition to warmer temperatures over the southeast part of the state. Near normal and equal chances of above, near and below normal temperatures (EC) are indicated over southern California and the Four Corners where there are observed coastal below normal to neutral SSTs, near normal temperature forecasts from NMME and C3S, and a below normal CFSv2 temperature forecast. While tools tilt toward above normal temperatures over the Gulf States (particularly coastal regions), partially supported by warmer Gulf of Mexico SSTs, high amounts of recent rainfall over eastern Texas and Louisiana have resulted in high soil moisture, and as such probabilities are still above normal but damped. EC is favored where models were inconsistent and/or where there was a lack of support from statistical tools.
Precipitation
There is more uncertainty in the May 2024 Precipitation Outlook than the Temperature Outlook, as evidenced by lower overall probabilities and larger areas of EC. Models favor above normal precipitation over parts of the central and southern CONUS, including parts of the Mid-Atlantic, Middle Mississippi and Ohio Valley regions. Some lingering influence from El Niño further supports the tilt toward above normal precipitation over the Southeast, as well as enhanced soil moisture. Though El Niño can lead to below normal precipitation over the Great Lakes, Middle Mississippi Valley, and Ohio Valley, this influence is overshadowed by above normal precipitation trend [Authors Note: They are not saying it but the trend is for wetter in those areas which might be attributed to Global Warming. But it could be long cycles also. It is easy to measure the trend but difficult to be sure what is causing it.]. EC is indicated over the Great Lakes where models had weak or inconsistent signals and trend and El Niño influence are opposite. However, over the Mississippi and Ohio Valley regions C3S and NMME favored above normal rainfall and thus a weak tilt toward above normal is indicated. Dynamical models and dry soil moisture led to the favored probability of below normal precipitation over parts of the southwest, which is also indicated in the Seasonal Outlook for May-July 2024. However, this is at odds with the recent Weeks 3-4 Precipitation Outlook for early May that tilted weakly toward above median precipitation. We expect below normal precipitation over the region by mid- to late- May. Tools were again mixed over the northwest, but influences from El Niño and trend tilt the odds toward below normal. Finally, over Alaska, above normal precipitation is favored over the southwest where there has been recent above normal precipitation, with a weak tilt toward below normal precipitation over southeastern Alaska due to expected influence from El Niño.
SUMMARY OF THE OUTLOOK FOR NON-TECHNICAL USERS (Focus on May through July)
During mid-April 2024, an El Niño Advisory remains in effect but the oceanic temperature anomalies associated with El Niño are rapidly fading. There is an 85% chance that ENSO neutral will be in place by the end of the April-May-June (AMJ) season. There is a 60% chance of additional transitioning of the ENSO phase from ENSO Neutral to La Niña by summer (June-July-August, JJA), with La Niña conditions favored to strengthen and continue through boreal autumn and winter. Therefore, a La Niña Watch has also been issued.
Temperature
The May-June-July (MJJ) 2024 temperature outlook favors above-normal seasonal mean temperatures for central and eastern Alaska, the far West excluding southwestern California, and most of the remainder of the Contiguous U.S. (CONUS) with the exception of the north-central states. Maximum probabilities (>50%) favoring above-normal temperatures are indicated over eastern Alaska, parts of the Northwest, the eastern Great Lakes and Northeast, and over New Mexico, southwestern Texas, and southern Florida. For southwestern California, near-normal seasonal mean temperatures are favored. For remaining areas of the CONUS and Alaska, Equal Chances (EC) of below, near, and above-normal seasonal mean temperatures are favored. No areas of favored below-normal temperatures are forecast for the MJJ season.
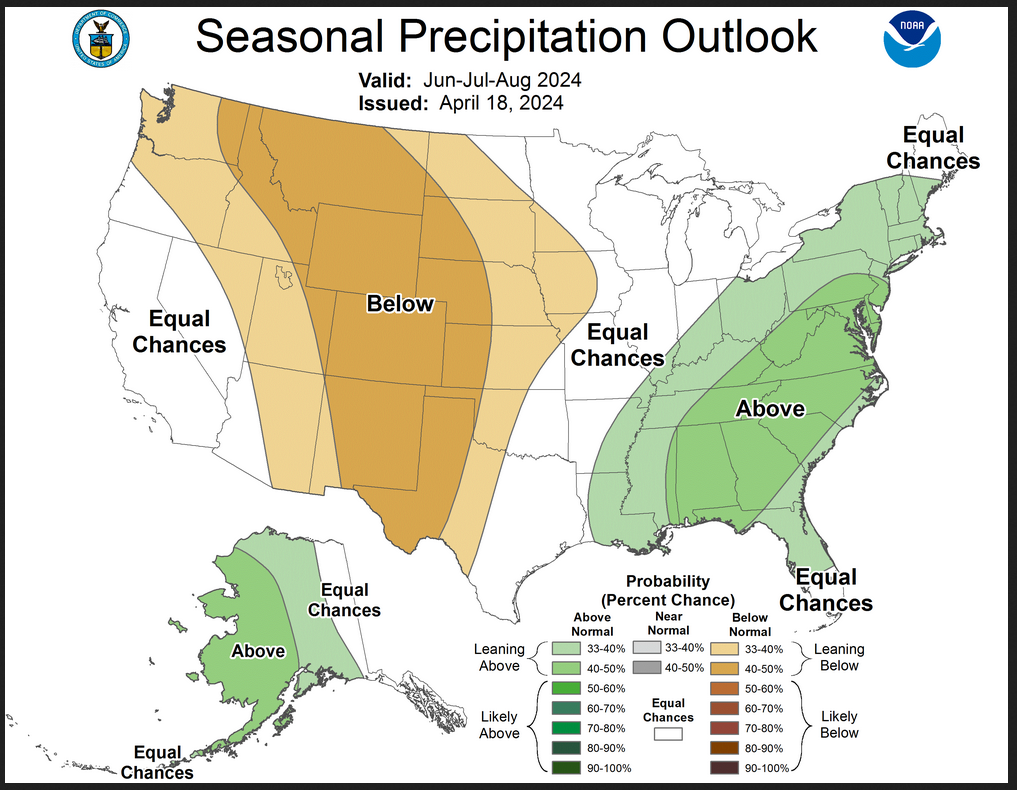
Precipitation
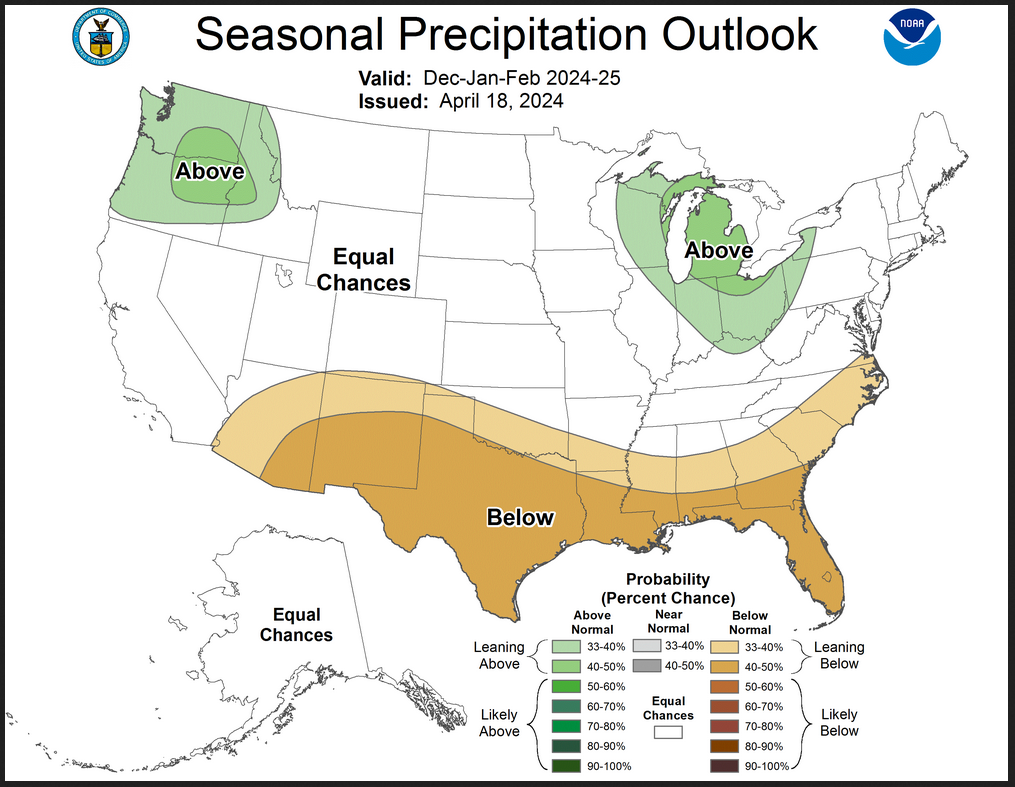
The MJJ 2024 precipitation outlook favors above-normal seasonal total precipitation amounts for approximately the western half of Alaska, and from the southeastern quarter of the CONUS northeastward across the Mid-Atlantic region, southeastern New York state, and southern New England. Below-normal precipitation is favored for parts of the northwestern CONUS, and from eastern sections of Utah and Arizona eastward across Colorado, New Mexico, and much of West Texas. For the remaining areas of the CONUS and Alaska, where seasonal total precipitation amounts are favored to be similar to climatological probabilities, EC is forecast.
BASIS AND SUMMARY OF THE CURRENT LONG-LEAD OUTLOOKS
PROGNOSTIC TOOLS USED FOR U.S. TEMPERATURE AND PRECIPITATION OUTLOOKS
Though some remaining El Niño atmospheric response could extend into the very early stages of the MJJ Outlook, it is unlikely to make a significant difference for the season as a whole. Dynamical model forecasts from the NMME and C3S multi-model ensemble systems are utilized, as is the Calibration, Bridging and Merging (CBaM) tool anchored to the NMME forecasts and “bridged” with the Niño 3.4 index – primarily for temperature outlooks. The Constructed Analog (CA) statistical tools based on SST and soil moisture, along with the ENSO-OCN forecast tool that targets impacts from ENSO as predicted by the CPC consolidation Niño 3.4 SST forecast and long-term trends, played a large role in many of the outlooks. La Niña impacts are considered in the outlooks from JJA 2024 through February-March-April (FMA) 2025.
PROGNOSTIC DISCUSSION OF OUTLOOKS – MJJ 2024 TO MJJ 2025
TEMPERATURE
The MJJ 2024 seasonal temperature outlook favors above-normal seasonal mean temperatures for central and eastern Alaska, the far west excluding southwestern California, and most of the remainder of the CONUS with the exception of the north-central states. Maximum probabilities (>50%) favoring above-normal temperatures are indicated over far eastern Alaska, parts of the Northwest, the eastern Great Lakes and Northeast, and over New Mexico, southwestern Texas, and southern Florida. For southwestern California, near-normal seasonal mean temperatures are favored. The reduced coverage (from last month’s Lead 2 MJJ outlook) of 50%+ probability favoring above-normal temperatures over the Northwest is related to anticipated diminished influences from lagged El Niño impacts, slightly cooler effects of wet soils (through evaporation) over southern Oregon and southern Idaho, and trends. In southwestern California, favored near-normal temperatures is thought to be the best compromise given NMME and C3S SST regional forecasts of near to below-normal in this region extending southward along Baja, during the MJJ season. Near the coast of Southern California, this may be associated with prolonged or more frequent marine layer intrusions, a well-known climatological feature in this region. Across the central portion of the CONUS, anomalous warmth is favored to replace the southern part of the EC region (from last month’s MJJ Outlook), and is favored by statistical and dynamical model guidance. The recent very heavy rainfall (8-10+ inches) and severe weather over the Ark-La-Tex region and Lower Mississippi Valley is the reason behind the slightly lower odds favoring above-normal temperatures in that area. Model guidance and trends (as shown by the OCN tool) favor relative maxima in probabilities for above-normal temperatures across New Mexico and southwestern Texas, and from the eastern Great Lakes region to the Northeast and Mid-Atlantic coasts. Most tools support above-normal temperatures across the Southeast. To the north, the outlook for Alaska is based on a subjective consensus of model guidance, temperature trends, and anticipated residual influences from sea ice.
For JJA and JAS 2024, the favored above-normal temperatures in central and eastern Alaska from the preceding MJJ outlook are expected to decrease in coverage and gradually become concentrated over the far northern part of the state. In JJA, favored below-normal temperatures are depicted over the southwest portion of the Mainland and the adjacent Alaska Peninsula, spreading eastward across the southern coast with time. This is partly due to the anticipated emerging effects of La Niña, and supported by the ENSO-OCN tool and the Statistical Consolidation (Stat-CON). For the CONUS, probabilities favoring above-normal temperatures exceed 50% for most of the interior West and south-central states, warranted by the ENSO-OCN, Stat-CON, Dynamical Consolidation (NMME-CON), and a skill-weighted mean of the two CON tools (the Final CON). This is also consistent with most other tools, such as the CBaM tool, the IMME, and longer-term trends. The favored area of EC in the vicinity of the Dakotas in JJA gradually gives way to favored above-normal temperatures in JAS 2024, consistent with emerging influences of La Niña. The three CON tools and trends favor elevated probabilities for above-normal temperatures in the vicinity of the Northeast CONUS. In August-September-October (ASO), the probabilities favoring above-normal temperatures begin to decline over the Pacific Northwest, in preparation for the typical La Niña impacts that set up during boreal autumn and winter.
During SON through November-December-January (NDJ) 2024, the temperature outlooks favor a canonical La Niña response, with above-normal temperatures in the Northwest and north-central CONUS giving way to EC, and to below-normal temperatures across the Pacific Northwest by NDJ. Above-normal temperatures are depicted across much of the southern and eastern CONUS, also consistent with a cold event. During this period, SON through NDJ 2024, ENSO composites gradually begin to favor a replacement of the below-normal temperatures across southern Alaska to EC, and the expansion of favored anomalous warmth across northern and western Alaska. SON is the most likely season for high probabilities (>60%) for favored above-normal temperatures across the northwestern coast of Alaska due to the seasonally delayed onset of sea ice formation. From December-January-February (DJF) 2024-25 through MAM 2025, La Niña composites are primarily used in conjunction with model guidance. For the final two leads, AMJ and MJJ 2025, temperature trends are heavily utilized. For remaining areas of the CONUS and Alaska, EC favored.
PRECIPITATION
The MJJ 2024 seasonal precipitation outlook favors above-normal seasonal total precipitation amounts for approximately the western half of Alaska, and from the southeastern quarter of the CONUS northeastward across the Mid-Atlantic region, southeastern New York state, and southern New England. These anomalies are generally consistent with NMME & C3S multi-model ensemble guidance, CFS, and trends. Below-normal precipitation is favored for parts of the northwestern CONUS, mostly from ENSO-OCN and the last vestiges of lagged El Niño influences. Anomalous dryness is favored from much of the Four Corners region to West Texas. This is consistent with the three CON tools, CFS, C3S, NMME, and to some extent, the SST Constructed Analog (SST-CA) statistical tool. There is also a significant negative correlation between this strong dry signal over the eastern Monsoon region and abundant snowpack over the Central Rockies (Colorado and Utah). Historically, this correlation favors a slow start to, and potential underperformance of, the Southwest Monsoon. For the remaining areas of the CONUS and Alaska, where seasonal total precipitation amounts are favored to be similar to climatological probabilities, EC is forecast.
From JJA and JAS 2024, widespread above-normal precipitation is favored in Alaska, consistent with NMME guidance. Afterwards, there is a slight tilt in the odds towards below-normal precipitation for Southeast Alaska for SON through NDJ 2024. From SON 2024 to MAM 2025, the main climate driver/forcing is the anticipated La Niña, which favors an enhanced storm track and above-normal precipitation amounts across the northwestern states, and also (starting with DJF 2024-25) over the Great Lakes and Ohio/Tennessee Valleys. Enhanced dryness and below-normal precipitation amounts are favored across much of the southern CONUS and Eastern Seaboard. For the last two leads, April-May-June (AMJ) and MJJ 2025, the seasonal precipitation outlooks are largely based on trends.
The key piece of information used by NOAA follows.
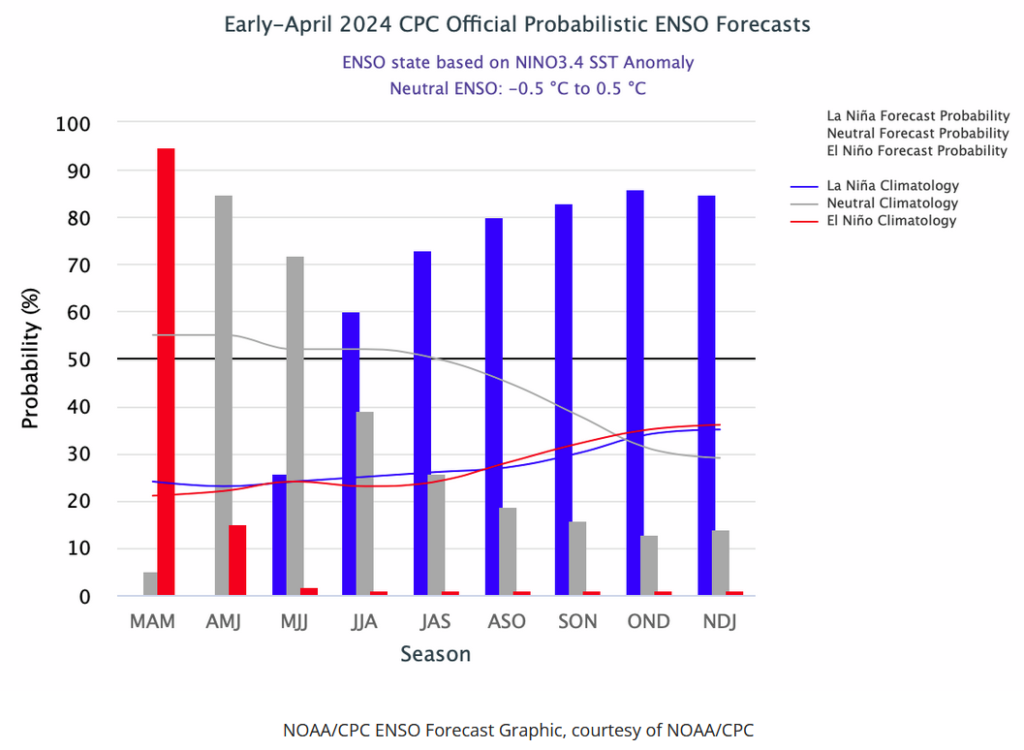
| It looks like El Nino early in the forecast period. It quickly changes to ENSO Neutral and by summer is La Nina which continues through the forecast period shown. |
Resources
–
| I hope you found this article interesting and useful. |
–