Much of the information in this report comes from the monthly emails I receive from John Bateman. He does public outreach for NOAA and in particular NCEI. I could find the same information and more on the NCEI website but John Bateman produces a good summary so I use it or most of it. I also add additional information from NCEI or other NOAA websites. At the end of the article, I provide two links that will get you to the full reports and much additional information.

I start with the trends of February Temperature looking at first CONUS, then all of North America and then the World both land and water.
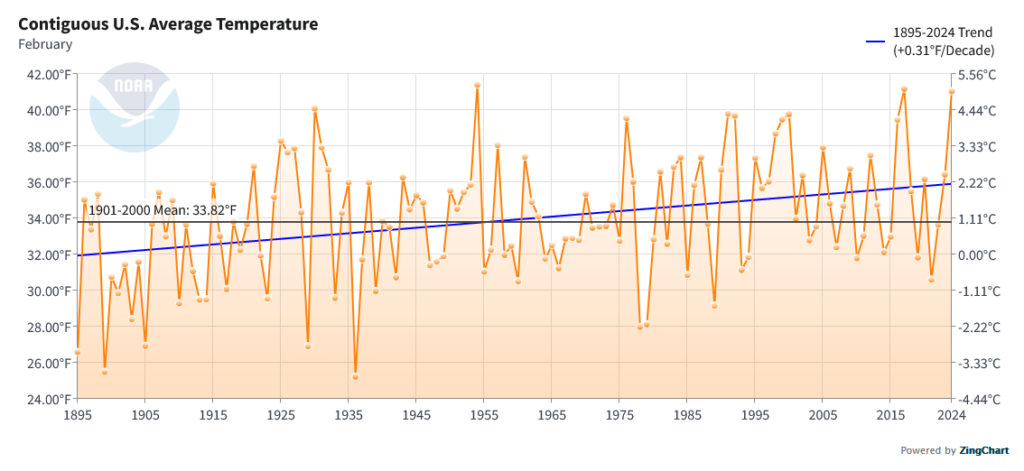
| This is the temperature trend for CONUS. There was a decrease for February in 2024 as compared to February in 2023. I show all the data for February starting with 1895. |
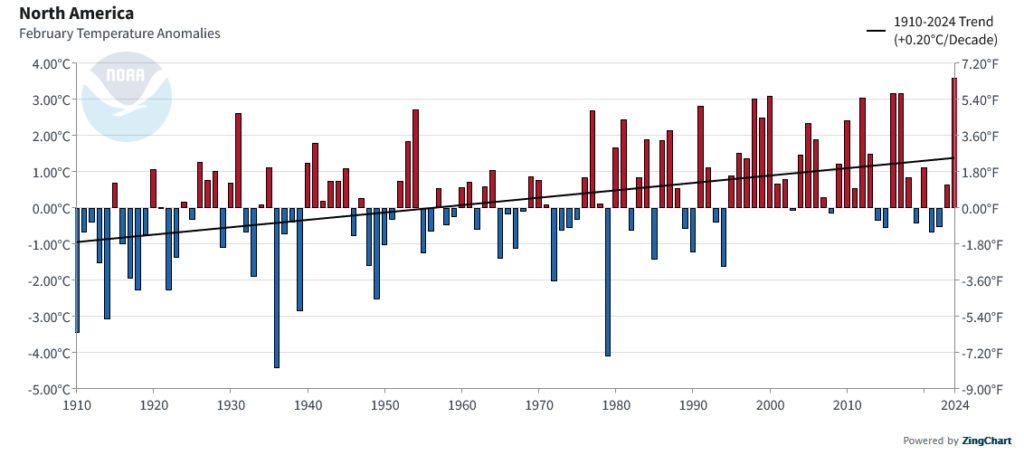
| This is the temperature trend for North America. It covers a larger geographical area but I find it easier to read. |
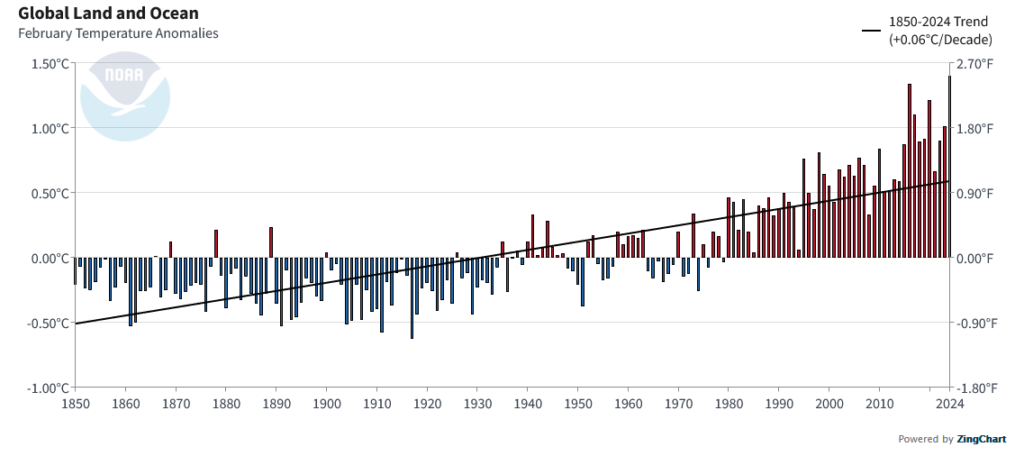
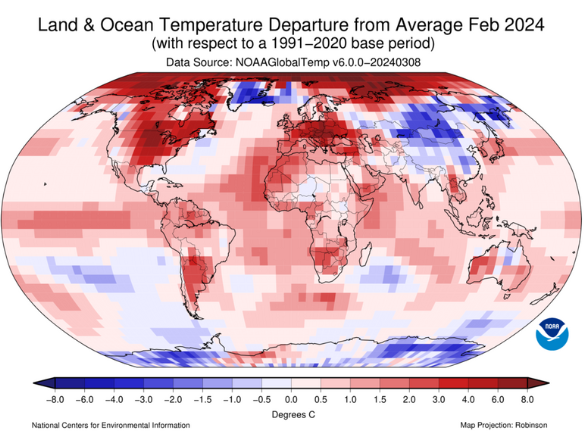
| The temperature for the world, land and water hit a new record. |
To read the rest of this article some will have to click on “Read More”.
Now we present the rest of Bateman’s article for U.S Climate in February of 2024
Here I add the State Rankings for January of 2024.
![]()
| Four states set records in February. |
![]()
| When looking at maximum temperatures six states set a record. |
![]()
![]()
| But when looking at minimum temperatures, no states set a record but many were very warm. This tends to happen when there is less moisture in the air or if it is breezy so things cool off a bit at night. |
![]()
| No records for precipitation but many states were much below average and Nevada was much above average. |
![]()
| Sometimes looking at climate divisions within states can be useful. Here we see a number of climate divisions that have set records for dryness. |
Now we present Bateman’s article for Global Climate in January of 2024 I have not added anything but I did not include the three-month comparisons.
Useful Resources Include:
Climate at a Glance which can be accessed HERE
NCEI Monthly Report which can be accessed HERE
–
| I hope you found this article interesting and useful. |
–
Interesting that the mean for CONUS is around freezing on a 24-7-365 basis. .31 degrees per decade mounts up after 120+ years. The February deviation chart was also interesting.
There is a lot that is interesting in that article. Thanks for reading it so closely. I only included the February information. With the two links at the end of the article, you can get all sorts of data. Global warming is a slow process but it has impacts. You noticed that February is a month where the impacts might be noticed more rapidly than in some other months. Less snow and more rain in February is not necessarily a good thing for many parts of the Northern Hemisphere. It is not good for most farming but it is good for wildfires as it creates the fuel they need a few months later.