On the second Thursday of every month, NOAA (really their Climate Prediction Center CPC) issues its analysis of the status of ENSO. This includes determining the Alert System Status. NOAA again describes their conclusion as “ENSO Alert System Status: El Nino Advisory La Nino Watch”
The exact timing of the transition is not very clear which will impact the reliability of the Seasonal Outlook to be issued next Thursday.
We have included an ENSO Blog article by Emily Becker.
CLIMATE PREDICTION CENTER ENSO DISCUSSION
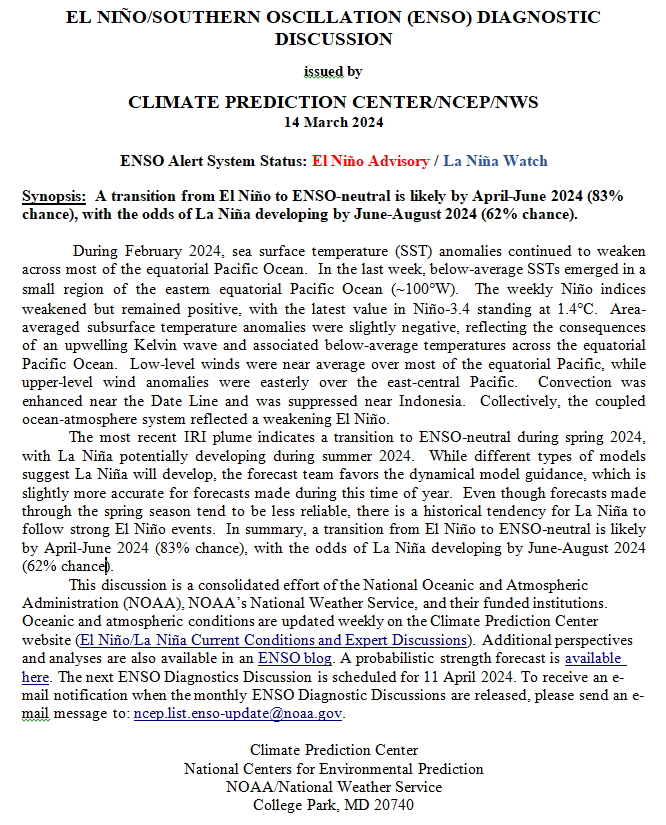
| The second paragraph is what is important:
“The most recent IRI plume indicates a transition to ENSO-neutral during spring 2024, with La Niña potentially developing during summer 2024 . While different types of models suggest La Niña will develop, the forecast team favors the dynamical model guidance, which is slightly more accurate for forecasts made during this time of year. Even though forecasts made through the spring season tend to be less reliable, there is a historical tendency for La Niña to follow strong El Niño events. In summary, a transition from El Niño to ENSO-neutral is likely by April-June 2024 (83% chance), with the odds of La Niña developing by June-August 2024 (62% chance).” Below is the middle paragraph from the discussion last month. “The most recent IRI plume indicates a transition to ENSO-neutral during spring 2024, with La Niña potentially developing during summer 2024. Even though forecasts made through the spring season tend to be less reliable, there is a historical tendency for La Niña to follow strong El Niño events. The forecast team is in agreement with the latest model guidance, with some uncertainty around the timing of transitions to ENSO-neutral and, following that, La Niña. Even as the current El Niño weakens, impacts on the United States could persist through April 2024 (see CPC seasonal outlooks for probabilities of temperature and precipitation). In summary, a transition from El Niño to ENSO-neutral is likely by April-June 2024 (79% chance), with increasing odds of La Niña developing in June-August 2024 (55% chance).” |
We now provide additional details. The level of uncertainty with respect to how this El Nino will play out has not changed very much.
CPC Probability Distribution
Here are the new forecast probabilities. The probabilities are for three-month periods e.g. FMA stands for February/March/April.
Here is the current release of the probabilities:
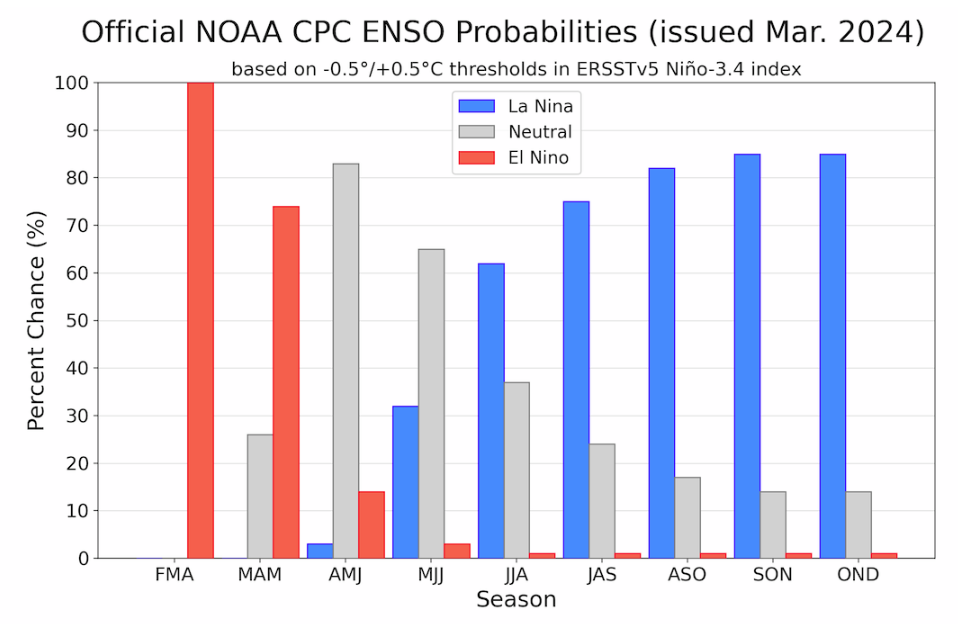
| This chart shows the forecasted progression of the evolution of ENSO from the current El Nino State to Neutral and by the summer to La Nina. This kind of bar chart is not very good at showing uncertainty. |
Here is the forecast from last month.

| The analysis this month and last month are not very different. |
What Does the NOAA Proprietary ENSO Model Forecast?
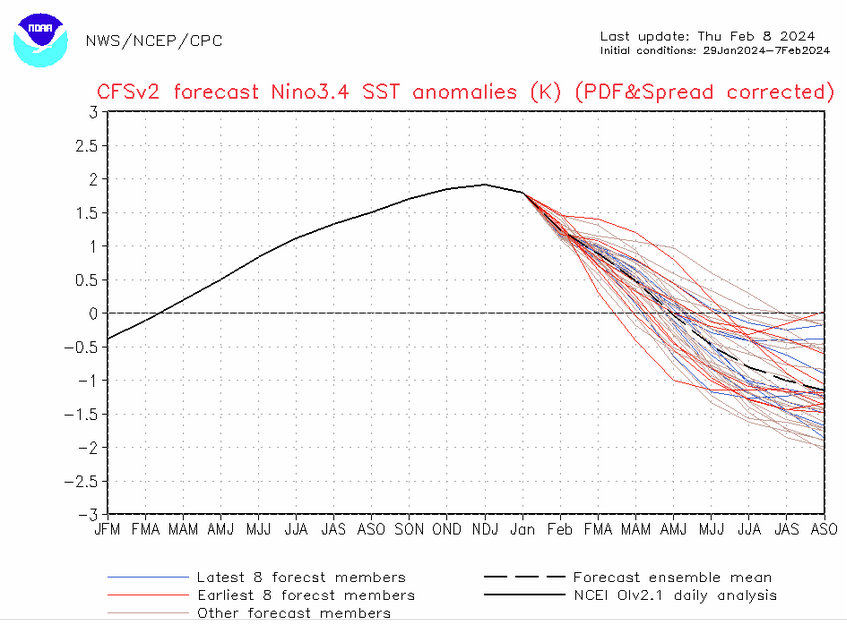
| This seems off. Notice the wide spread of the solutions. We will discuss that later in the article. If you want to see an updated version you can view an updated version by clicking HERE. So this is not the official CPC forecast but a secondary tool that they use. |
View of other Models.

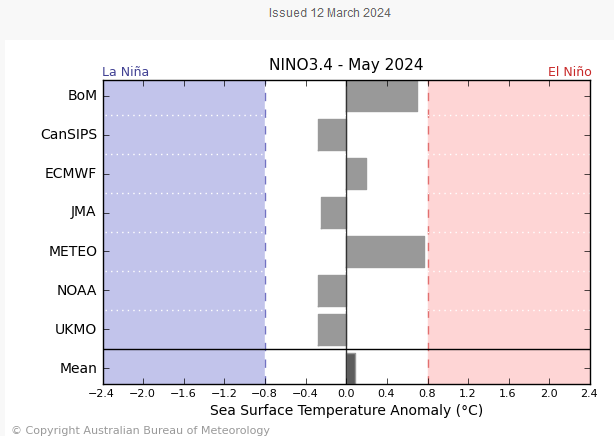
| The NOAA proprietary model forecast for the timing of the decline of the NINO 3.4 Index is now quicker than the others in this small collection of model results prepared by the Australian Bureau of Meteorology. However, NOAA does not rely on that model and uses a different approach. Look at what some of the models are predicting for May. None show us in La Nina and others still show us in El Nino remembering that the BOM uses + or – 0.8C as the threshold while most use + or – 0.5C. |
I do not yet have the JAMSTEC forecasts. (Actually I do. I just received them today but decided to not include them in this article. Clearly what remains of the El Nino is a Modoki. I do not need to look at the index to know that.
Looking at Actual Current Conditions.
NOAA reports some derived data that describes the current situation and a forecast. But what if we want to form our own opinion? After all, meteorologists are looking at the actual current situation and making predictions.
This shows the current actual situation for the surface of oceans. To update this graphic click HERE.
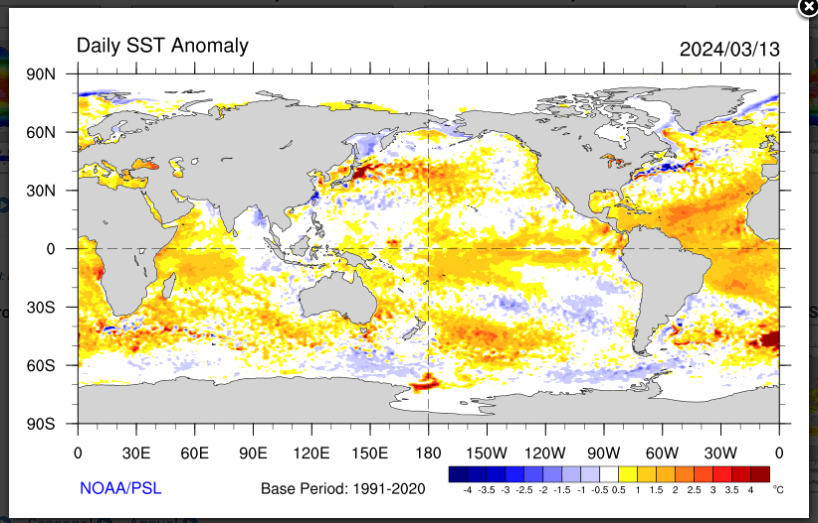
| You can see the warm tongue of water extending from Ecuador and Peru. It is increasingly separating from South America and it is not colored very dark red. It has some Modoki characteristics. We are discussing ENSO tonight but you can see a lot of interesting things here. It is only a one-day snapshot so keep that in mind. There is not much warm water along any coast of the United States. The situation for South America and the Western Caribbean is different. |
Putting the historical information in motion. Updates can be found HERE. but should not be needed.

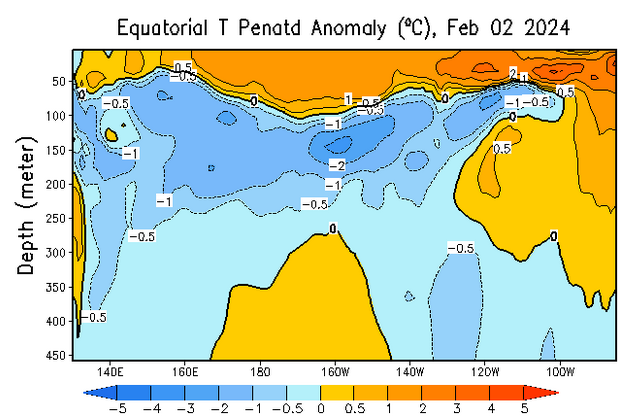
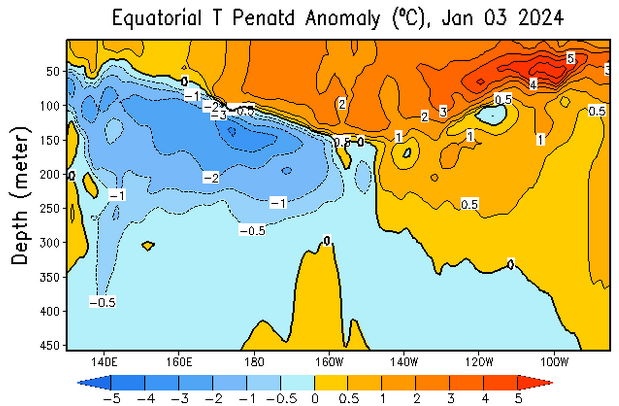
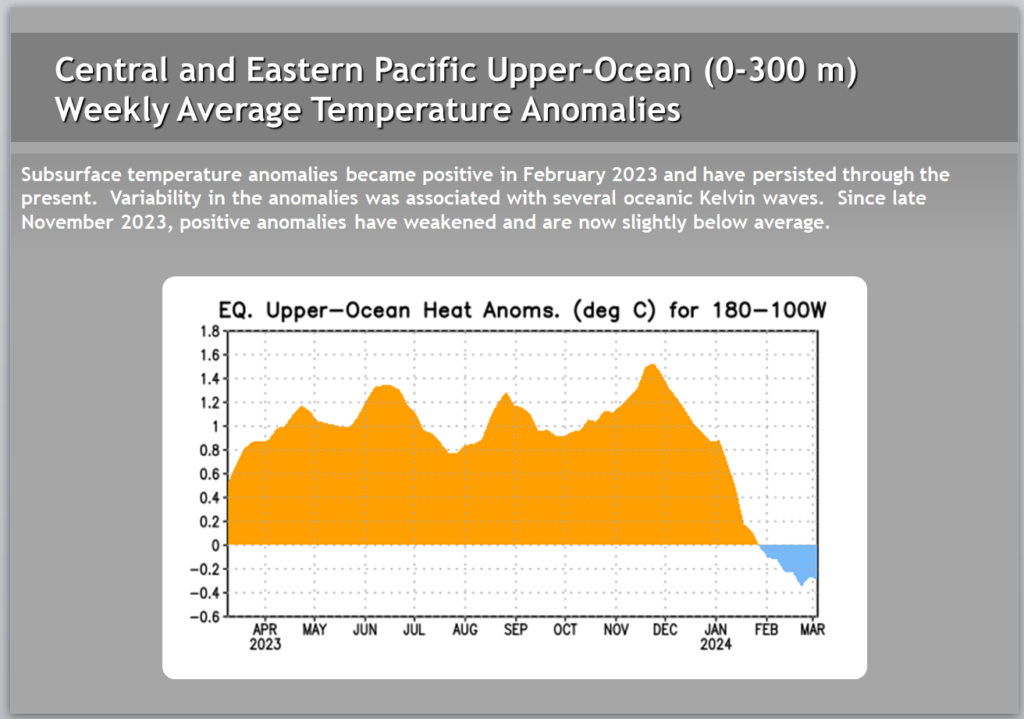
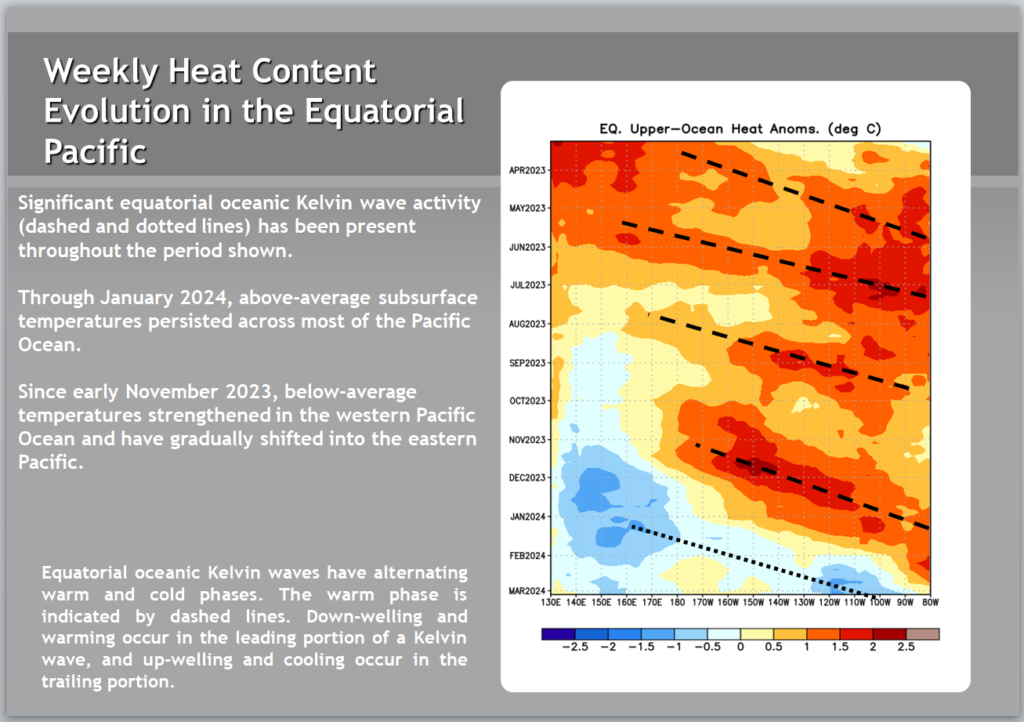
Now we look at the below surface temperature anomalies. Mapping the details. (Cross-Section along the Equator). The data is a five-day average centered on the date shown.
Here is the new map followed by the prior two graphics. The undercutting of the warm water by the cooler water is clear but when does it reach the surface?
![]()
![]()
| There is not a lot of warm water on the surface and an increasing amount of cooler water below it. The Indo-Pacific Warm Pool is pretty much spent. El Nino’s days are numbered but the timing is not clear but very soon. |
| This shows the water column anomaly is now negative i.e. the warmer water near the surface is dominated by the cooler water below. |
Another Kelvin Wave would maintain or increase the Nino 3.4 Index at least in the short term. But what we see is just the cool upwelling of the prior Kelvin Wave.
Is the response of the atmosphere sufficient to sustain an El Nino?

| The recent rise in the SOI may mean the atmosphere is not fully responding to the warmer sea surface temperatures. That is not talked about very much. The SOI is now solidly in ENSO Neutral territory. |
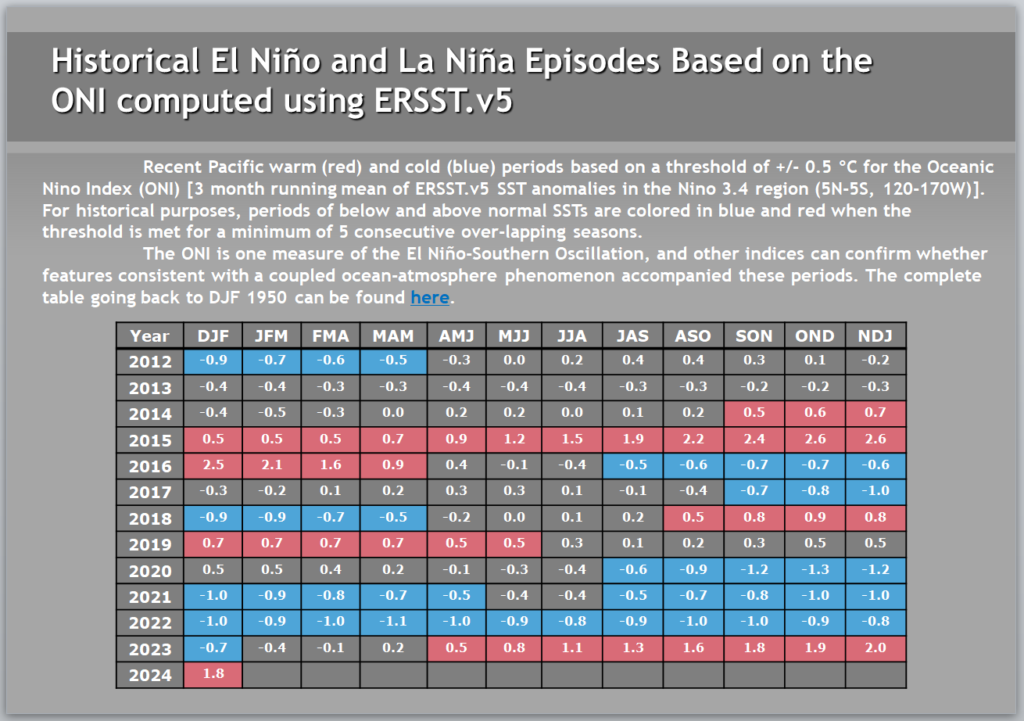
| This shows the recent historical ONI readings. The ONI readings are the average of the Nino 3.4 reading over a three-month period. The pattern is interesting and suggests this El Nino may survive a bit longer |
Now we present the recent ENSO Blog Post by Emily Becker.
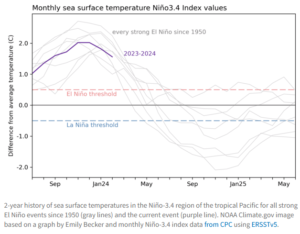
| This shows how the current El Nino compares to recent very strong El Ninos. This one peaked a bit earlier than many other strong El Ninos. |
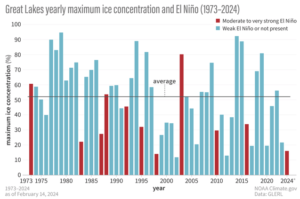
| Is there a pattern here? |
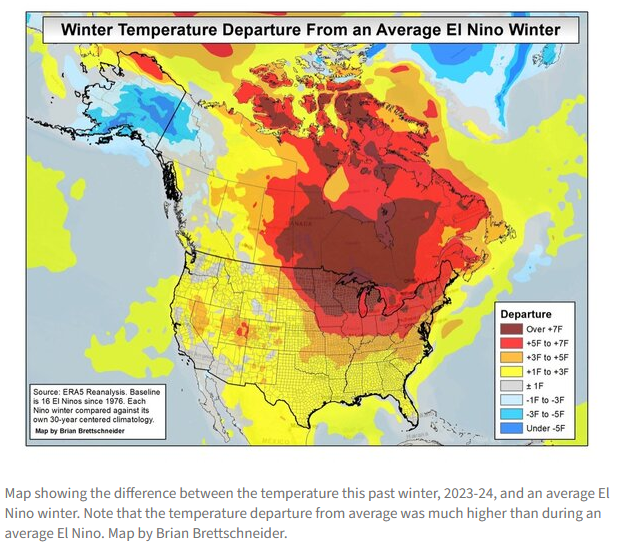
| Here we show the winter temperature deviation from an average El Nino Winter and it is huge. |
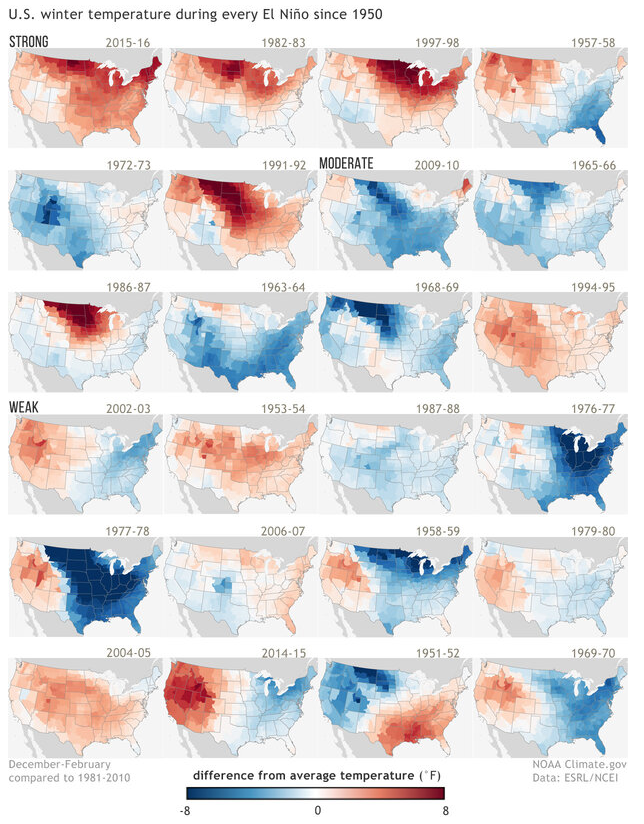
| Usually, we show how El Nino winters vary by precipitation but this one shows the variation by temperature. I am always happy when I find these graphics as creating them would be a lot of work. |
| I hope you found this article interesting and useful. |