This is the most recent Snow Drought Report. I am not sure why they name it the way they do as the report can show both deficits and surpluses in the water stored in snowpack as of a particular date.
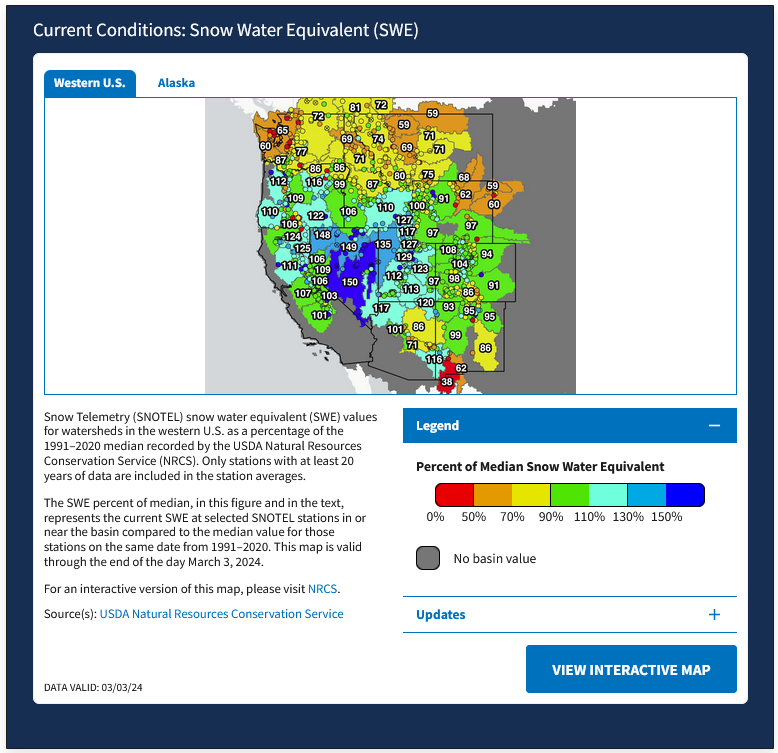
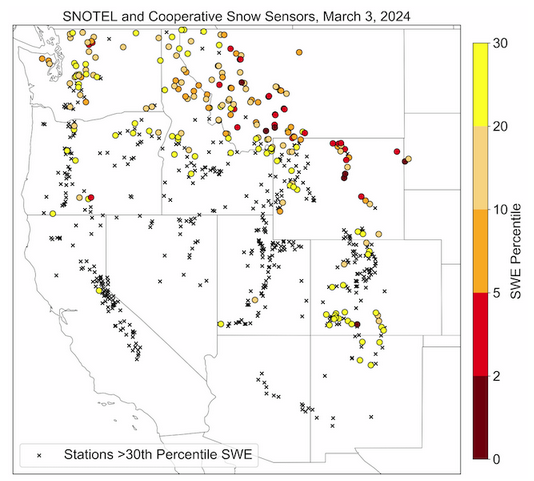
I have included some of the links that were in the NOAA article but if you want all of them you can find them HERE. All of the material in this article is from the NOAA article except for some comments from me which are in boxes so you can tell that those are my comments. The main graphic in this section is the situation on March 3. Updates to that graphic can be obtained HERE but the NOAA discussion is based on the situation as of the end of the day on March 3.
Some may have to click on “Read More” to read the rest of this article.
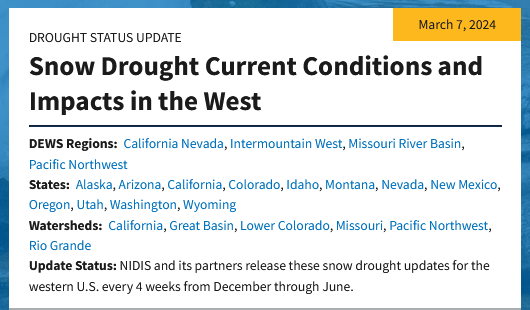
- Rocky Mountain Snow Conditions
- New Mexico and Arizona Snow Conditions
- Cascade Range Snow Conditions
- Sierra Nevada and Great Basin Snow Conditions
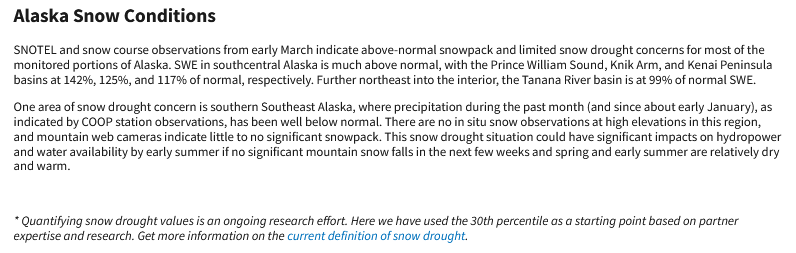
- Alaska Snow Conditions

![]()
![]()
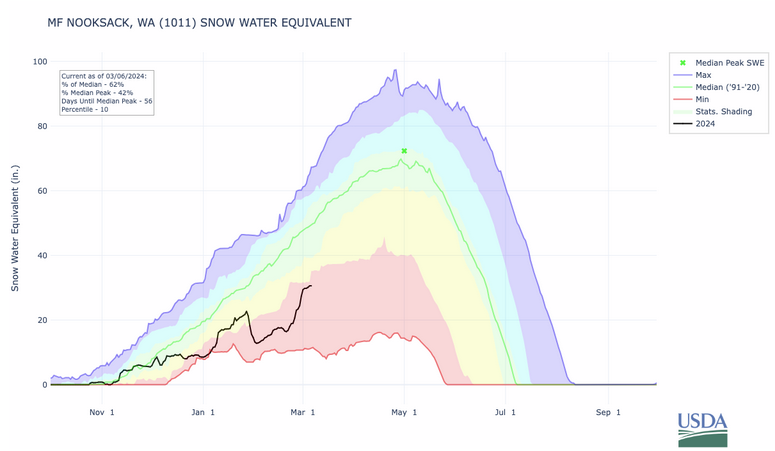
| This show the situation versus the minimum, recent year peak yer etc. It is running behind. |
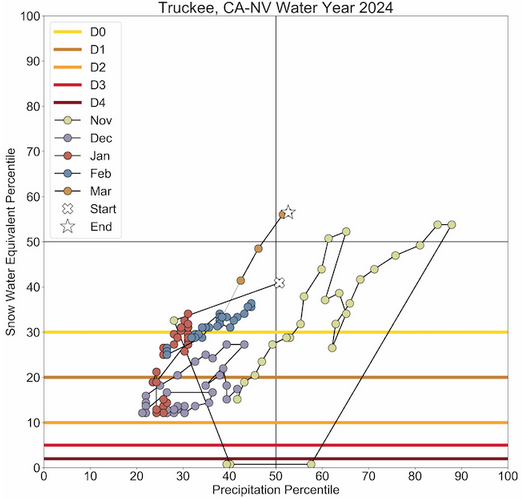

| The way to read this chart is to look for the symbol that says start and the symbol that says end and it shows by day the ratio of the precipitation percent of normal to the SWE which is the water stored in snowpack. The months are color-coded to make it easier to see the ups and downs in the data. What does this chart actually show? I think it shows how much SWE was “lost” to early snowmelt or excessive sublimation but I am not totally sure. There is a lot of information packed into this sort of graphic. |
–
| I hope you found this article interesting and useful. |
–