At the end of every month, NOAA updates its Outlook for the following month which in this case is March of 2024. We are reporting on that tonight.
There have been some significant changes in the Outlook for March and these are addressed in the NOAA Discussion so it is well worth reading. We provided the prior Mid-Month Outlook for March for comparison. It is easy to see the changes by comparing the Mid-Month and Updated Maps.
The article includes the Drought Outlook for March. NOAA also adjusted the previously issued Seasonal (MAM) Drought Outlook to reflect the changes in the March Drought Outlook. We have included a map showing the amount of water in the snowpack waiting to be released in the Spring. We also provide the Week 2/3 Tropical Outlook for the World. We also include a very interesting CLIMAS Discussion.
The best way to understand the updated outlook for March is to view the maps and read the NOAA discussion. I have highlighted the key statements in the NOAA Discussion.
Here is the updated Outlook for March 2024.
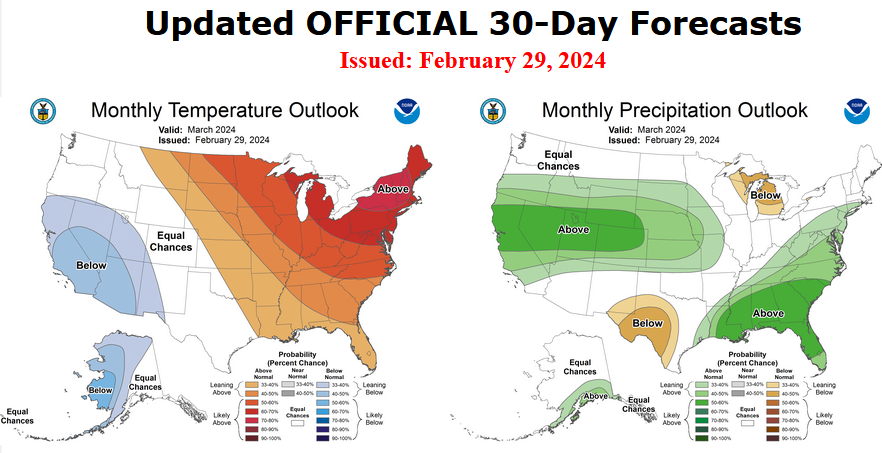
For Comparison Purposes, Here is the earlier Mid-Month Outlook for March.
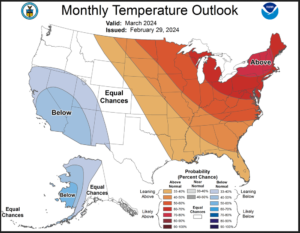
| There have been some significant changes especially related to temperature. Remember, it is the top set of maps that are the current outlook for March. |
Combination of the Updated Outlook for March and the Three-Month Outlook
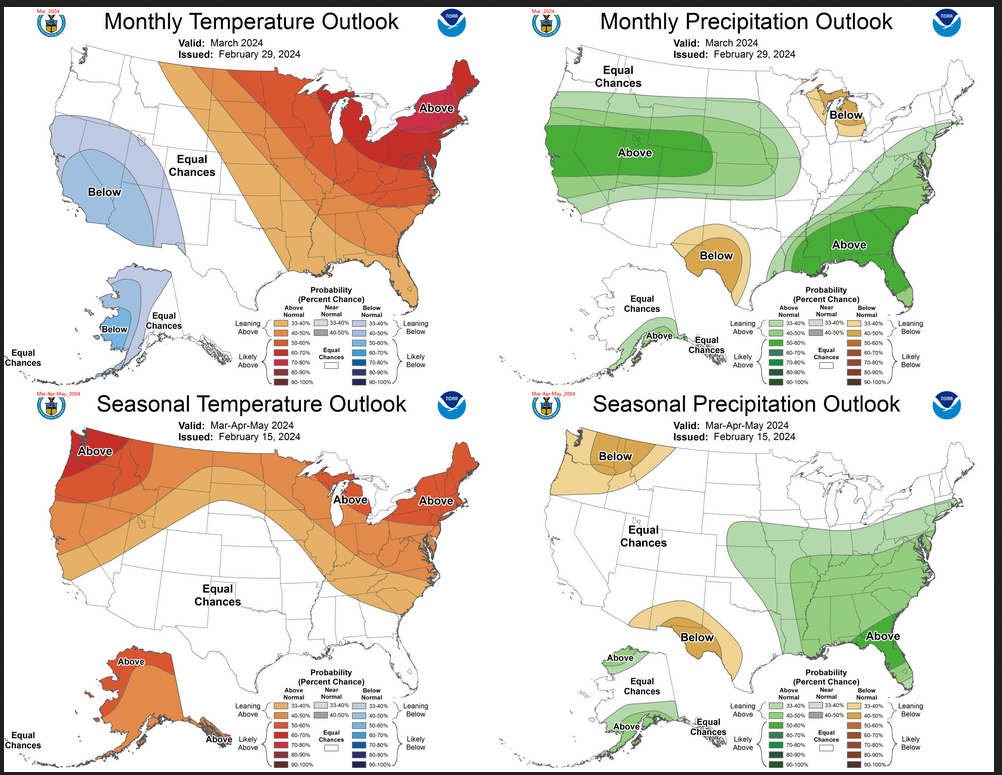
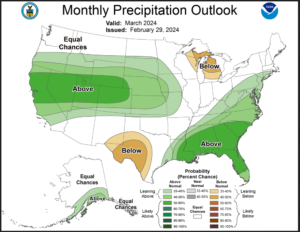
| The top row is the Updated Outlook for the new month. There is a temperature map and a precipitation map. The second row is a three-month outlook that includes the new month. I think the outlook maps are self-explanatory. What is important to remember is that they show deviations from the current definition of normal which is the period 1991 through 2020. So this is not a forecast of the absolute value of temperature or precipitation but the change from what is defined as normal or to use the technical term climatology. |
| The three-month map was issued on February 15, 2024. One expects some changes 14 days later. But the change to the precipitation map is not very dramatic. This then gives us no reason to question the three-month MAM precipitation Outlook. |
| Our regular Daily Weather article can be found HERE. In addition to the short-term forecast it also provides the 6 – 10 day, 8 – 14 day, and Week 3 – 4 Outlooks. That is not a full month but close to it. So it is helpful if one wants to understand how the full-month forecast is expected to vary through the month. And the maps in the Daily Article update throughout the month. |
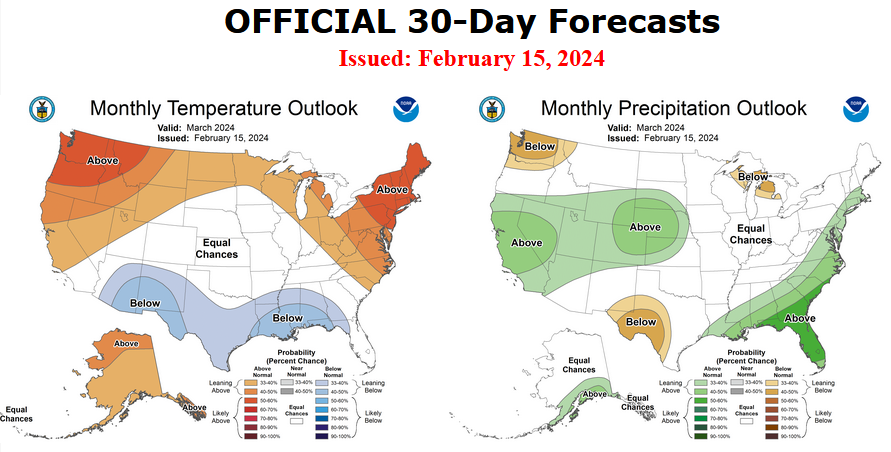
Here are larger versions of the Temperature and Precipitation Outlook maps.
NOAA (Really the National Weather Service Climate Prediction Division CPC) Discussion. I have shown certain important points in bold type. My comments if any are in brackets [ ].
30-DAY OUTLOOK DISCUSSION FOR MARCH 2024
Much of the forecast thinking from the middle of February for the March temperature and precipitation outlooks remains in place for this end of the month update. Overall, any significant outlook changes are limited to Alaska and the northern and central Far West in the temperature outlook. The primary changes in the updated precipitation outlook are for increases in forecast coverage and odds for above-normal monthly precipitation amounts in many areas.
A brief summary update of the climate predictors outlined in the mid-month discussion as important for the forecast remain generally unchanged. The MJO remains active with the enhanced convection phase entering and further re-organizing in the Indian Ocean and model forecasts of the RMM index are quite impressive and consistent among ensemble model predictions.
Although another SSW is forecast within the next several days, previous events this winter have not had much duration nor impacts in the troposphere and it is unclear whether this latest predicted warming will be any different. The two week forecasts of the AO index (phase and amplitude) have been extremely poor this winter from both the GEFS and ECMWF ensemble prediction systems. Given these factors, it is not possible to reliably include any potential SSW related impacts that may occur in late March for the updated temperature outlook. [Author’s Note: Quite an admission]
Temperature
The MJO is forecast over the next two weeks to strengthen in amplitude and coherence and propagate eastward across the Maritime continent during the first half of March. This evolution favors ridging for eastern North America and above-normal temperatures for the eastern CONUS entering mid-March which may continue for the following 1-2 weeks. This combined with forecast ridging and very large positive temperature anomalies during the first two weeks of March – as indicated by short-, medium- and extended-range model guidance – supports high odds for above-normal monthly mean temperatures for the Great Lakes, Ohio Valley, mid-Atlantic and Northeast.
Both troughing during the first 1-2 weeks of March over the Southwest CONUS and MJO considerations (similar forcing) is the reason for expanding the highlighted area of favored below-normal temperatures in the Southwest U.S. at mid-month to now include California, Nevada and Utah and removing favored above-normal temperatures for northern and central areas of the Far West. Model predictions during the first couple of weeks in March warrant a change in the outlook for Alaska for enhanced odds for below-normal temperatures in the monthly update. Large deficits in snow cover and snow depth compared to normal also contribute to enhanced probabilities of above-normal temperatures for the northern tier of the U.S. from the High plains to the Northeast.
Precipitation
The precipitation outlook for the monthly update is largely unchanged from the mid-month first release. All factors discussed at mid-month remain on track and the latest guidance across time scales is consistent in most ways with the original outlook. The changes are mainly related to increases in forecast coverage and probabilities for above-normal monthly total precipitation amounts for the regions from the West coast to the central Great Plains and from the central Gulf coast into the Southeast. The main significant change is the removal of favored below-normal precipitation for the extreme Pacific Northwest where an active period during the first 2 weeks of March is likely to lead to significant precipitation amounts.
Drought Outlook
Here is the newly issued Drought Outlook for the month.
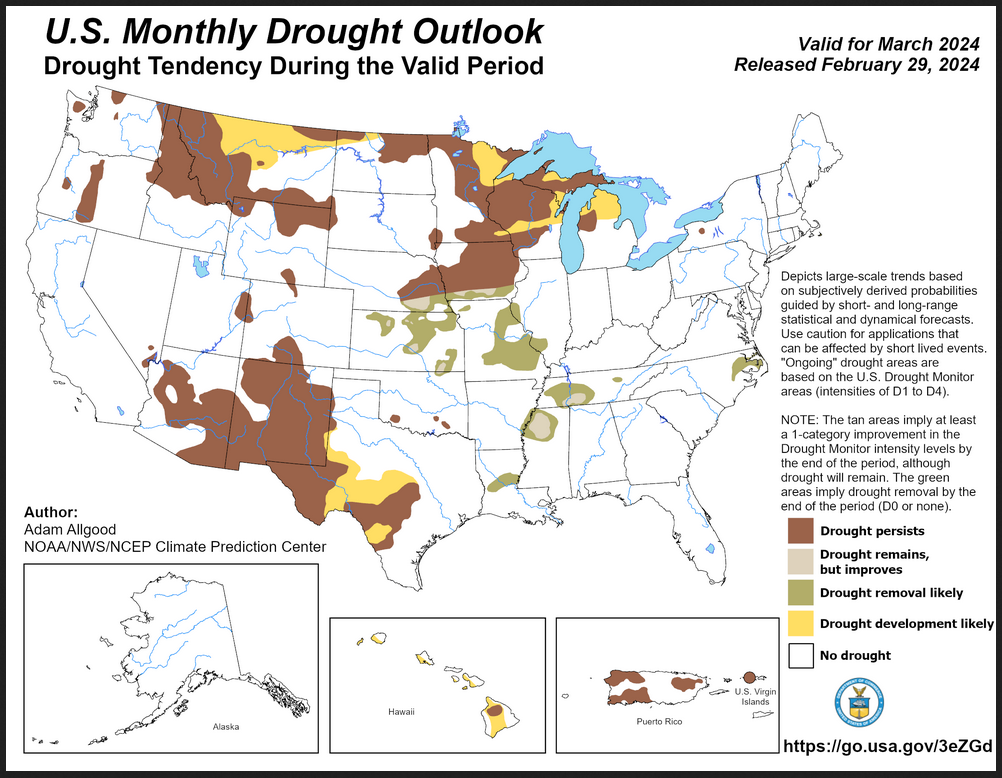
| You can see where drought development or reduction is likely. Overall the forecast is for a rough balance between drought is reduced and where it is expanded or enhanced. The summary and detailed discussions that accompany this graphic can be accessed HERE, but the short version is shown below. |
Here is the short version of the drought summary
Latest Monthly Assessment – During March, El Niño is favored to remain a strong influencer of climate anomalies across the US; however, the atmospheric response has begun to weaken, and a gradual transition towards ENSO neutral conditions is favored during the Spring. During February, a series of atmospheric river events brought copious moisture to portions of California and the Great Basin, easing drought conditions, though snowpack conditions remain well below average across the far southern Sierra Nevadas, the Cascades, and the Olympic ranges in Washington. A lack of snow cover coupled with much above-normal temperatures promoted an early thaw of soils across much of the northern tier, which caused an unusually rapid expansion of drought conditions given the time of year. Drought conditions continued to ease along the lower Mississippi Valley, but expanded across portions of western Texas due to warm and windy conditions, and a growing precipitation deficit led to moderate drought developing across eastern North Carolina.
During March, persistent warmth along the northern tier will continue to thaw soils and promote winter crops to break dormancy early. With increasing evapotranspirative demand coupled with little to no snow cover, continued drought development is favored along the northern tier. Additional development is also favored for western Texas, with no major changes to the pattern expected during March. While a series of storms will bring copious precipitation to the West Coast, including the Cascades and Sierras, it is unclear whether this late season moisture will substantively overcome the large deficits that have grown throughout the water season to date. In contrast, drought improvements are favored for portions of the Great Plains, lower to mid-Mississippi Valley, and the Southeast, with the updated monthly precipitation outlook favoring above-normal precipitation across these regions, coupled with a gradually wetter climatology across the Midwest.
We also have an updated Seasonal Drought Outlook (link).
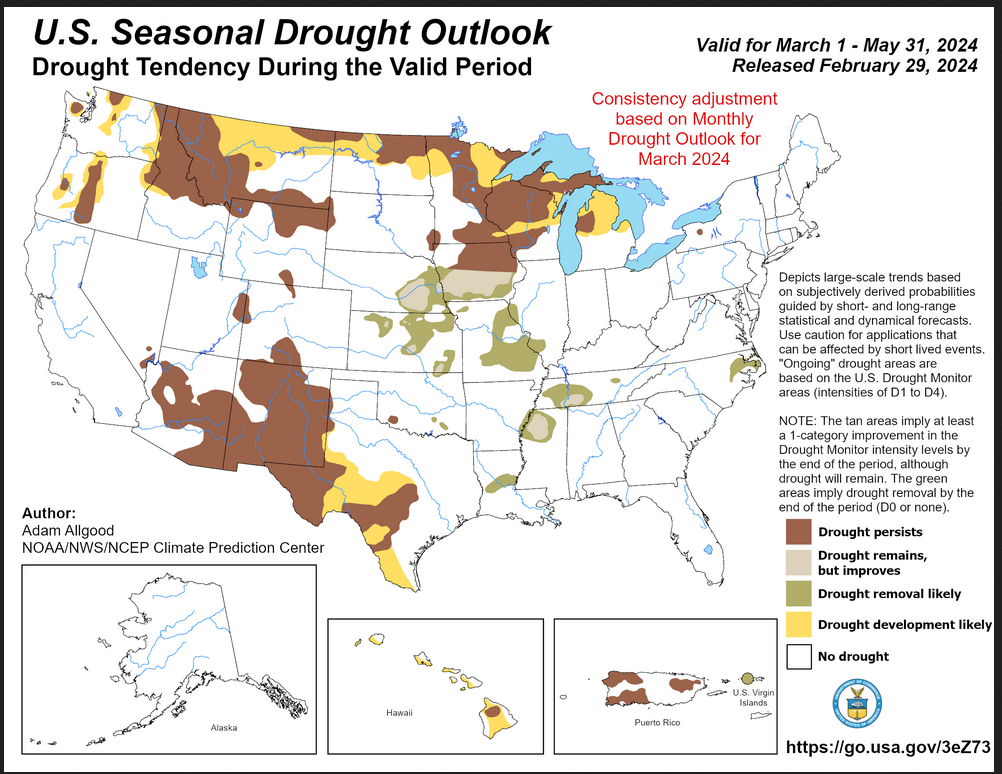
| This three-month outlook is only a bit different than the single-month outlook and it covers a longer period of time. |
| To update this forecast (which updates on Tuesdays) click HERE |
Month-to-date Temperature as the current month evolves can be found at https://hprcc.unl.edu/products/maps/acis/MonthTDeptUS.png
Month-to-date Precipitation as the current month evolves can be found at https://hprcc.unl.edu/products/maps/acis/MonthPNormUS.png
CLIMAS Southwest Climate Report.
This month it is mostly a review of prior months but it has a podcast embedded in it. It was just issued but the forecast maps in my article are more up to day but not very different as the outlook has not changed much. To access this report, click HERE.
Current SWE which is a good predictor of Spring Runoff.
Current snow-water equivalent in the snowpack. This is the water in the snow which hopefully will survive evaporation and sublimation and melt during the Spring. Here is the LINK
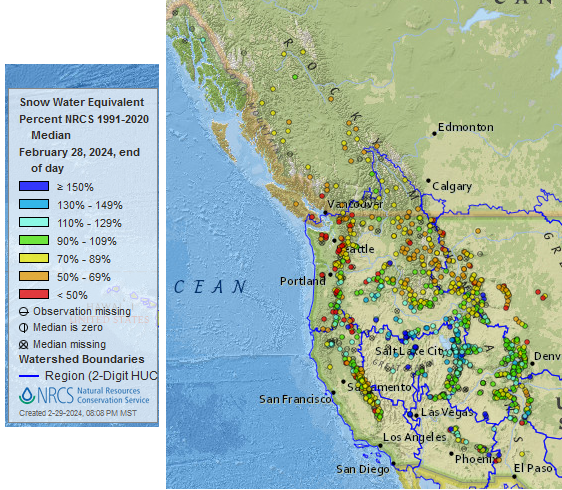
| This provides a very clear picture of the weather pattern since October 1, 2023. The pattern of where there is more snow than normal and where there is less than normal is pretty interesting. It is fairly similar to what one might expect with an El Nino but the area with the most snowpack is further north than what I was expecting. I think this El Nino was overrated with respect to the West. I do not have similar data for the East since their water management approach is not to have snow levels accumulate in the mountains and melt during the spring. Some of that does happen in the East but it is not the dominant approach so looking at the water content of snow-pack is not widely done in the East except in certain places. In the West, it is the primary way that the water supply is tracked. |
Fire Outlook (The Site has Moved and I have not figured out how to print images from the new site yet. The link is HERE.
| I hope you found this article interesting and useful |