There is a succession of presentations by NOAA on a variety of subjects one of which is drought. In many cases, the tape of the presentation including the question and answer portion is made available HERE. This one does not seem to have been posted yet but I obtained the graphics from the author. So there is no audio. Any comments in comment boxes are by me and will mostly be explanations that would otherwise be in the audio. The visual quality in the graphics is far better in this article than it would be in the tape of a webinar.
I selected this talk to present because I thought the author was unusually good at addressing multiple pieces of information in a single slide.
I know that I have to start reporting on other parts of the U.S. but the West seemed to be the most impacted early in this El Nino. That is changing so I will be reporting on other parts of the U.S. Each of these articles takes a lot of time for me to prepare. They are all good but this one is extra good.

Some readers will have to click on”Read More” to read the full article.
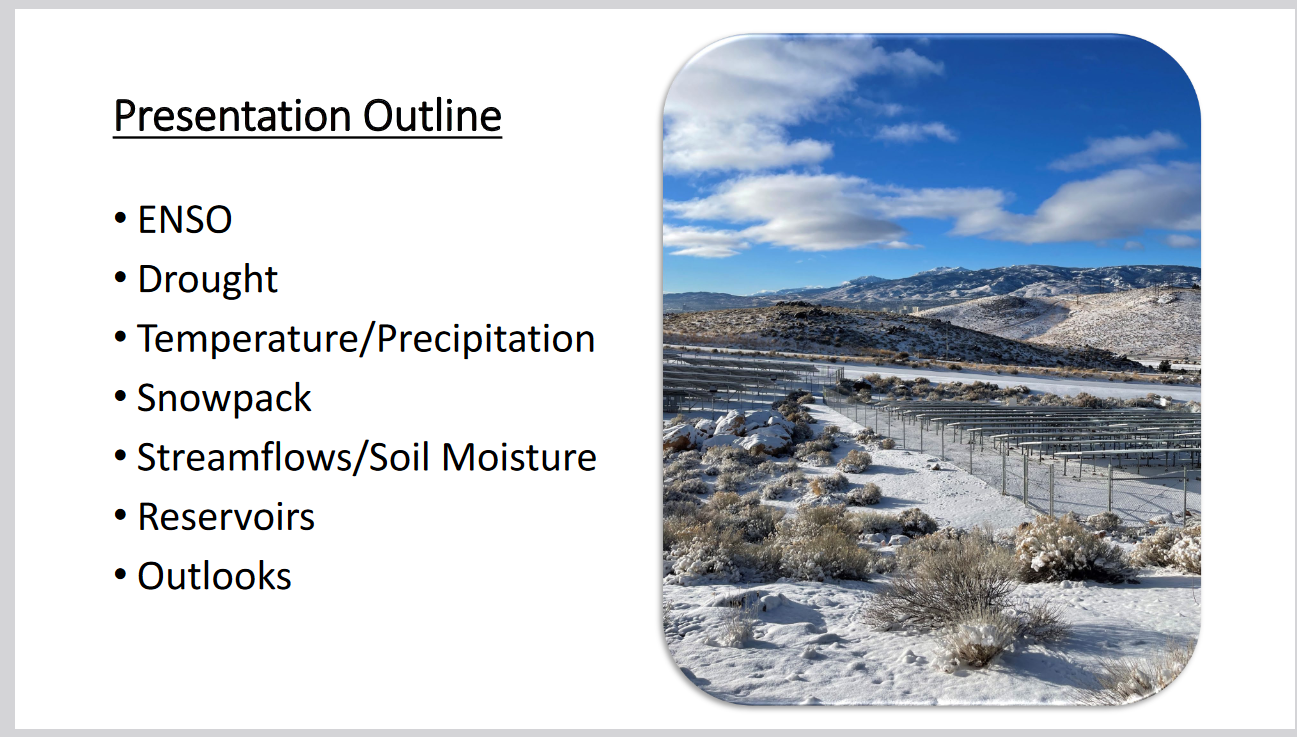
| Above is the outline. |
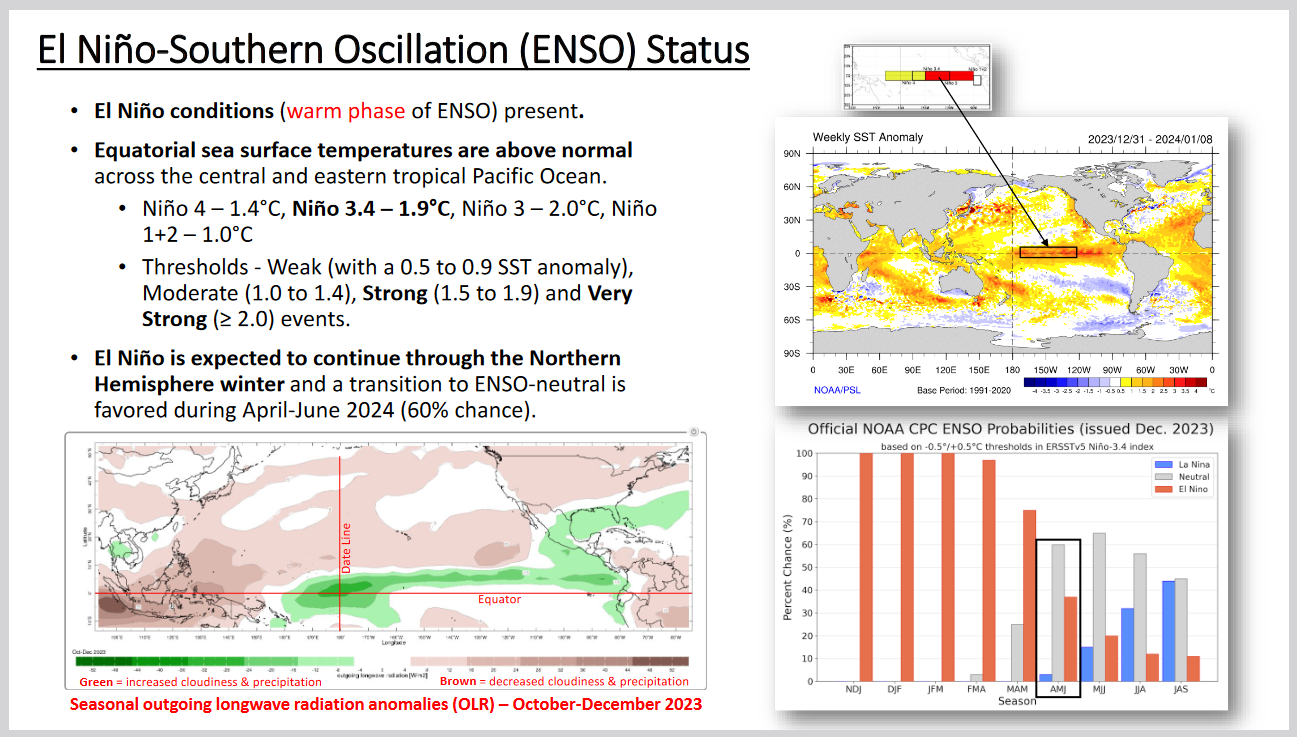
| This is the ENSO summary on one page. The probabilities in the lower right-hand corner have changed slightly in what we published last night. You can access the updated CPC forecast HERE. |
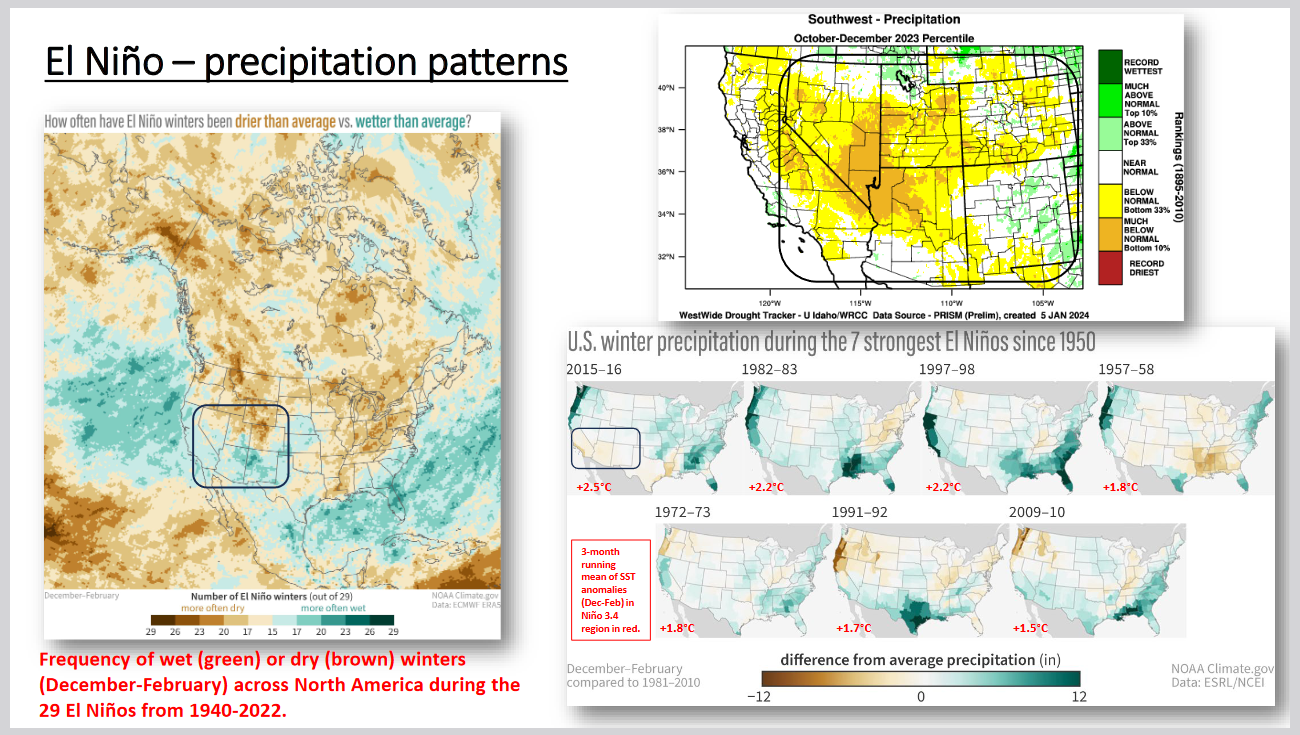
| On the left, it shows the frequency of the period December to February being wetter or drier than Normal for winter in 29 modern El Ninos. The upper right is the actuals for this year Oct – Dec (which is not winter) and you can see that in most places it has been dry. The lower right shows the Dec- Feb (i.e. winter) precipitation for the seven strongest El Ninos out of the 29 shown on the left but the units are different. What is shown is the anomaly from normal. We published an article on that but no need to reference it as the key graphic is shown right here. The maps are organized by the number in red which is explained in the note inserted in the graphic by David Simeral. |
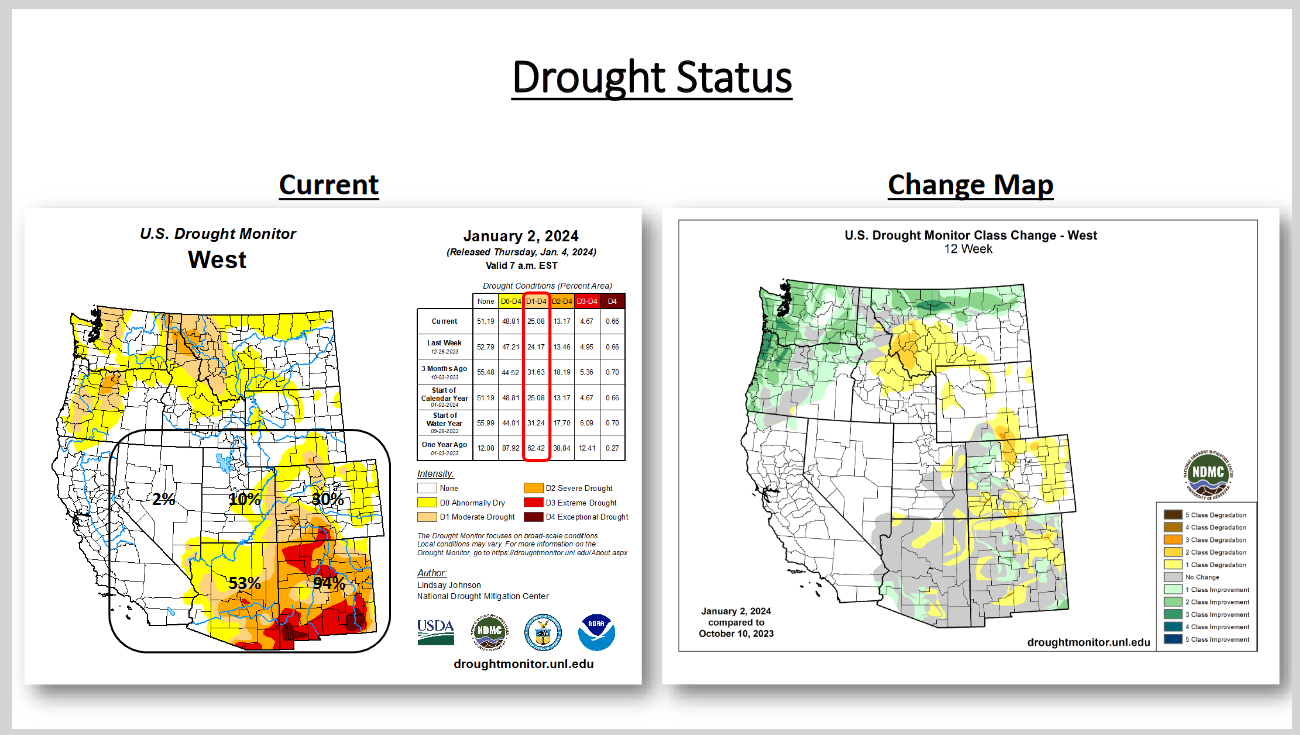
| This is from the Drought Monitor. David Simeral is one of the writers of the Drought Monitor. They take turns. For updates click HERE |
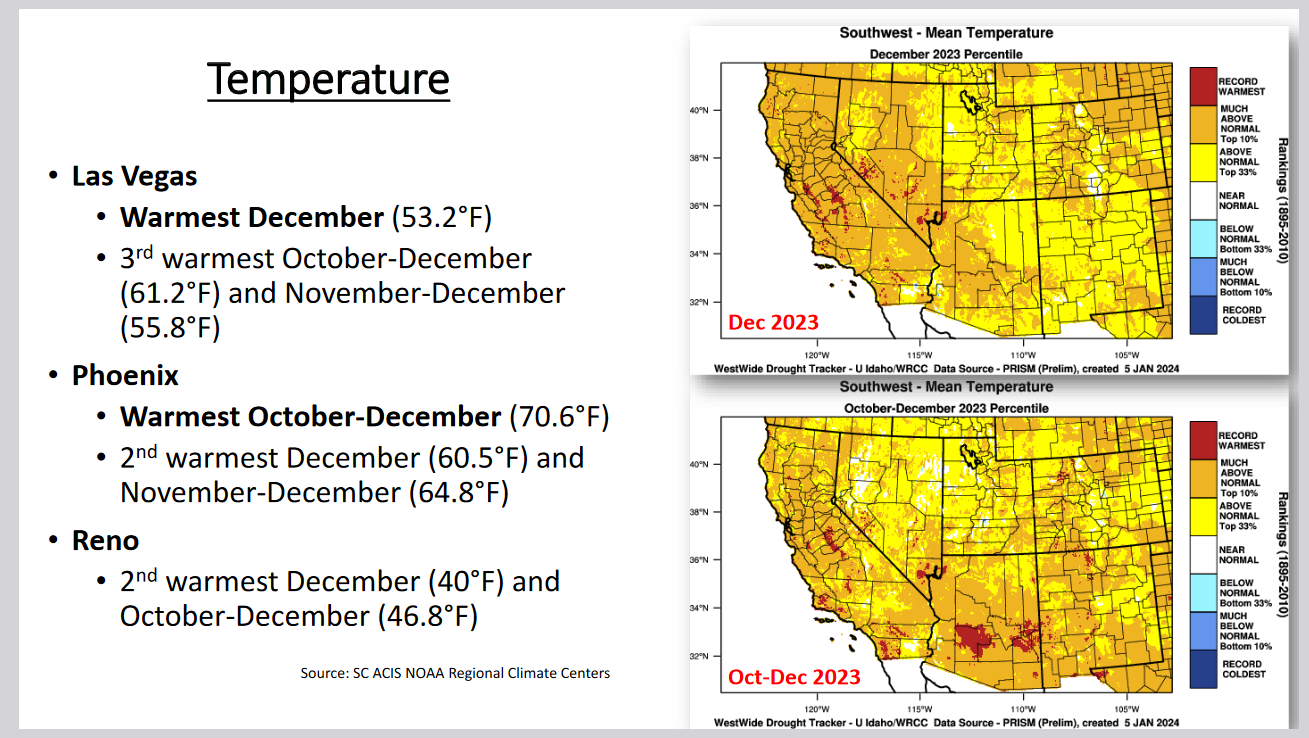
| Again, there are three sub-charts here. Dec 2023, Oct – Dec 2023 and some information for selected cities. |
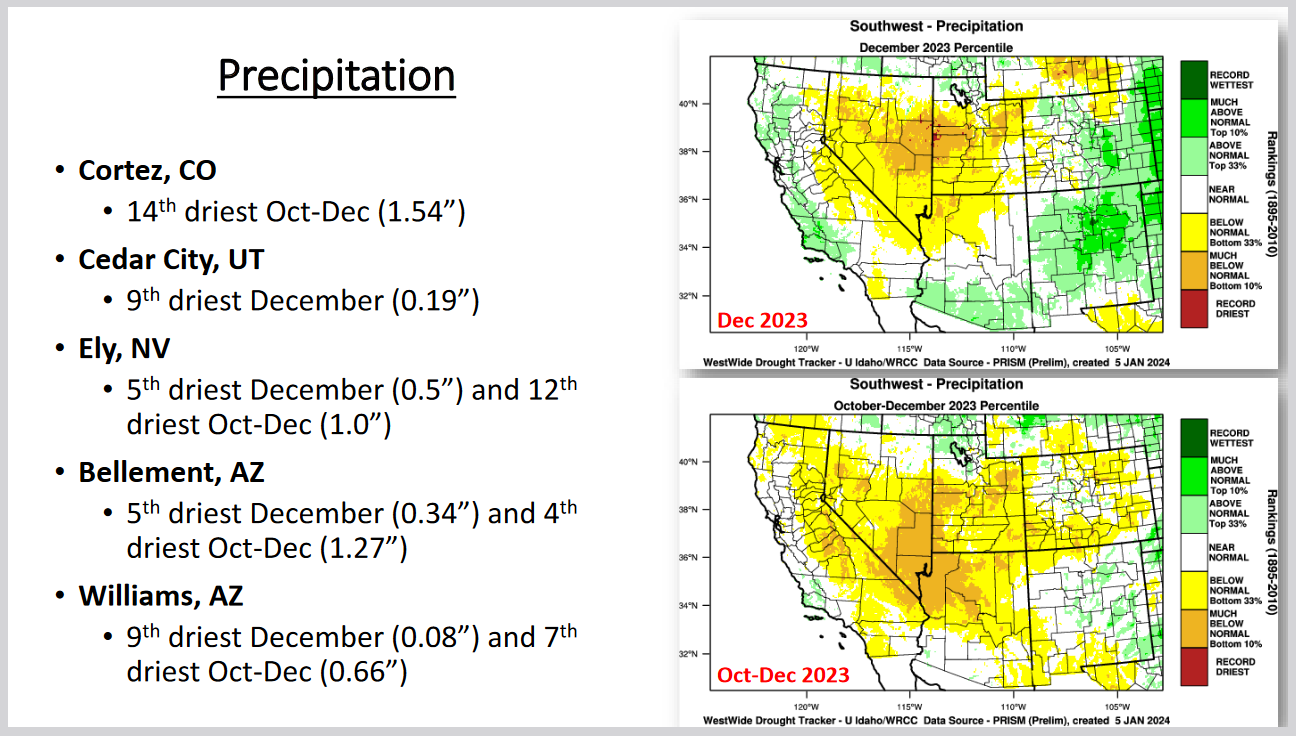
| Similar for precipitation |
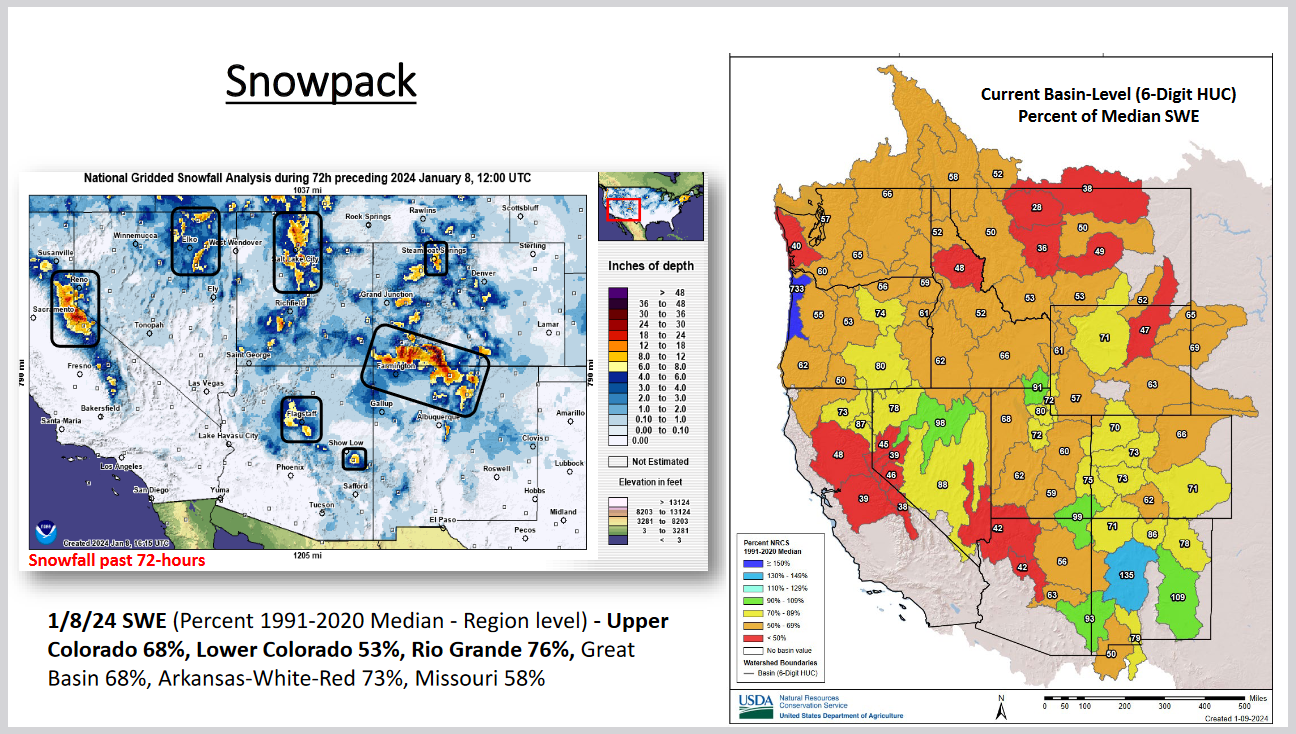
| This shows snowpack. David Simeral draws little boxes around areas of high snowfall in the 72 hours before his presentation [a good presentation technique] and these are usually mountain ranges. He named them during his presentation and I pretty much know them also. Why not see if you can name them? THIS is the link for the past 72 hour image and THIS and THAT are somewhat similar. In the image on the right, blue is good and green is pretty good but yellow, brown, and red is not good. Notice that New Mexico has faired the best so far with this El Nino. Updates to the NRCS Map can be obtained HERE. You have to select the right settings as the mapping application is very flexible and can provide a lot of information. |
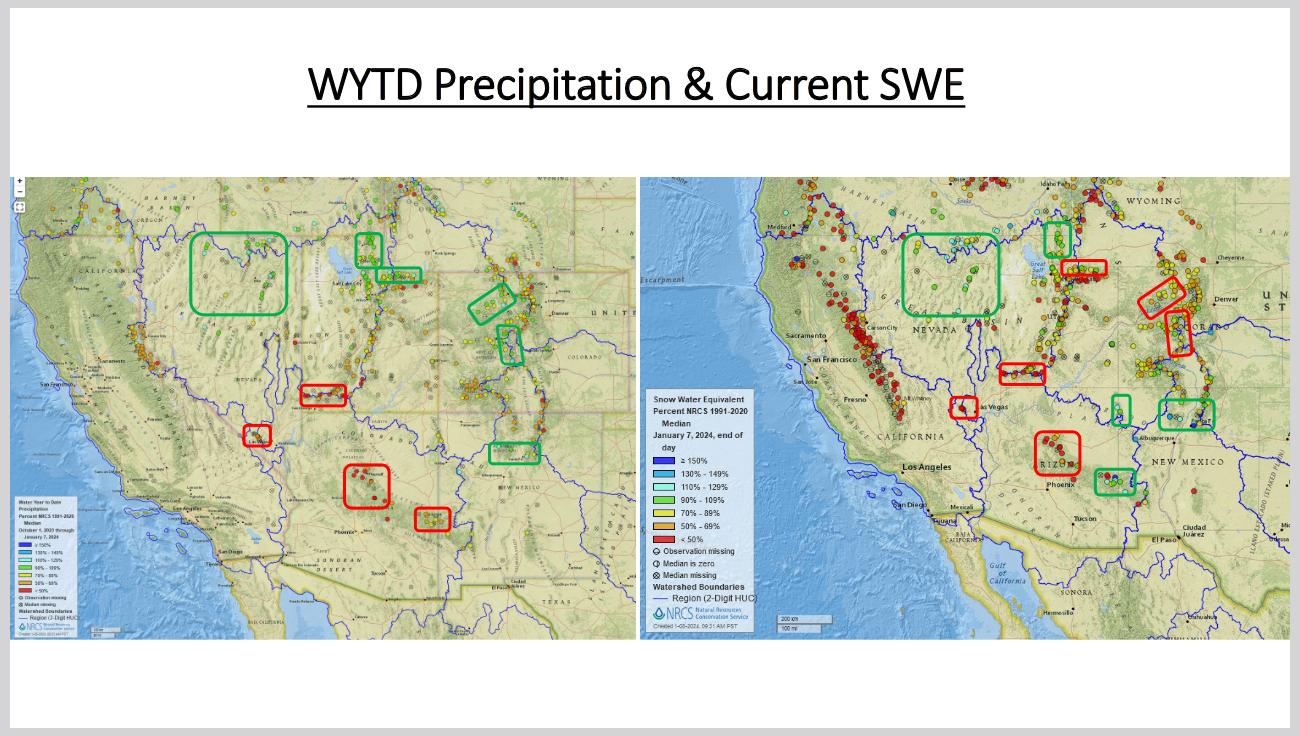
| Here he compares precipitatation to the current snowpack. Those same links will get you this with different settings. His intention in showing the side-by-side slides of WYTD precip and current SWE was to highlight SNOTEL stations in the mountains with 1) stations reporting normal to above-normal [green]precip/SWE, 2) stations with below-normal[red]precip/SWE, 3) **areas that were above normal in terms of WYTD precipitation, yet having below normal SWE (i.e. Uintas Mts, several ranges in CO in the central Rockies (this is likely due to the anomalously warm temps this winter and the precip came in the form of rain rather than snow). 4) stations along the Mogollon Rim in east-central AZ and west-central AZ that were reporting below-normal WYTD precip, but above-normal SWE (this is likely due to the dryness early in the WY). The key point is that the warmer than normal temp in El Nino phases can cause snow droughts where several scenarios can happen. We could have both below-normal WY precipitation and SWE in the region (i.e., 2015-16) or we can have near to above-normal WY precipitation and below-normal SWE due to the warm temps. Big picture…with warming temperatures across the West moving into the future, we could see more of this where snow levels are creeping up higher and higher in elevation, which means less overall spatial coverage of snow during the winters and less runoff in the spring and summer. Warm temps during late winter and spring (i.e., multiple heat waves experienced in late winter and throughout the spring 2020-21) are also having a big impact leading to pre-mature melting of the snowpack and ultimately less runoff into the late spring and summer months. He is good at teasing out a lot of information from the data and highlighting it [red and green boxes] to help illustrate his points. |
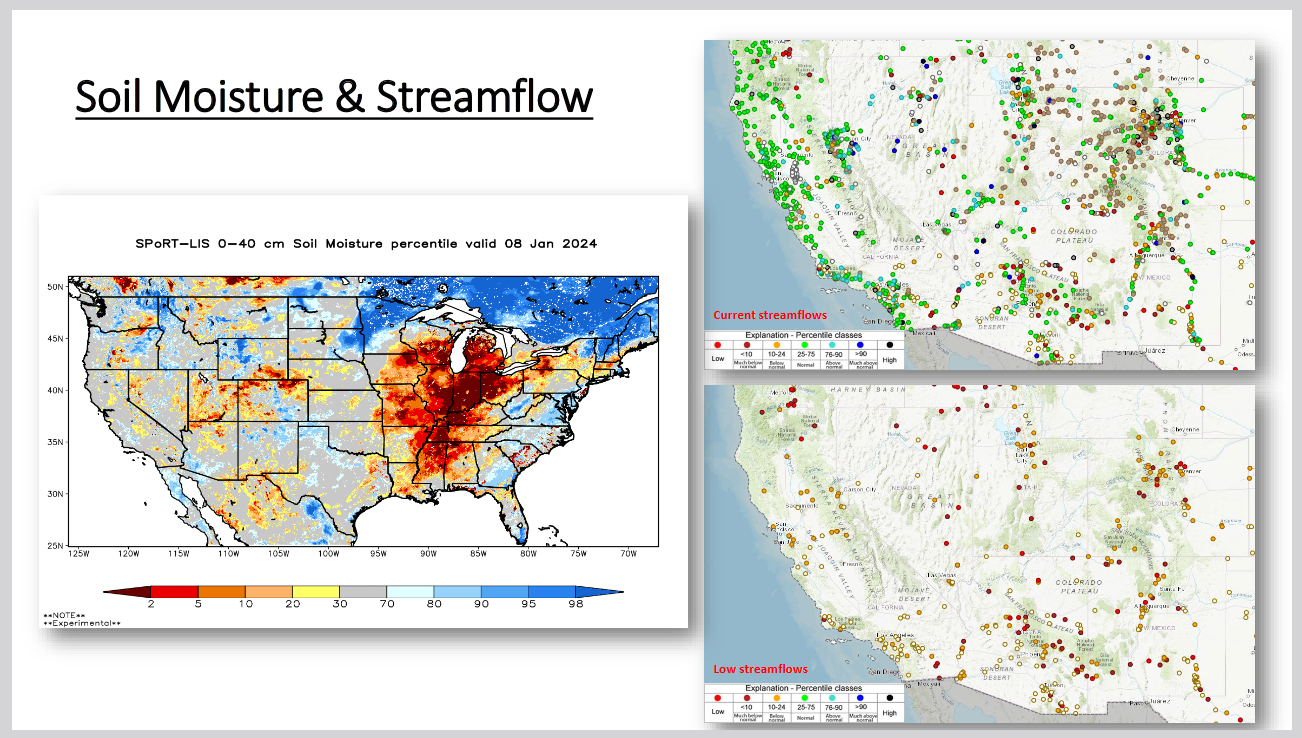
| Here he looks at soil moisture and for the West, he shows stream flow and in the lower right, he filters down to the low-flow streams. You can see why I was impressed. For the image on the left he starts with THIS link. But I am not familiar with that system so I just wait for others to publish images that I can use. Notice the Mississippi River Basin. I need to publish more on that. It has been a problem. |
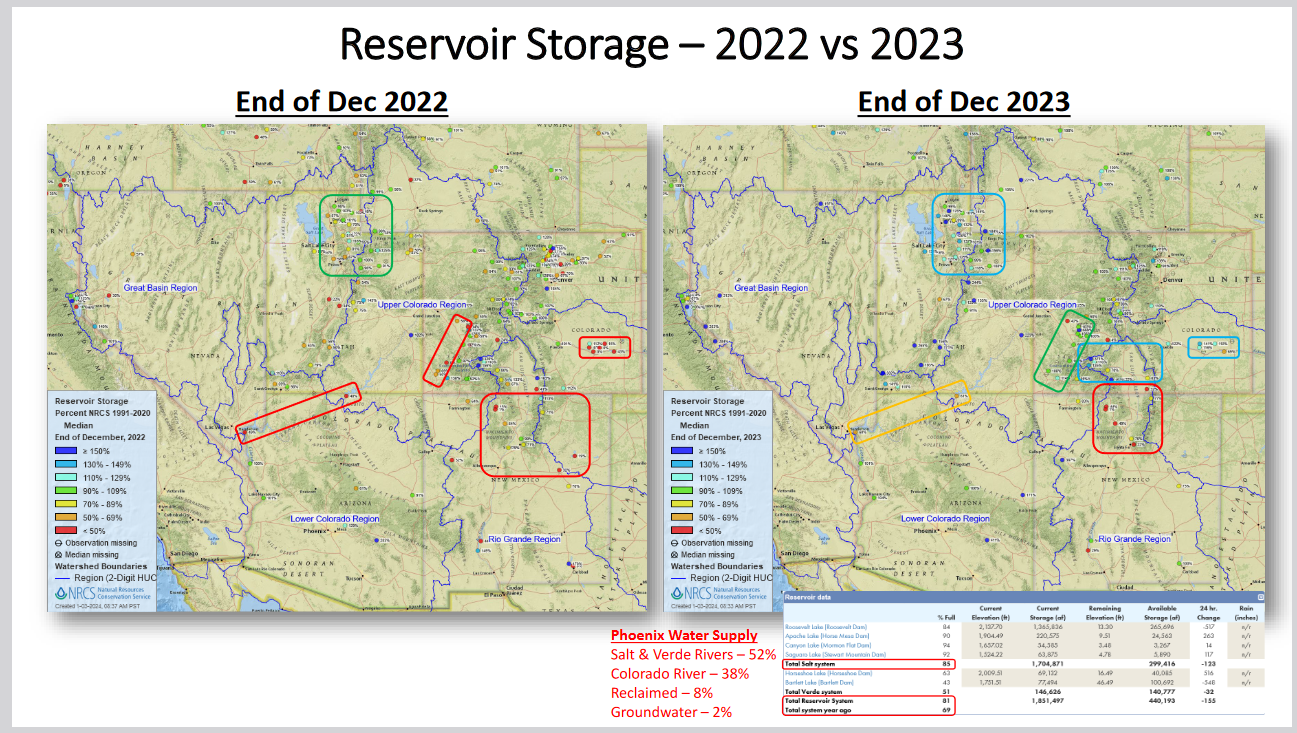
| This shows year-to-year changes in reservoir levels. Notice he is showing some detailed information on where Phoenix gets its water. The Phoenix water supply breakdown was to highlight that Phoenix gets the majority of it water supply from the Salt/Verde system and also to show that despite the dry winter so far, the reservoirs in that system have good carry-over from last season and are in good shape currently to the same time last year. This again is an example of David Simeral showing how to dig deeper into the data to really understand some of the dynamics. |
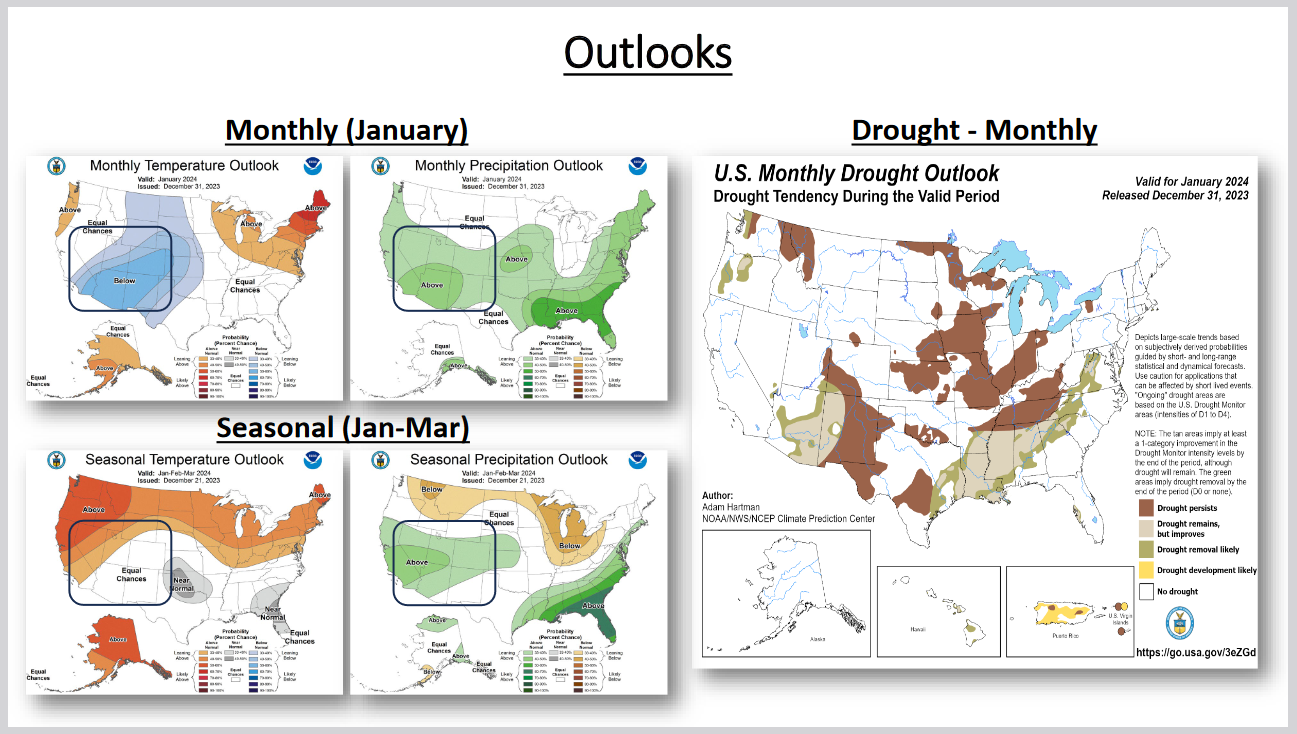
| Here he is using the NOAA (really CPC Div) Weather outlooks to consider the future. These will be updated on January 18, 2023 but they will not update automatically in his article. My article showing the update can be found HERE. The new NOAA outlook is less encouraging. |
| That concludes Dave Simeral’s presentation. |
–
| I hope you found this article interesting and useful. |
–