When articles discuss “normal” or “climatology”, what does it mean? Right now it means what the weather was like on average from 1991 through 2020. To me, this is pretty arbitrary and faulty in many respects but that is how NOAA does it. At the end of every decade, the definition is updated with the most recent decade of data added and the most distant decade removed. If there was no long-term trend or long-period cycles this definition would be fine but there is a trend most noticeable in temperature and there are long cycles like the Atlantic Multidecadal Oscillation and Pacific Decadal Oscillation. If these cycles last approximately 60 years a 30-year average IMO is not a good approach but quite frankly I have not thought of a better way.
In this Climate.Gov article, (which you can access HERE), we are just looking at precipitation. We are not looking at anomalies but the actual values. We start with Precipitation over the 30-year period that defines “Normal” or “Climatology”. Outlooks issues by NOAA often will be in terms of the predicted deviation from the below when precipitation is being considered.

If you are planning to move, the above information may help you decide where you want to live.

In the body of the article and some will have to click the “read more” button to access it, we take the above and show it by month so that there are twelve maps. There is one for each month averaged over the period 1991 – 2020. We are entering into 2024 so there is some time before the climatology will be updated. That update has a big impact on the historical outlook maps to the extent they are revised to show anomalies based on the new normal or climatology.
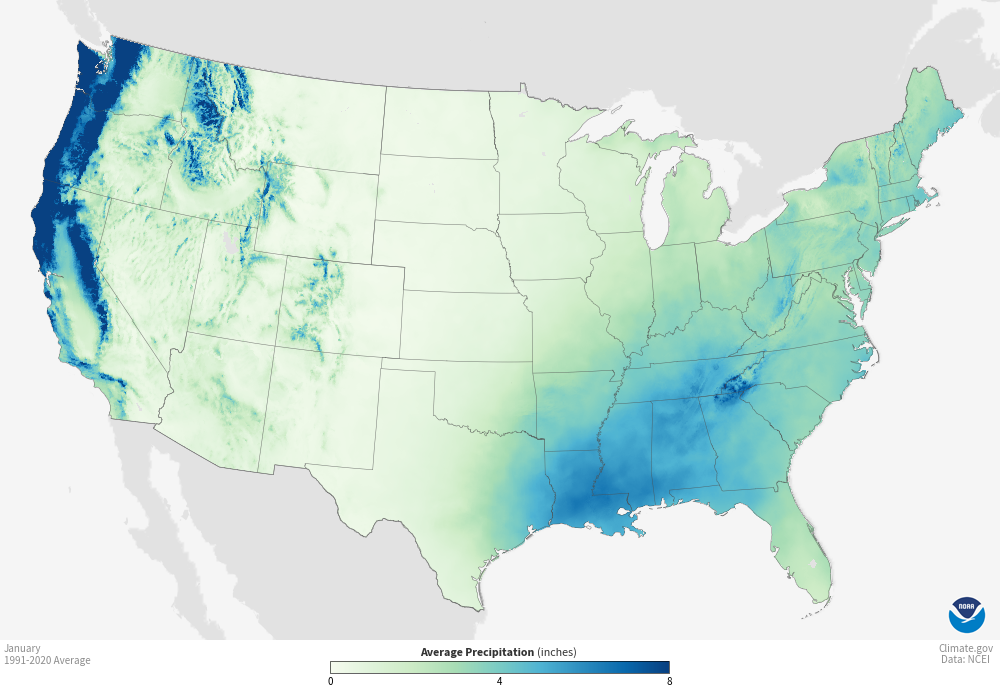
| January is not that different from the annual Normal with a wet West Coast, Southeast, and a slightly drier Northeast. You can see the dry area shown in white and very pale yellow. In these maps you see how mountains tend to extract moisture from clouds. |
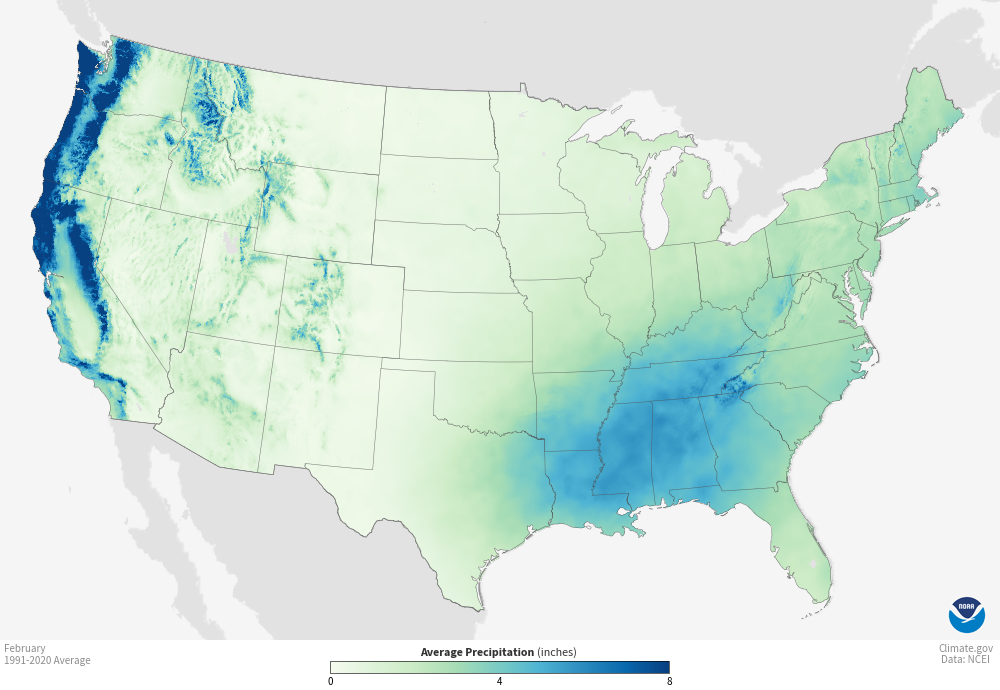
| February is a little less intense, especially in some of the Northern Mountains of the West. But remember this is the average over the thirty years. There is a lot of variability within the 30 years. |
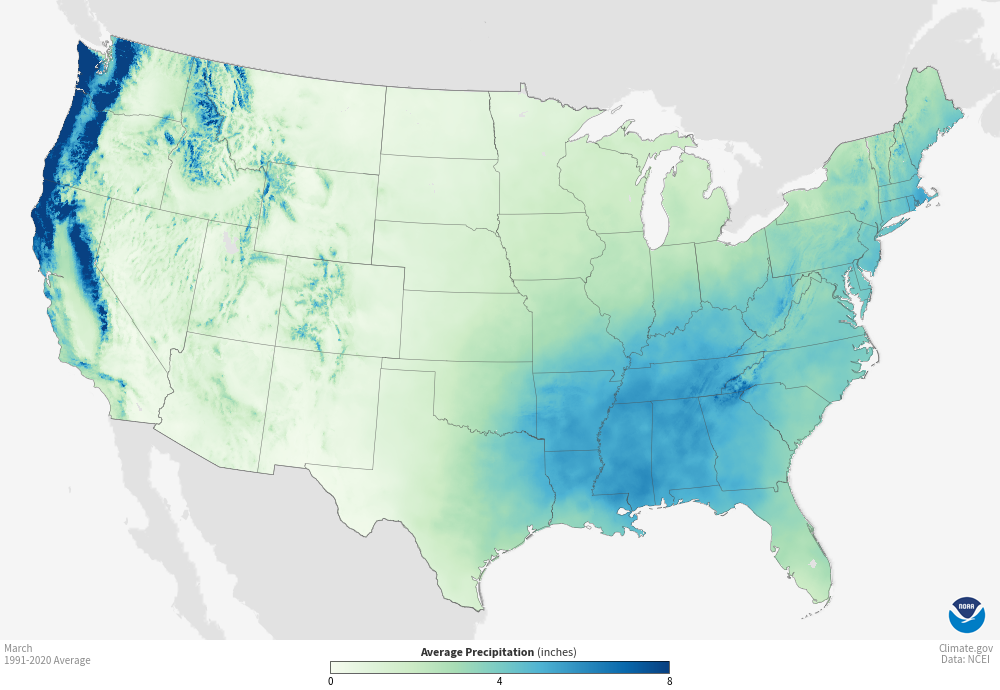
| March is a lot like February. |
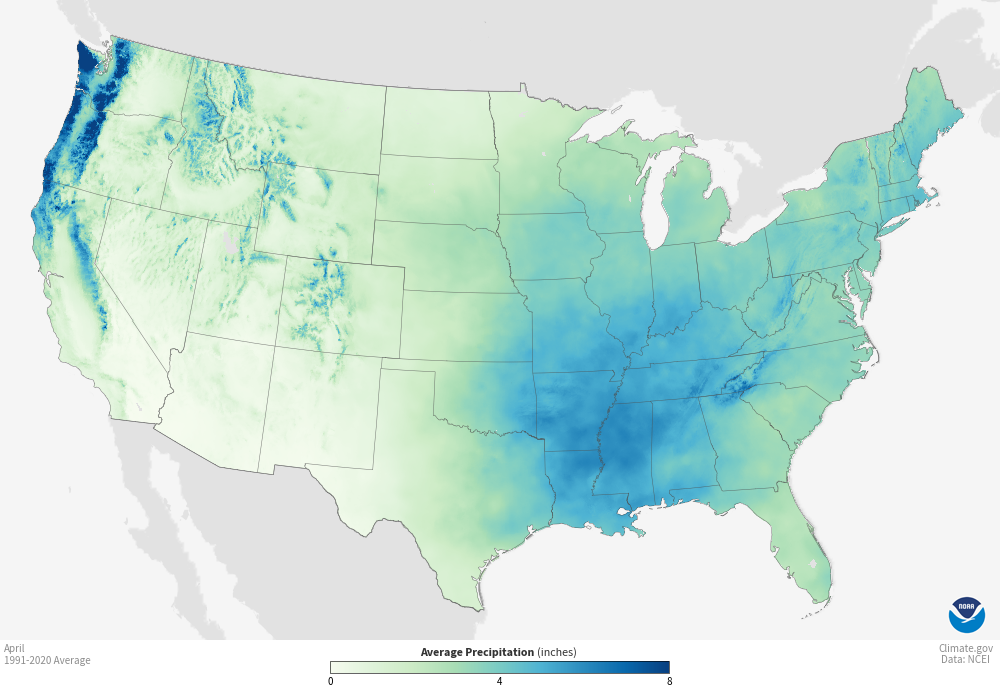
| April is when the Southwest starts to be dry. |
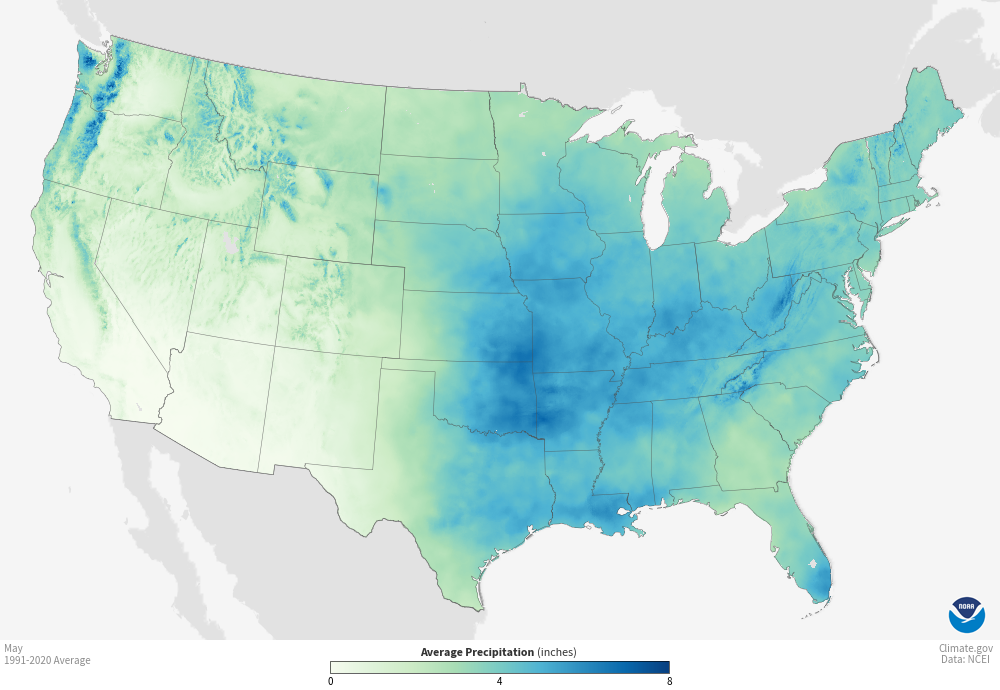
| May is wetter in the Great Plains. It is planting time. |
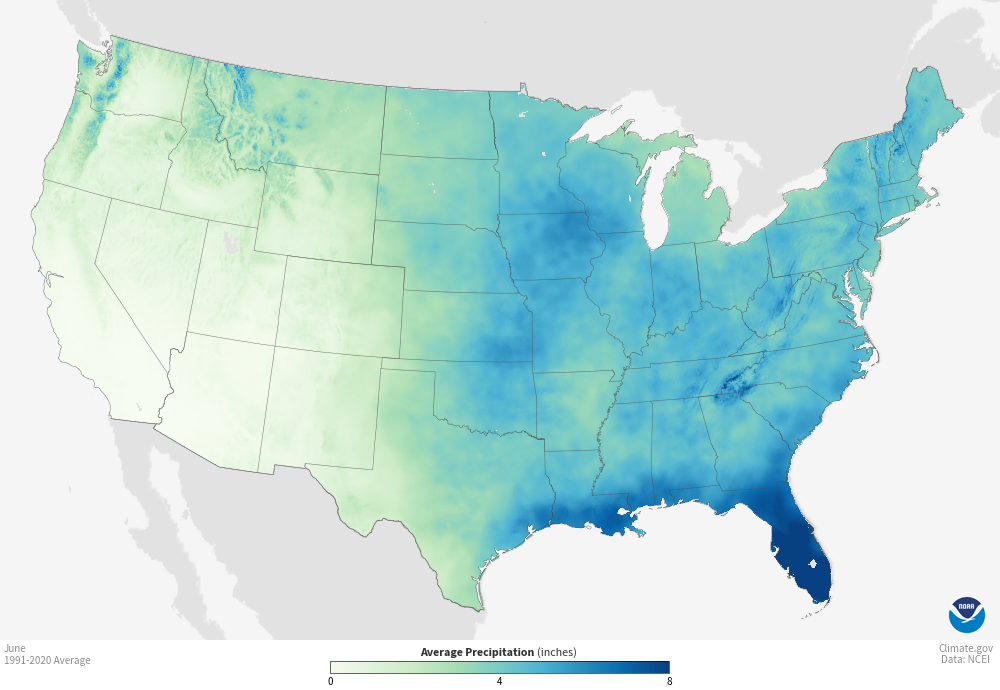
| June is wet in Florida and the Southwest is quite dry. |
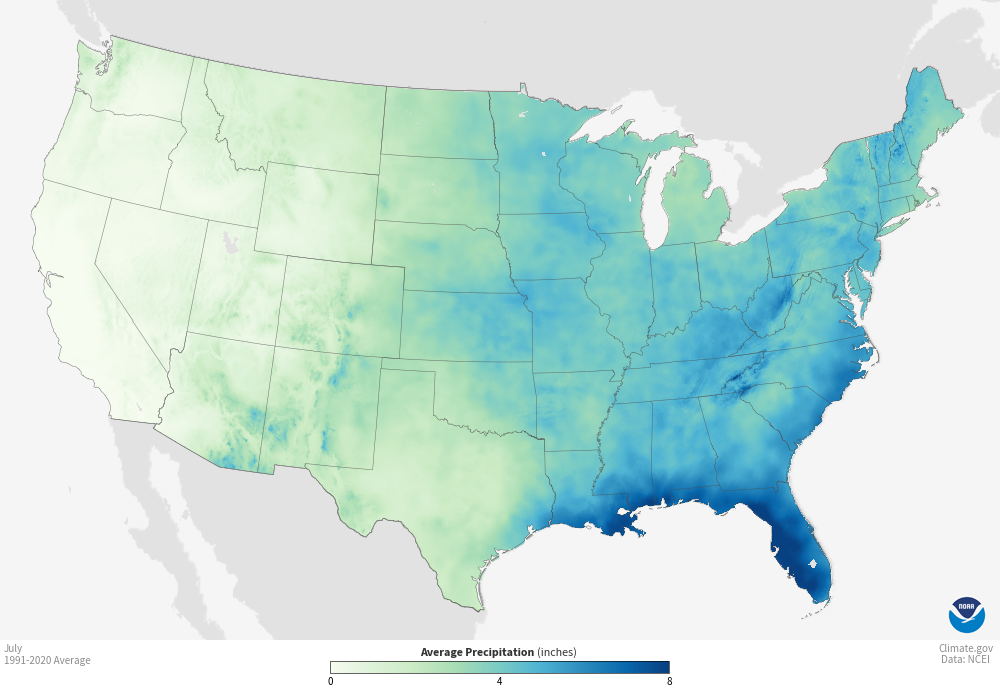
| July shows the Monsoon in Arizona and New Mexico. But the West Coast is dry. |
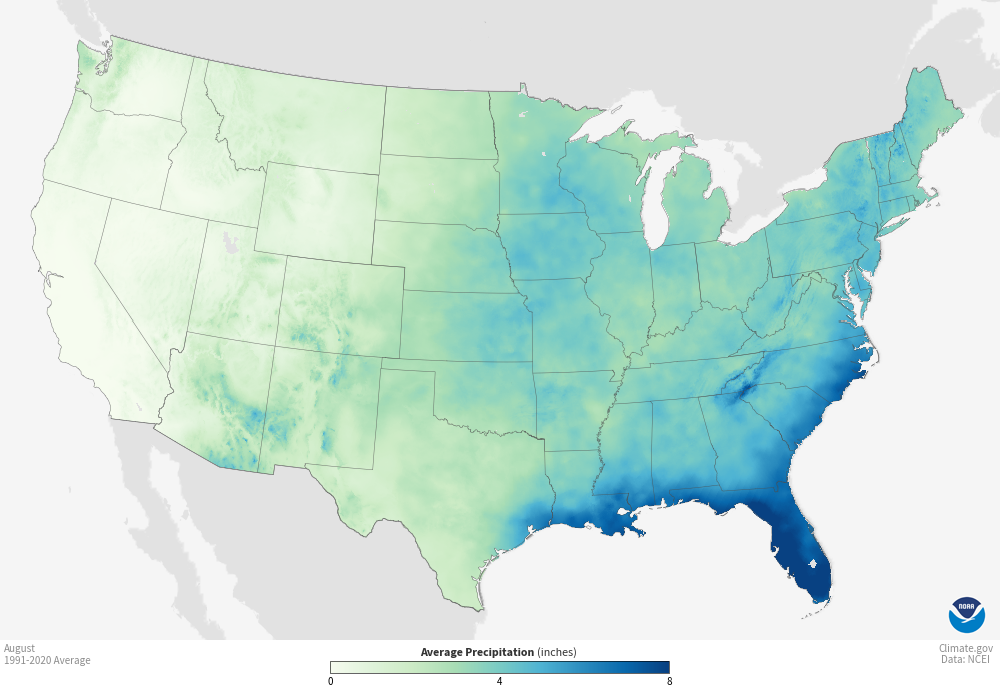
| August is similar to July. |
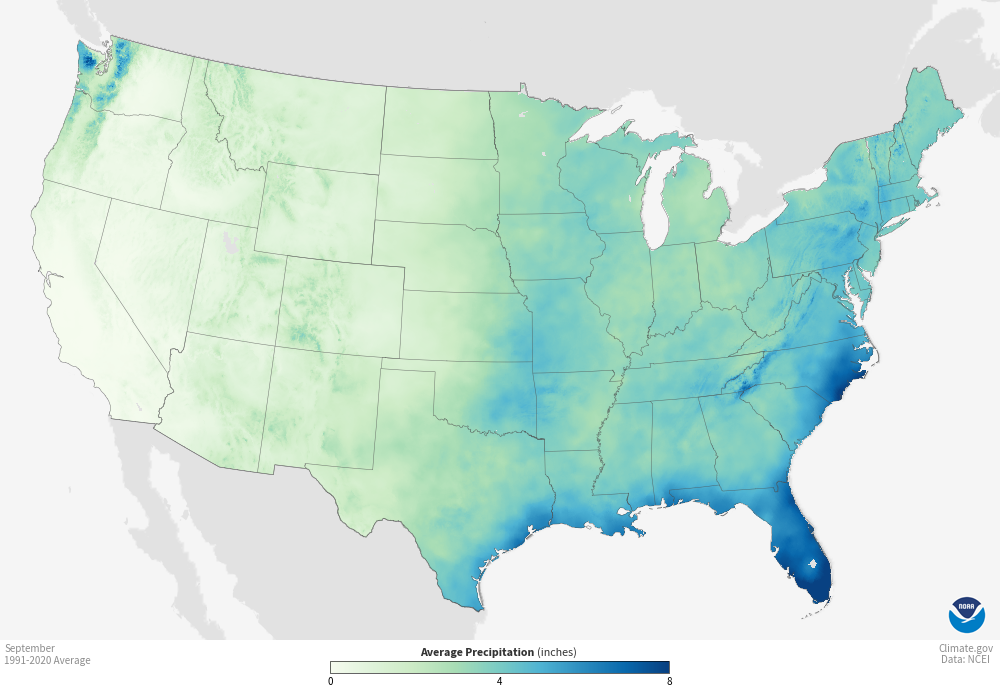
| In September the Monsoon begins to fade a bit But it is still hurricane season so Florida and the Cape Hatteras Area remain very wet. |
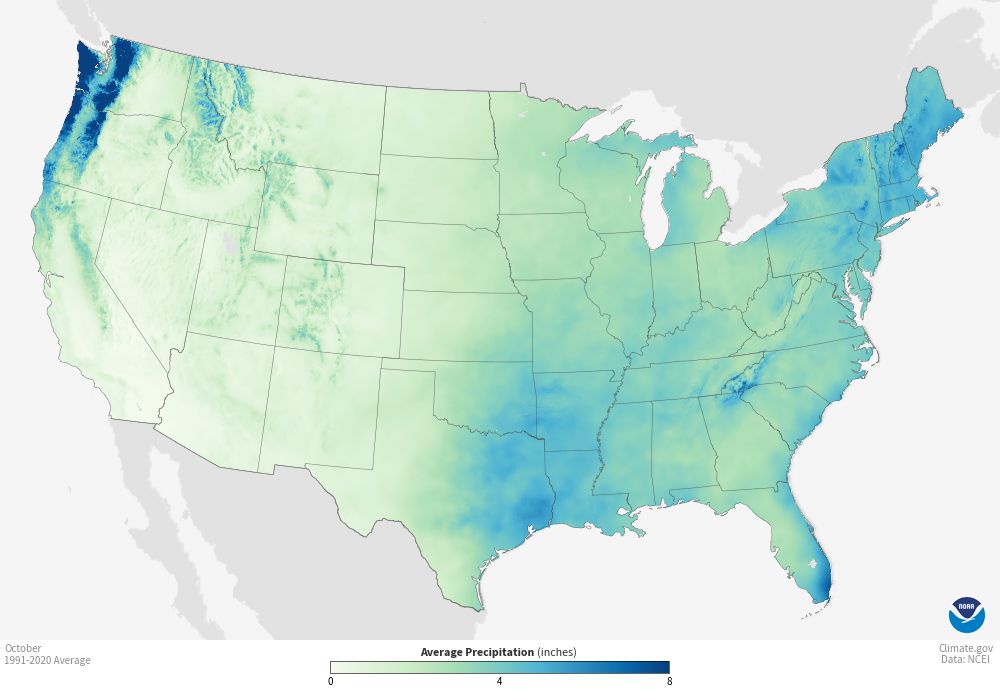
| In October the Northwest gets wet. |
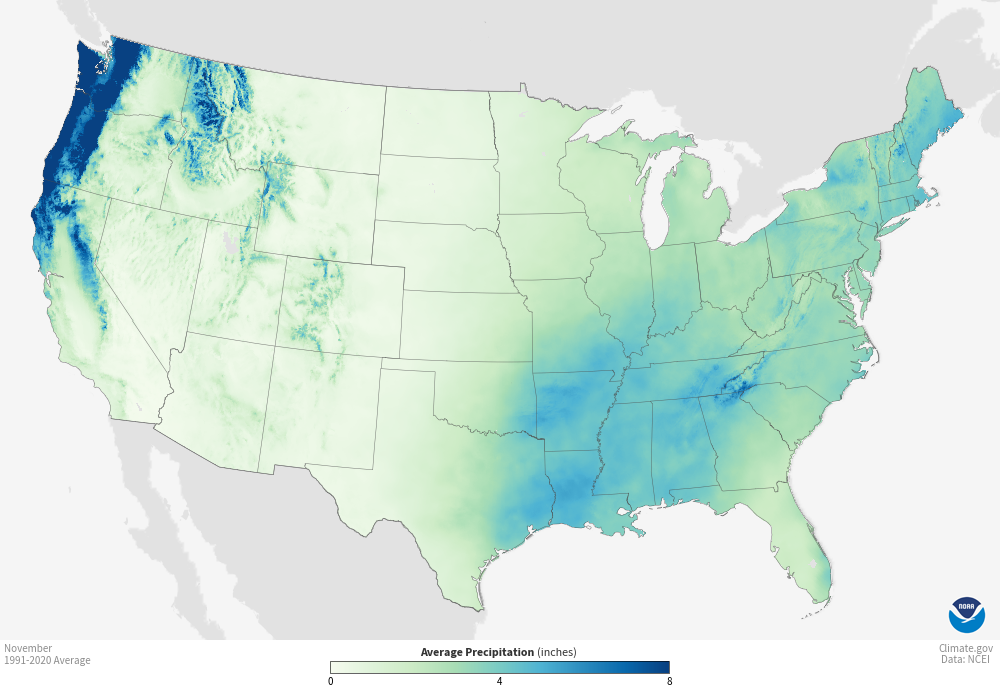
| In November the Northwest gets even wetter. |
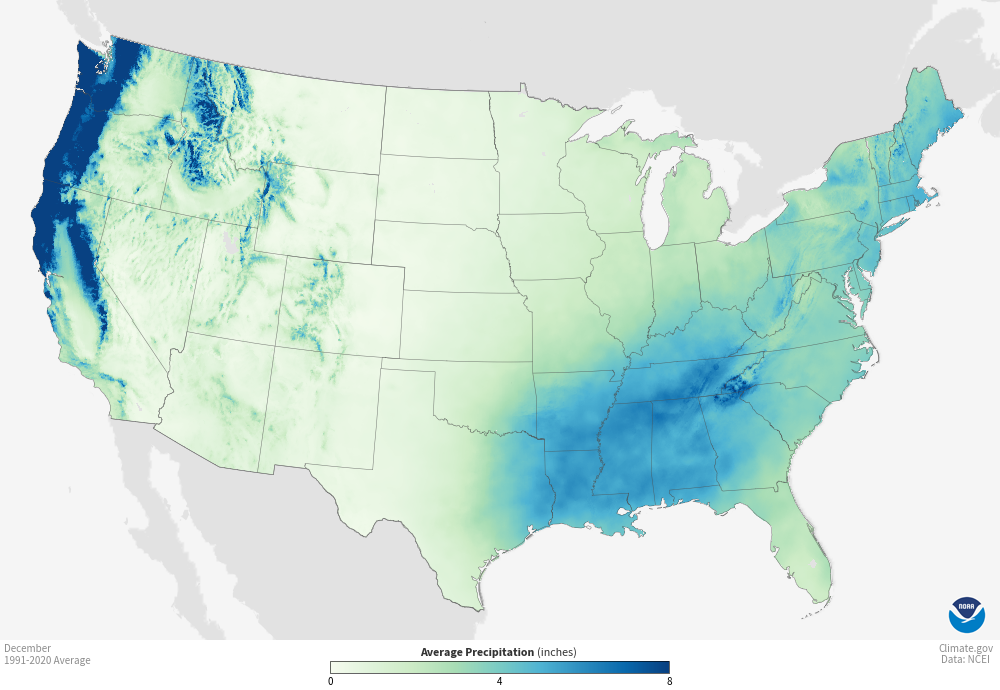
| The West Coast is even wetter in December. Much of this falls as snow. |
–
| I hope you found this article interesting and useful. |
–