Slightly modified at 6 pm EST December 1, 2023, to add additional clarity to the author’s comments.
At the end of every month, NOAA updates its Outlook for the following month which in this case is December of 2023. We are reporting on that tonight.
There have been some significant changes in the Outlook for December and these are addressed in the NOAA Discussion so it is well worth reading. We provided the prior Mid-Month Outlook for December for comparison. It is easy to see the changes by comparing the Mid-Month and Updated Maps.
The article includes the Drought Outlook for December. NOAA also adjusted the previously issued Seasonal Drought Outlook to reflect the changes in the December Drought Outlook. We have included a map showing the water-year-to-date precipitation. We also provide the Week 2/3 Tropical Outlook for the World.
The best way to understand the updated outlook for December is to view the maps and read the NOAA discussion. I have highlighted the key statements in the NOAA Discussion.
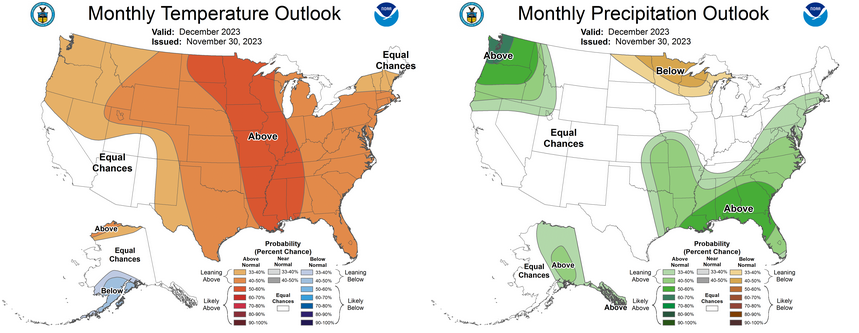
Here is the updated Outlook for December 2023
For Comparison Purposes, Here is the Mid-Month Outlook for December.
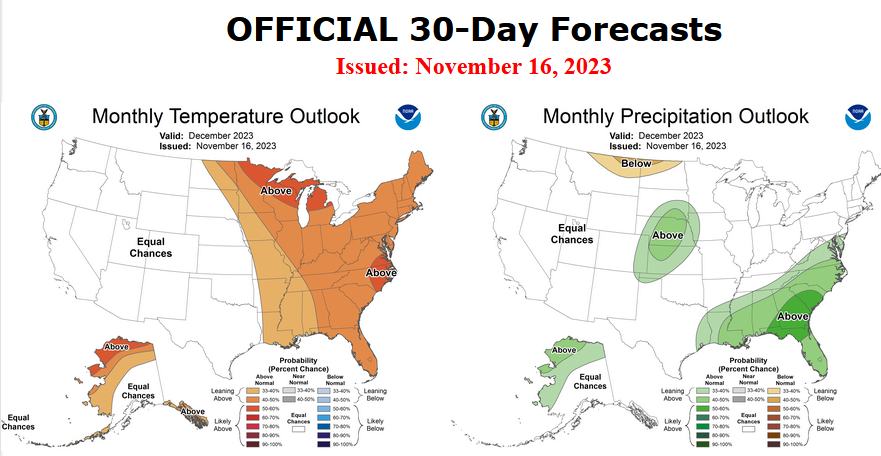
| There have been some significant changes especially related to Temperature. Remember, it is the top set of maps that are the current outlook for December. We are not sure that NOAA (actually their CPC Divison) has moved the storm track sufficiently south given the strength of this El Nino as measured by the Nino 3.4 Index. But it takes time for the impacts of an El Nino to be fully felt and there are conflicting factors. The sample size of very strong El Nino’s is very small so this complicates the forecasting process. The probability that his El Nino will record as being historically strong is less than 50% but well above zero. The atmosphere has not responded to the extent one might expect by just looking at the Nino 3.4 Index. The El Ninos with the highest level of the Nino 3.4 Index are not always the wettest but sometimes are. So we are dealing with a fair amount of uncertainty. You can track the changes in our Daily Weather Article. |
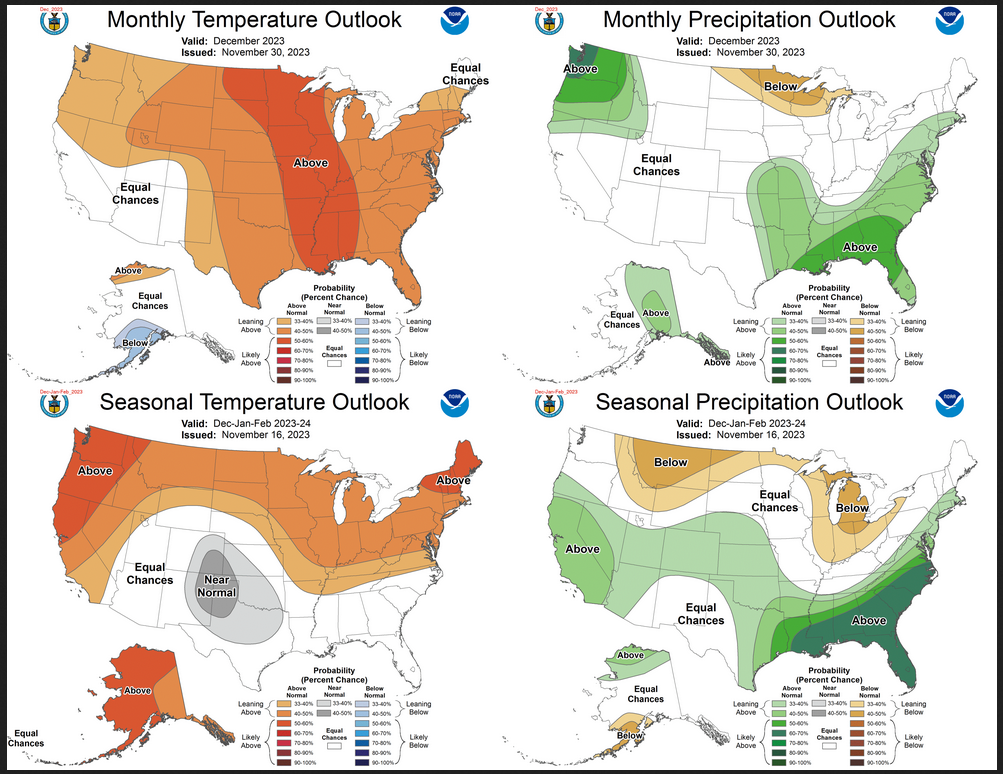
Combination of the Updated Outlook for December and the Three-Month Outlook
| Our regular Daily Weather article can be found HERE. In addition to the short-term forecast it also provides the 6 – 10 day, 8 – 14 day, and Week 3 – 4 Outlooks. That is not a full month but close to it. So it is helpful if one wants to understand how the full-month forecast is expected to vary through the month. And the maps in the Daily Article update throughout the month. |
Here are larger versions of the Temperature and Precipitation Outlook maps.
NOAA (Really the National Weather Service Climate Prediction Division CPC) Discussion. I have shown certain important points in bold type. My comments if any are in brackets [ ].
30-DAY OUTLOOK DISCUSSION FOR DECEMBER 2023 [The strength of this El Nino might justify a more southern storm track than is predicted but there are conflicting factors that might make the apparent strength as measured by the Nino 3.4 Index not the best measure of the actual strength particulary in terms of the December Outlook.]
El Niño conditions continue to be observed, with recent SSTs across the equatorial Pacific remaining well above normal. The latest SST anomaly value in the Nino3.4 region is 2.1C. Upper-level and lower-level winds as well as the OLR pattern are all reflective of El Niño conditions, indicating that the atmosphere and ocean are coupled with a robust response. The MJO remains active as well with the enhanced convection phase over the Indian Ocean. Lagged impacts from an IO based MJO would put upper-level ridging over the contiguous U.S. (CONUS) and upper-level troughing over Alaska for much of the month. Composites also support some troughing early in the month near the west coast, which then fades throughout the month. The MJO and ENSO related signals are likely to be only a portion of the realized conditions.
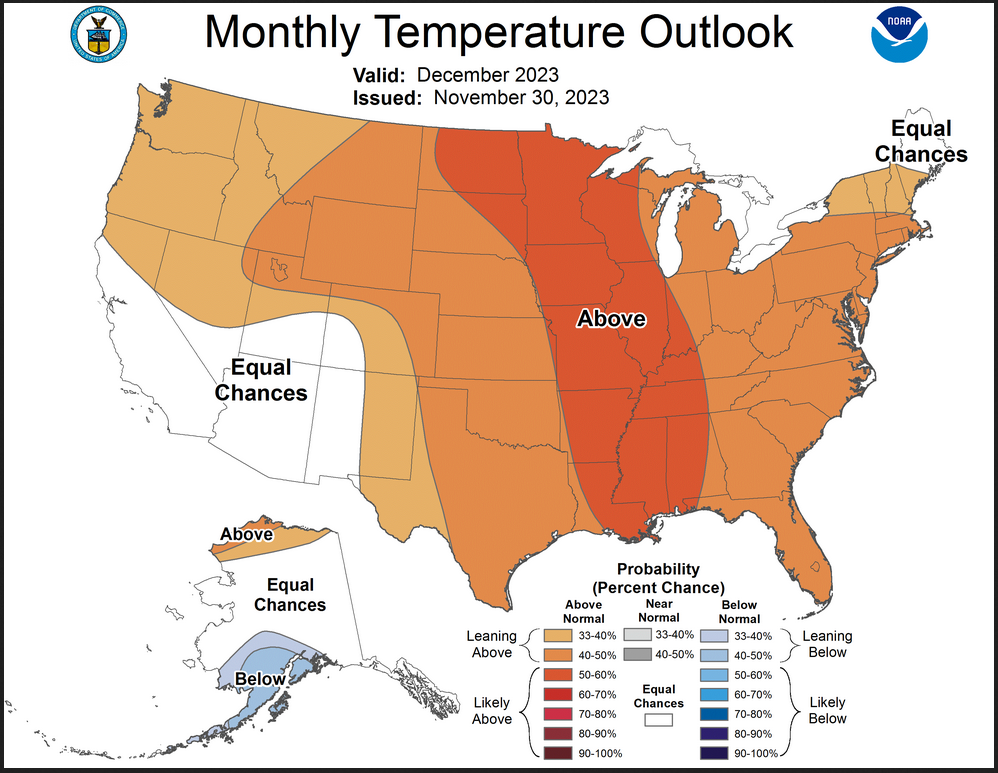
Temperature
Temperatures are favored to be above-normal for much of the CONUS for the month of December. A warm start is likely for the Southeast with a stormy pattern keeping minimum temperature elevated, while the Northern Great Plains are likely to have overall above-normal temperatures. The main areas of uncertainty in the temperature outlook are the Southwest and California. The potential for early month troughing mitigates the odds for above-normal temperatures in those regions. Any troughing and unsettled weather pattern would be transient, a notion supported by PNA forecasts in the GEFS which oscillate from positive to negative and back to positive in the first two weeks. The intensity and duration of potential troughing over Alaska results in an area of below-normal temperatures being favored across southwest mainland Alaska and a significant reduction in the probabilities for above-normal temperatures in the official outlooks compared to the model guidance. Reduced sea-ice near the northern coast of Alaska favors above-normal temperatures potentially mitigating the atmospheric related signals , though the uncertainty there is higher than usual. Model members do signal the potential for some significant short periods of anomalously cold air, which would align with MJO related troughing, though exact trough axis placement is still too uncertain to indicate a signal.
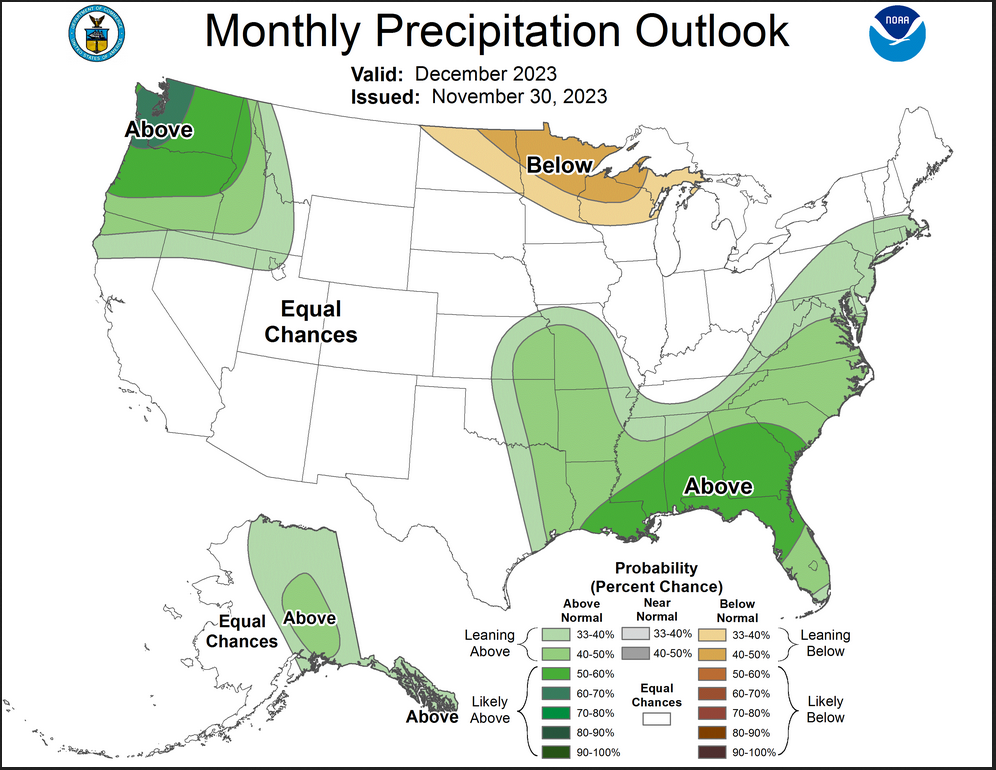
Precipitation
Within this outlook is included potential for a wet start to the month in the Southeast during the first week, then a short-dry period, with the overall background influenced by the El Niño which favors a tilt toward wet. The early wet period is likely to provide precipitation amounts that effectively rule out the potential for below-normal total precipitation for the month. That same oscillation from wet to dry to wet is likely to also favor an overall wet period for portions of the Central and Southern Plains, as the December climatology of precipitation is relatively low across portions of Kansas and northern Missouri. A very wet period as an impact from an atmospheric river is likely to start the month for the Pacific Northwest, though the exact area of highest precipitationl is uncertain. The overall flow for the month is likely to support continued wet conditions across the Pacific Northwest as both models and MJO composites indicate an active storm track across that region. Below-normal precipitation is favored across the Northern Great plains and Upper Great Lakes, though precipitation totals there are low during the winter, so the uncertainty in that forecast is higher than for the areas in the Southeast and Northwest.
Drought Outlook
Here is the newly issued Drought Outlook for the month.
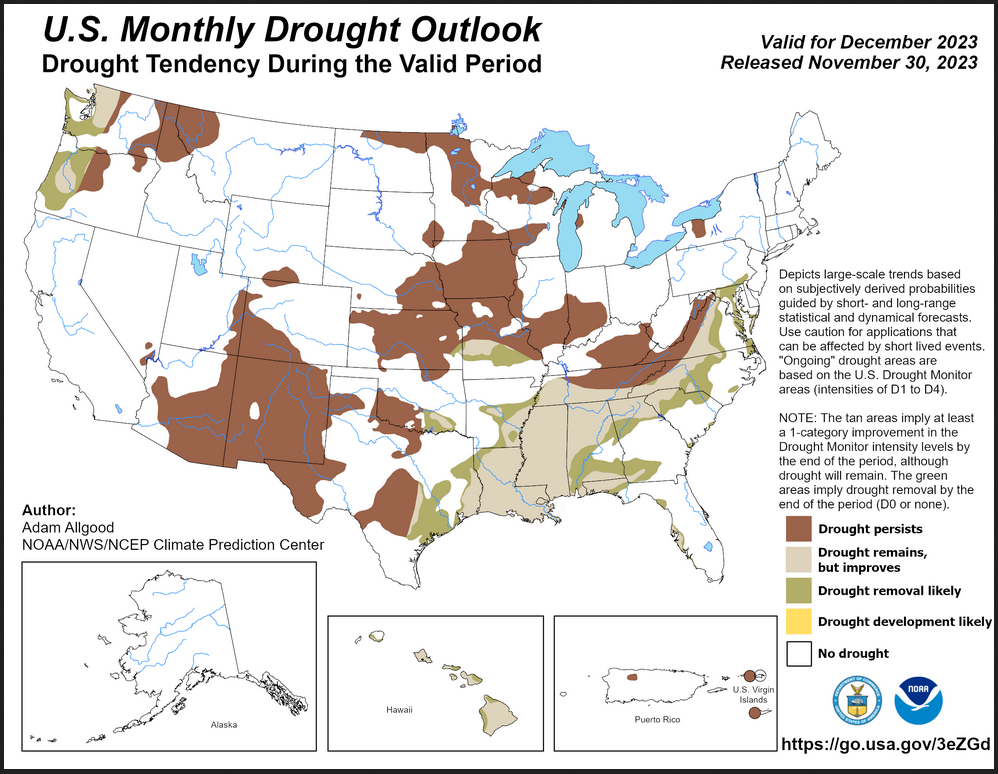
| You can see where drought development or reduction is likely. Overall the forecast is for a slight reduction of drought conditions. The summary and detailed discussions that accompany this graphic can be accessed HERE, but the short version is shown below. |
Here is the short version of the drought summary
Latest Monthly Assessment – Heavy precipitation fell across portions of southern Texas, Florida, and the central Plains during November, but overall a relatively dry pattern prevailed across the contiguous U.S. (CONUS). Scant opportunities for Fall recharge resulted in drought degradation across portions of the Corn Belt, Southeast, Appalachians, and the mid-Atlantic, and drought slowly expanded across the eastern Four Corners region following a lackluster monsoon season. In contrast, drought conditions eased across much of Texas, and the onset of the Winter wet season brought relief to portions of the Northwest. During December, heavy early month precipitation favors drought relief across much of the Southeast and south-central CONUS, and significant coastal rainfall and mountain snowfall across the Pacific Northwest should bring further drought reductions. Given the dry time of year, drought persistence is the most likely outcome for the remainder of the CONUS. While no drought development is favored for the CONUS, increased impacts from dryness is possible across the upper-Midwest before soils and streams completely freeze over. No drought is currently in place or forecast to develop in Alaska. Across Hawaii, a currently-unfolding Kona Low event is bringing widespread heavy precipitation, which should help ease ongoing drought conditions at least temporarily. A suppressed signal is slightly favored for the Caribbean region; therefore, drought persistence is the favored outcome for Puerto Rico and the US Virgin Islands.
We also have an updated Seasonal Drought Outlook (link).
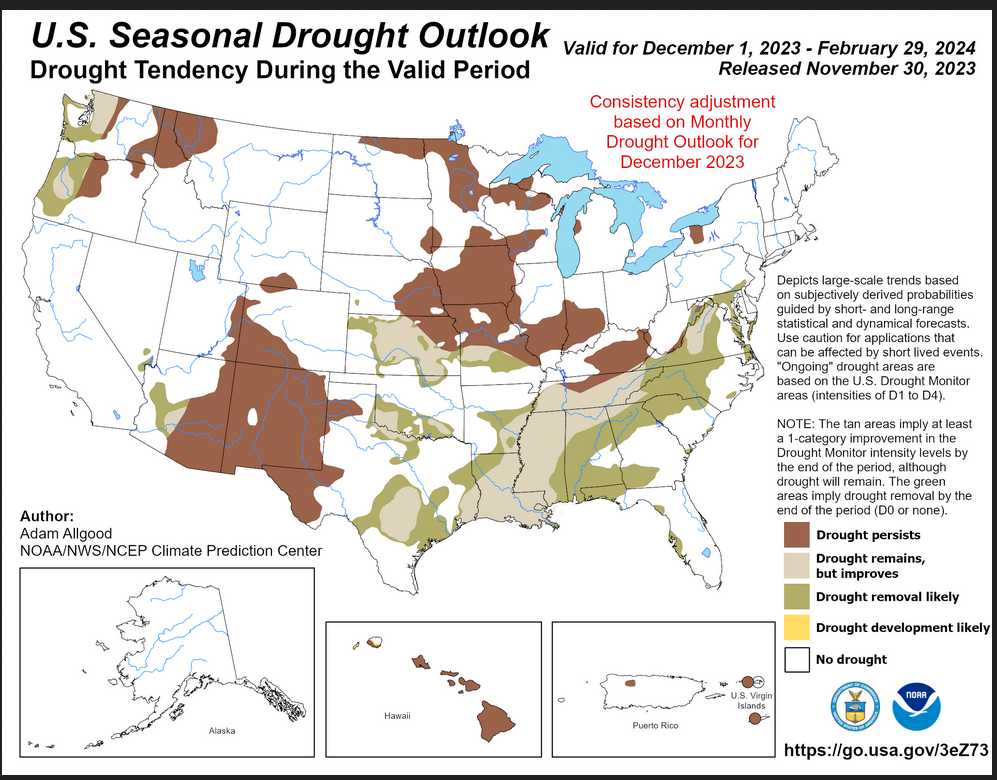
| It is this month a bit different than the single-month outlook and it covers a longer period of time. It does not seem to be consistent with a possibly historically strong El Nino but it does show significant improvement over current conditions. |
| To update this forecast (which updates on Tuesdays) click HERE |
Month-to-date Temperature as the current month evolves can be found at https://hprcc.unl.edu/products/maps/acis/MonthTDeptUS.png
Month-to-date Precipitation as the current month evolves can be found at https://hprcc.unl.edu/products/maps/acis/MonthPNormUS.png
CLIMAS Southwest Climate Podcast – Winter is Coming
To access the dashboard for this podcast click HERE. You will then have to click on the start arrow to listen to this podcast. We just received it today and have not had time to listen to it so it better be good. It is focused on the Southwest but generally covers more than the Southwest since all regions of the U.S. are interconnected in most cases.
Water-year-to-date precipitation. Here is the LINK
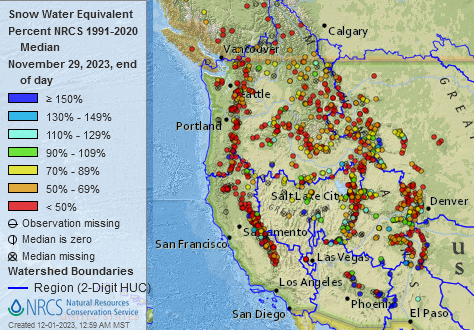
| This provides a very clear picture of the weather pattern since October 1, 2023. It has been surprisingly dry so far. Since I created this graphic on November 30, 2023, I was only able to get it to show the information through November 29, 2023. It may be about to change. I have had snow at my house for the past two days. |
Fire Outlook (The Site has Moved and I have not figured out how to print images from the new site yet. The link is HERE.
| I hope you found this article interesting and useful |