I wish I had this for all regions but only three regions prepared this report so I am working with what I have. There is a separate but similar report for three areas: The Great Lakes, the Missouri Basin, and the Midwest.
I could have organized the graphics differently to highlight the differences among the three regions but I present the information as received and I think that works also.
The information presented will help a reader understand what is presented in the NOAA CPC Seasonal Outlooks and may provide some additional information for where they live in these regions.
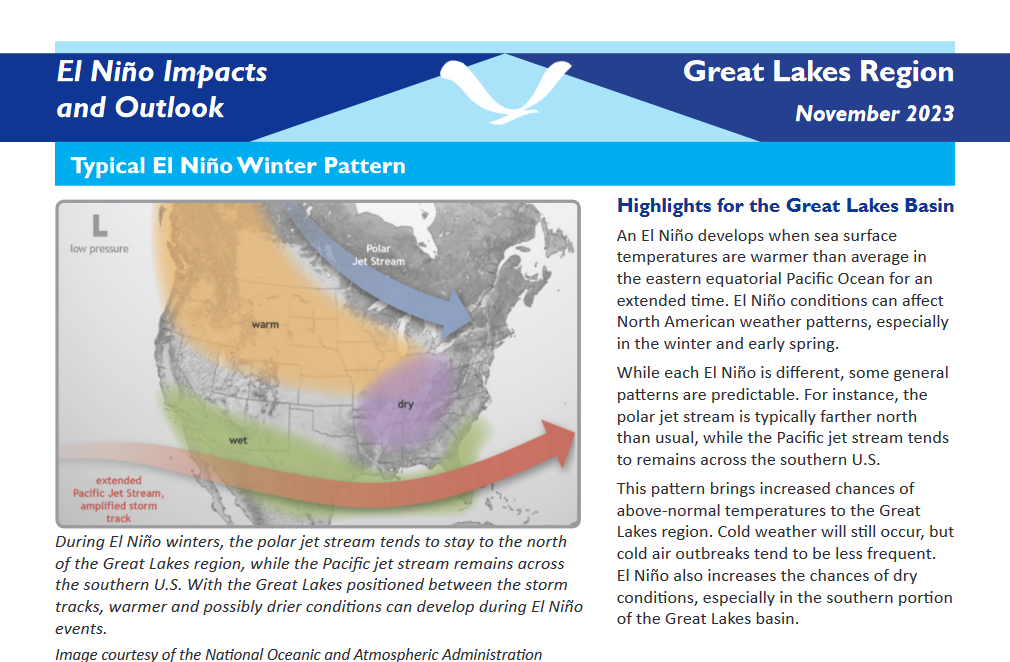
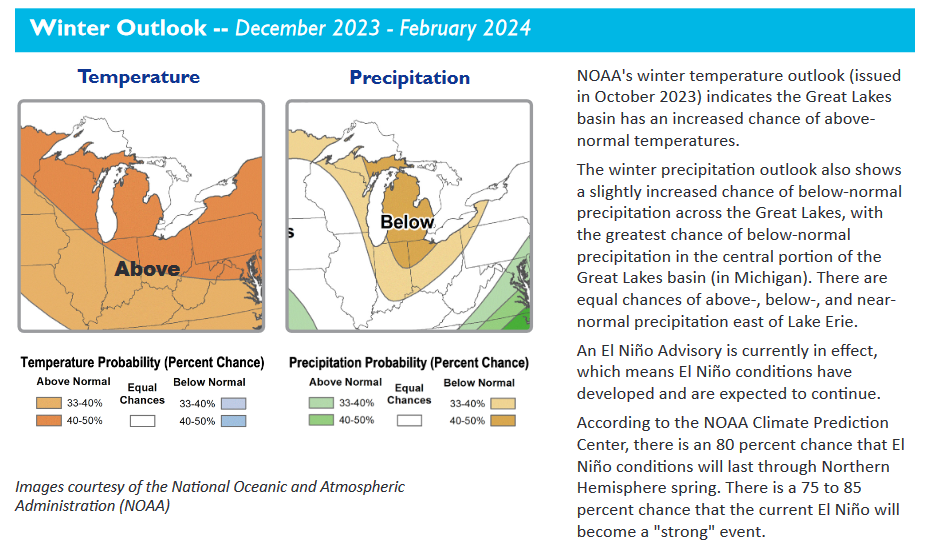
| The first two graphics for this region show the current outlook |
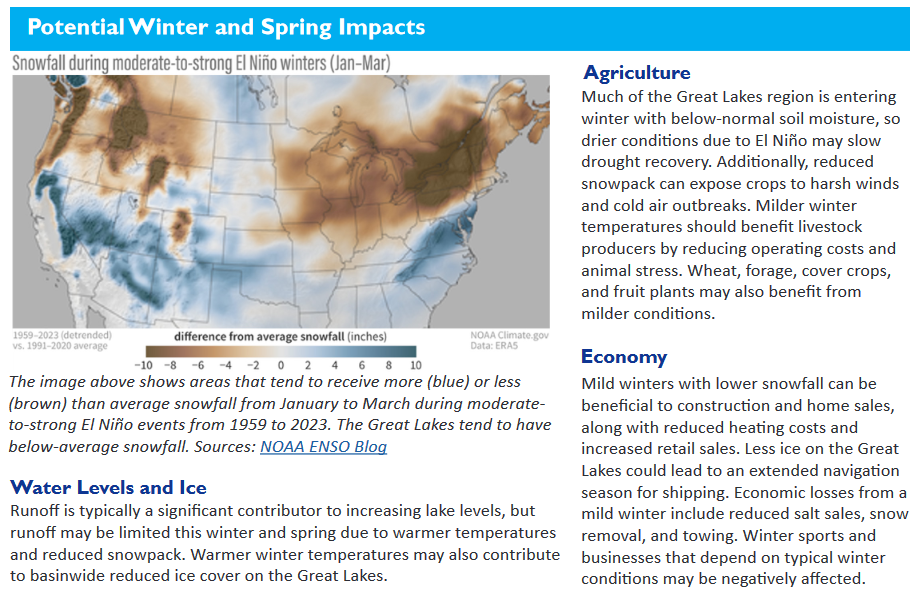
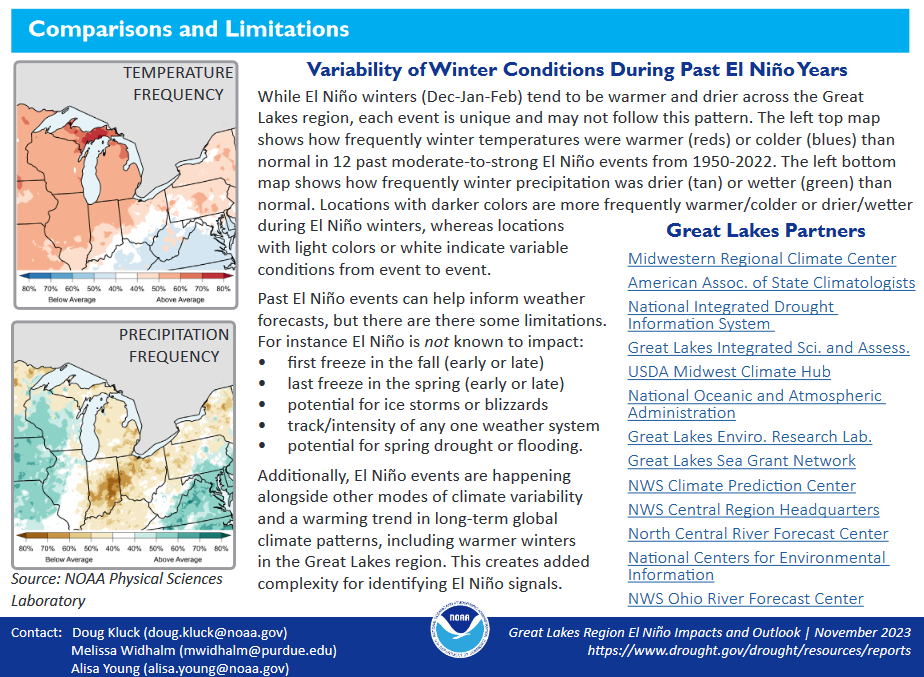
| The fourth graphic is what is most interesting. It shows how temperature and precipitation varied over the last twelve moderate to strong El Nino events. The second graphic shows the outlook issued on October 16, 2023, while the fourth graphic shows what happened during the past twelve moderate to strong El Nino events. They are similar but the current outlook considers factors other than El Nino included trends. The fourth graphic may show local factors better than the official outlook issued by NOAA (CPC). |
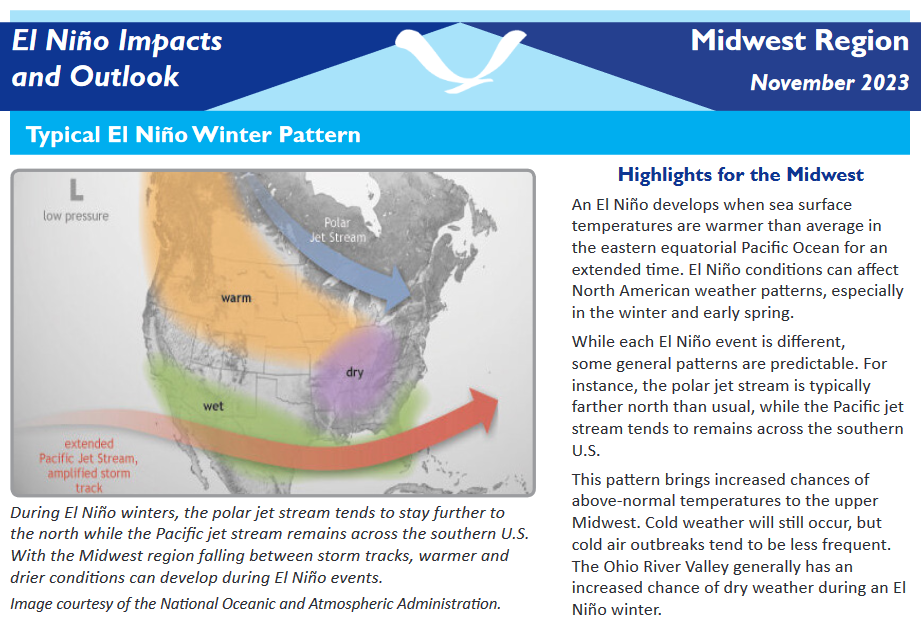
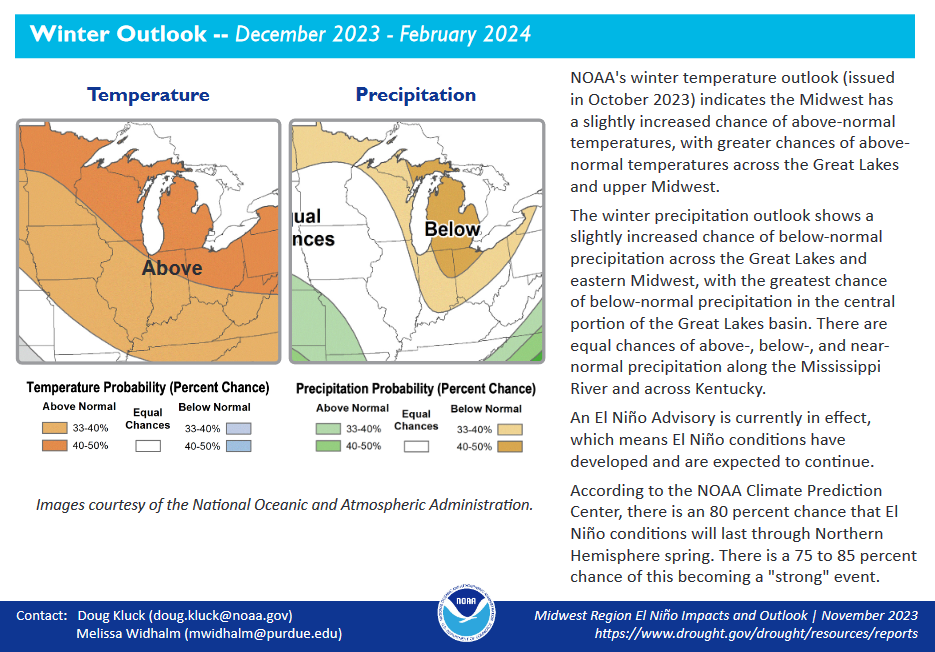
| The first two graphics for this region show the current outlook |
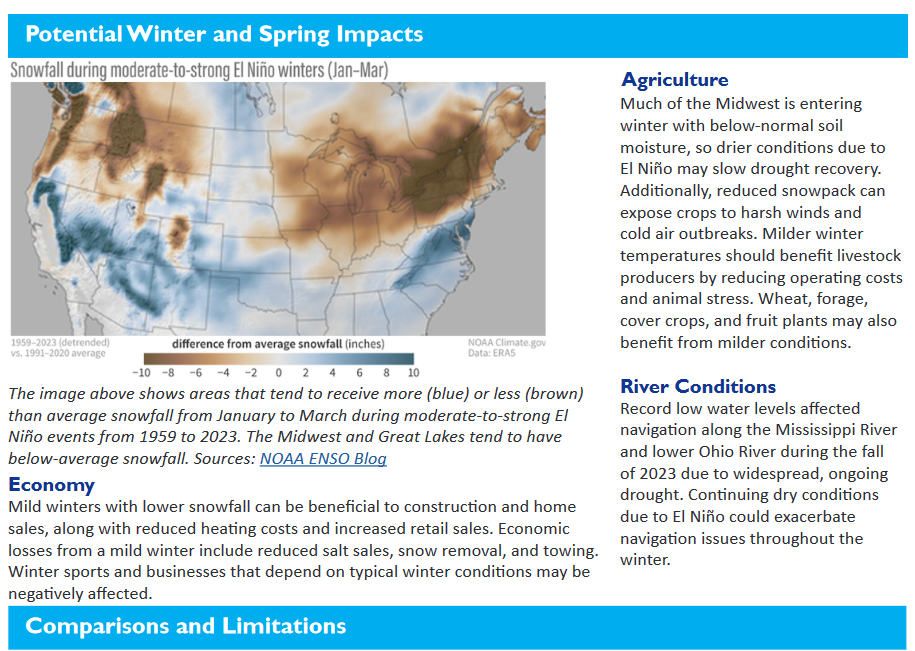
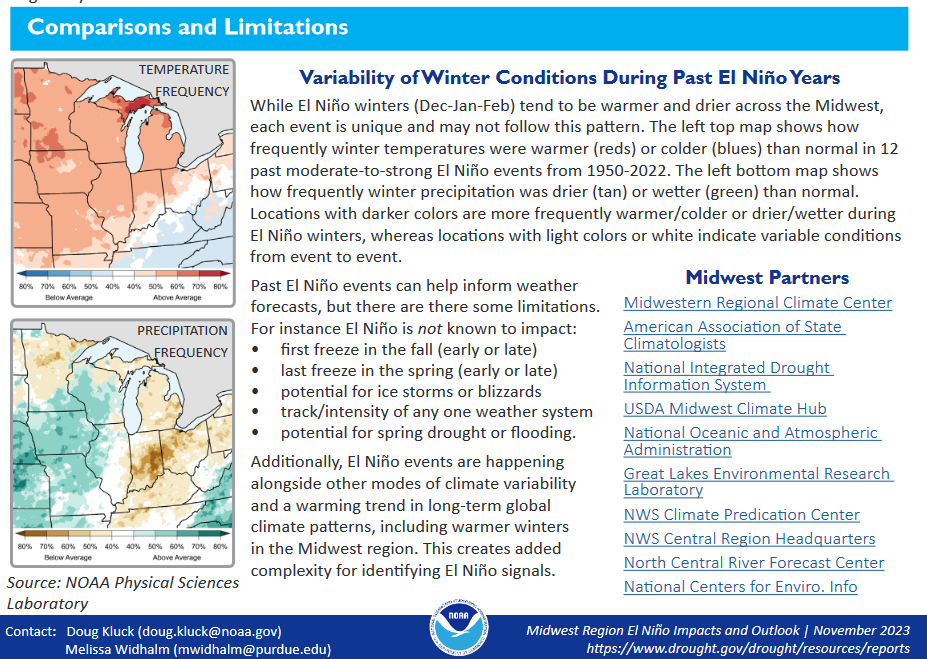
| The fourth graphic is what is most interesting. It shows how temperature and precipitation varied over the last twelve moderate to strong El Nino events. The second graphic shows the outlook issued on October 16, 2023, while the fourth graphic shows what happened during the past twelve moderate to strong El Nino events. They are similar but the current outlook considers factors other than El Nino included trends. The fourth graphic may show local factors better than the official outlook issued by NOAA (CPC). |
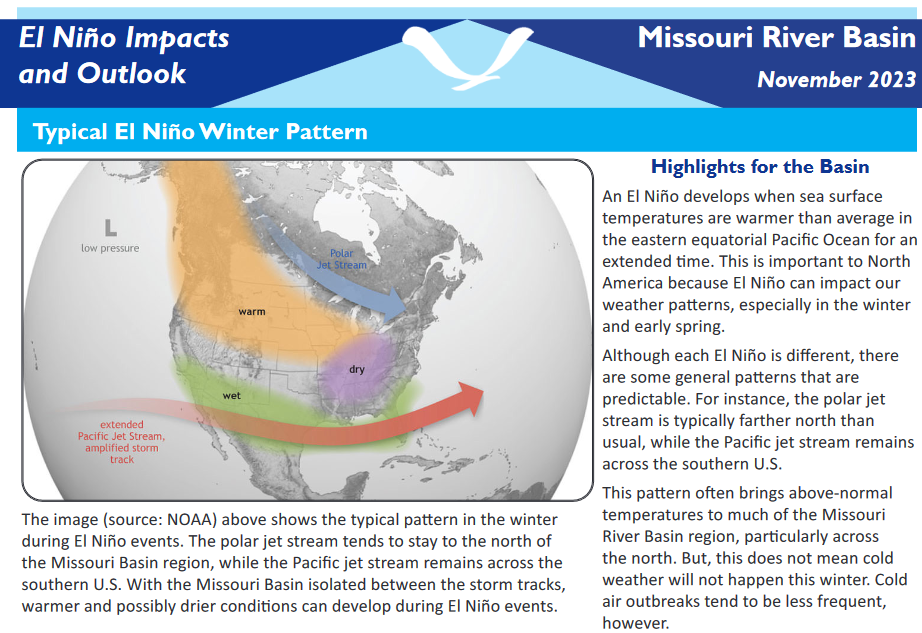
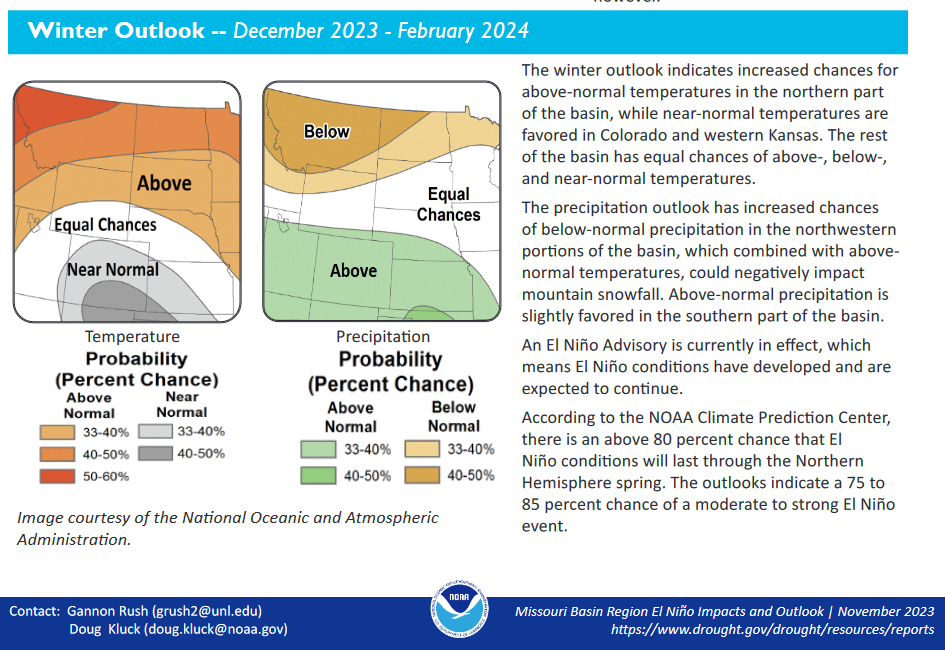
| The first two graphics for this region show the current outlook |
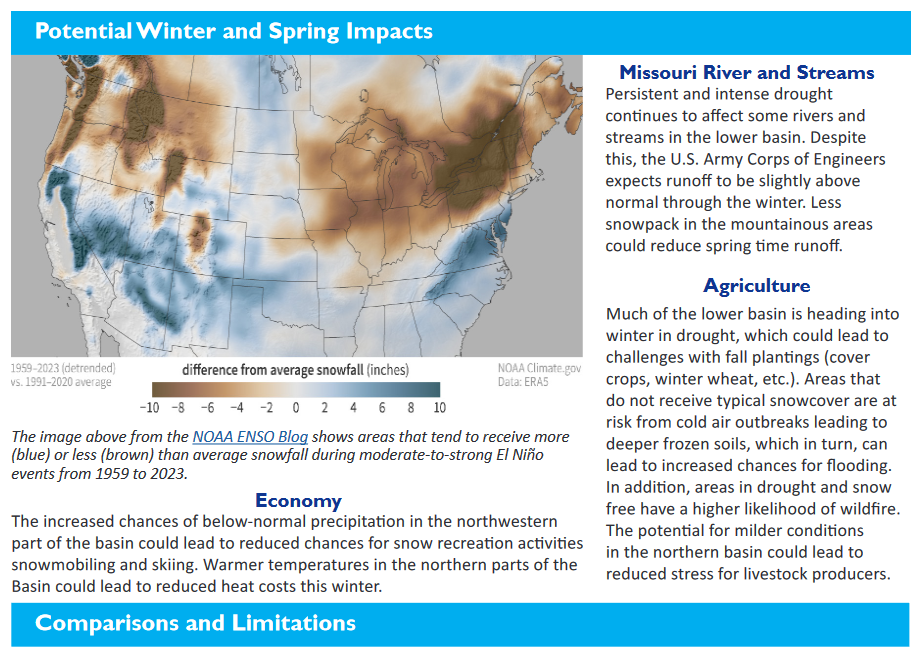
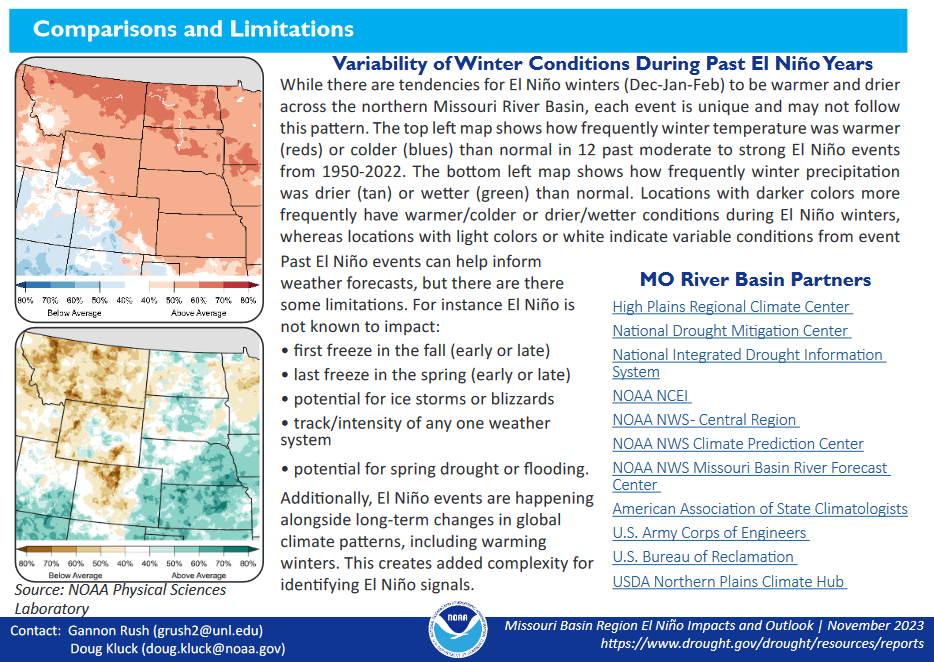
| The fourth graphic is what is most interesting. It shows how temperature and precipitation varied over the last twelve moderate to strong El Nino events. The second graphic shows the outlook issued on October 16, 2023, while the fourth graphic shows what happened during the past twelve moderate to strong El Nino events. They are similar but the current outlook considers factors other than El Nino included trends. The fourth graphic may show local factors better than the official outlook issued by NOAA (CPC). |
–
| I hope you found this article interesting and useful. |
–