This article is based primarily on the October 11, 2023, USDA Crop Bulletin which covers the week ending October 8, 2023. The full USDA Crop Bulletin can be accessed HERE
It seems like perhaps a little better than an average crop which is very good considering the late and poor start. But we are concerned about the Frost/Freeze warning although it is covering a small area than what was forecast for last week.
This article includes a short international review of agricultural conditions which are generally favorable. I also included U.S. crop-related weather forecasts. And there is a report on peanut prices.
We first take a look at the frost/Freeze and other warnings.
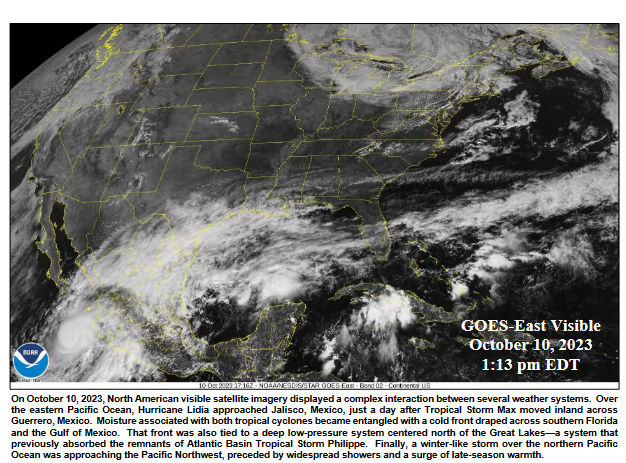
 The following shows how complex weather patterns can be.
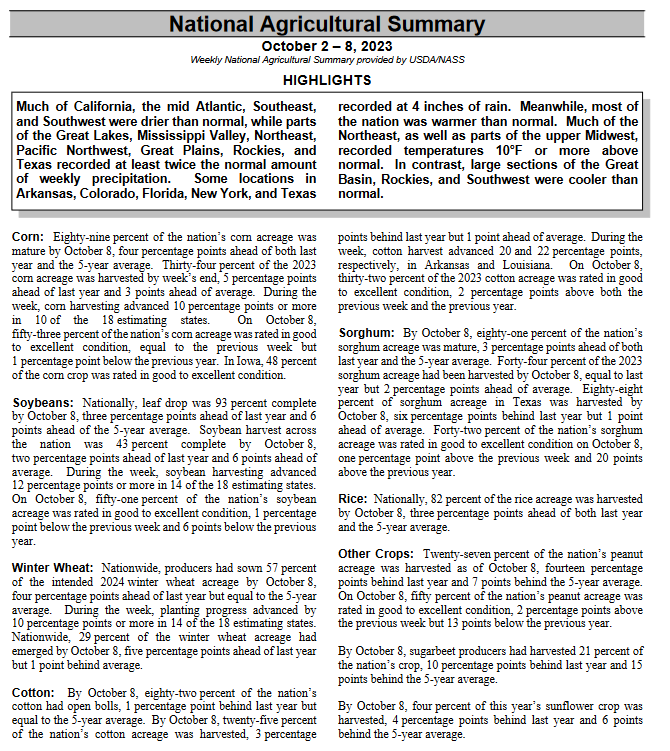
Now on to the National Agriculture Summary. The Tables below the summary have additional data. The boxes with my comments may be incomplete so for crops of interest check the data out yourself to be sure.
| Below is pretty much the same information in table format. However, there is a lot of additional information in these tables. |
–
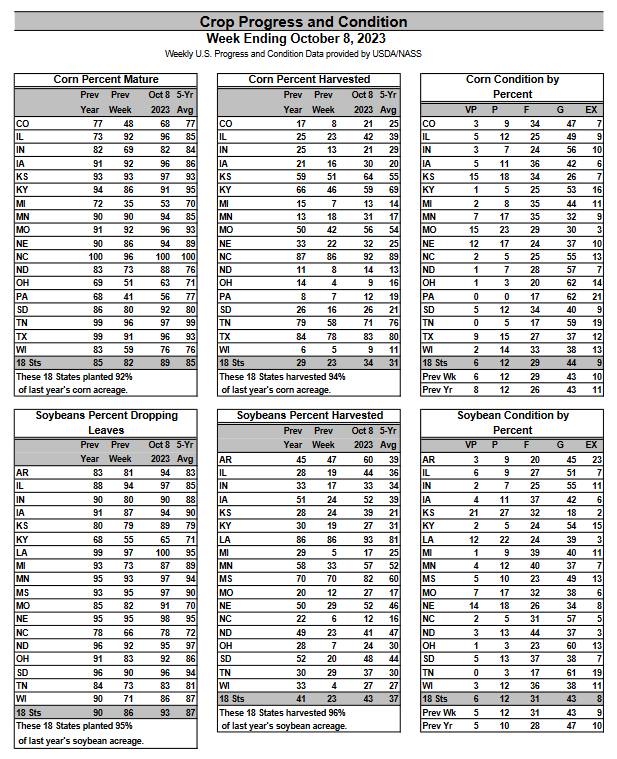
| Corn has recovered from earlier this year to now be even better than last year and the 5-Yr Average which is amazing. Soybeans are performing above their five-year average but previously we learned that the number of acres planted was less than last year. |
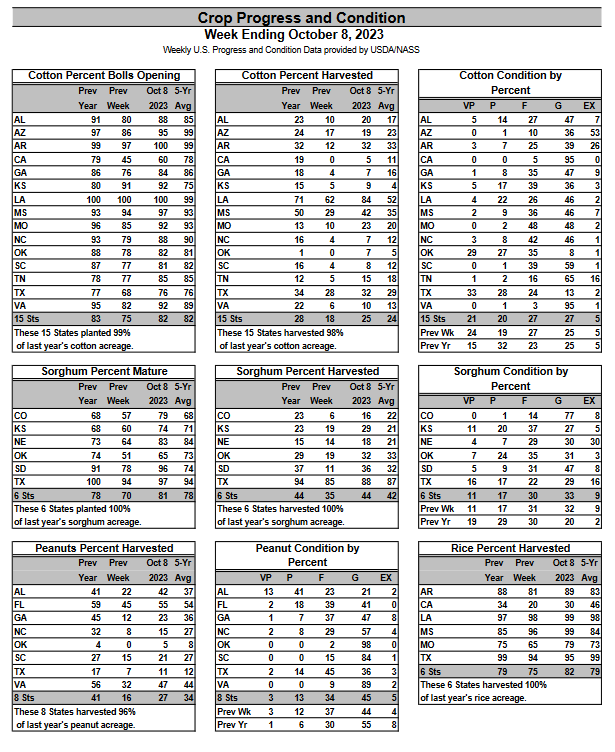
| Cotton is now in line with the five-year average. Sorghum now exceeds its 5-Yr average with the crop condition much improved over last year. Peanut conditions continued to lag last year. Rice exceeds its 5-yr average. |
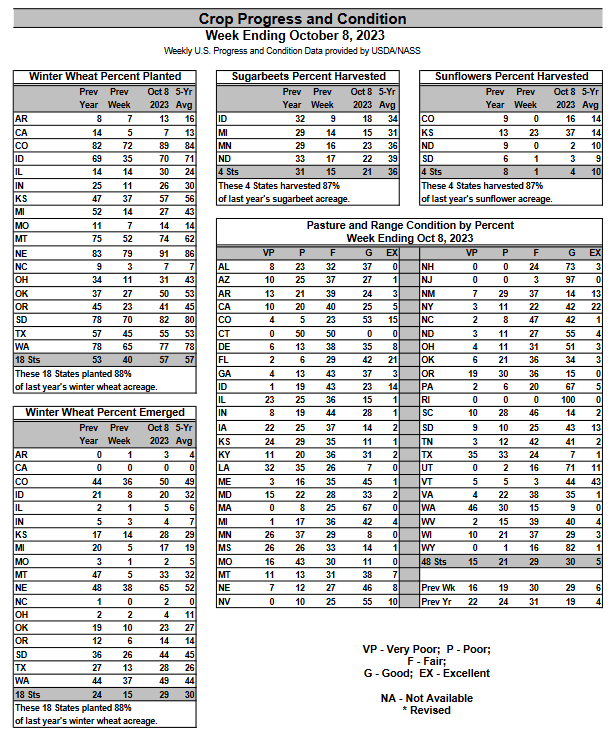
| The harvesting of sugarbeets has just started but is slower than last year. The planting of winter wheat is now above last year and even with their 5-Yr average. The pasture conditions are better than last year but not dramatically. |
Some additional detail is provided HEREIt is mostly some additional weeks of data and it is all in larger print. |
Let us take a look at the weather forecasts.
| 6
– 10
|
|
|
| 8
– 14 |
|
|
| 3
– 4 |
|
|
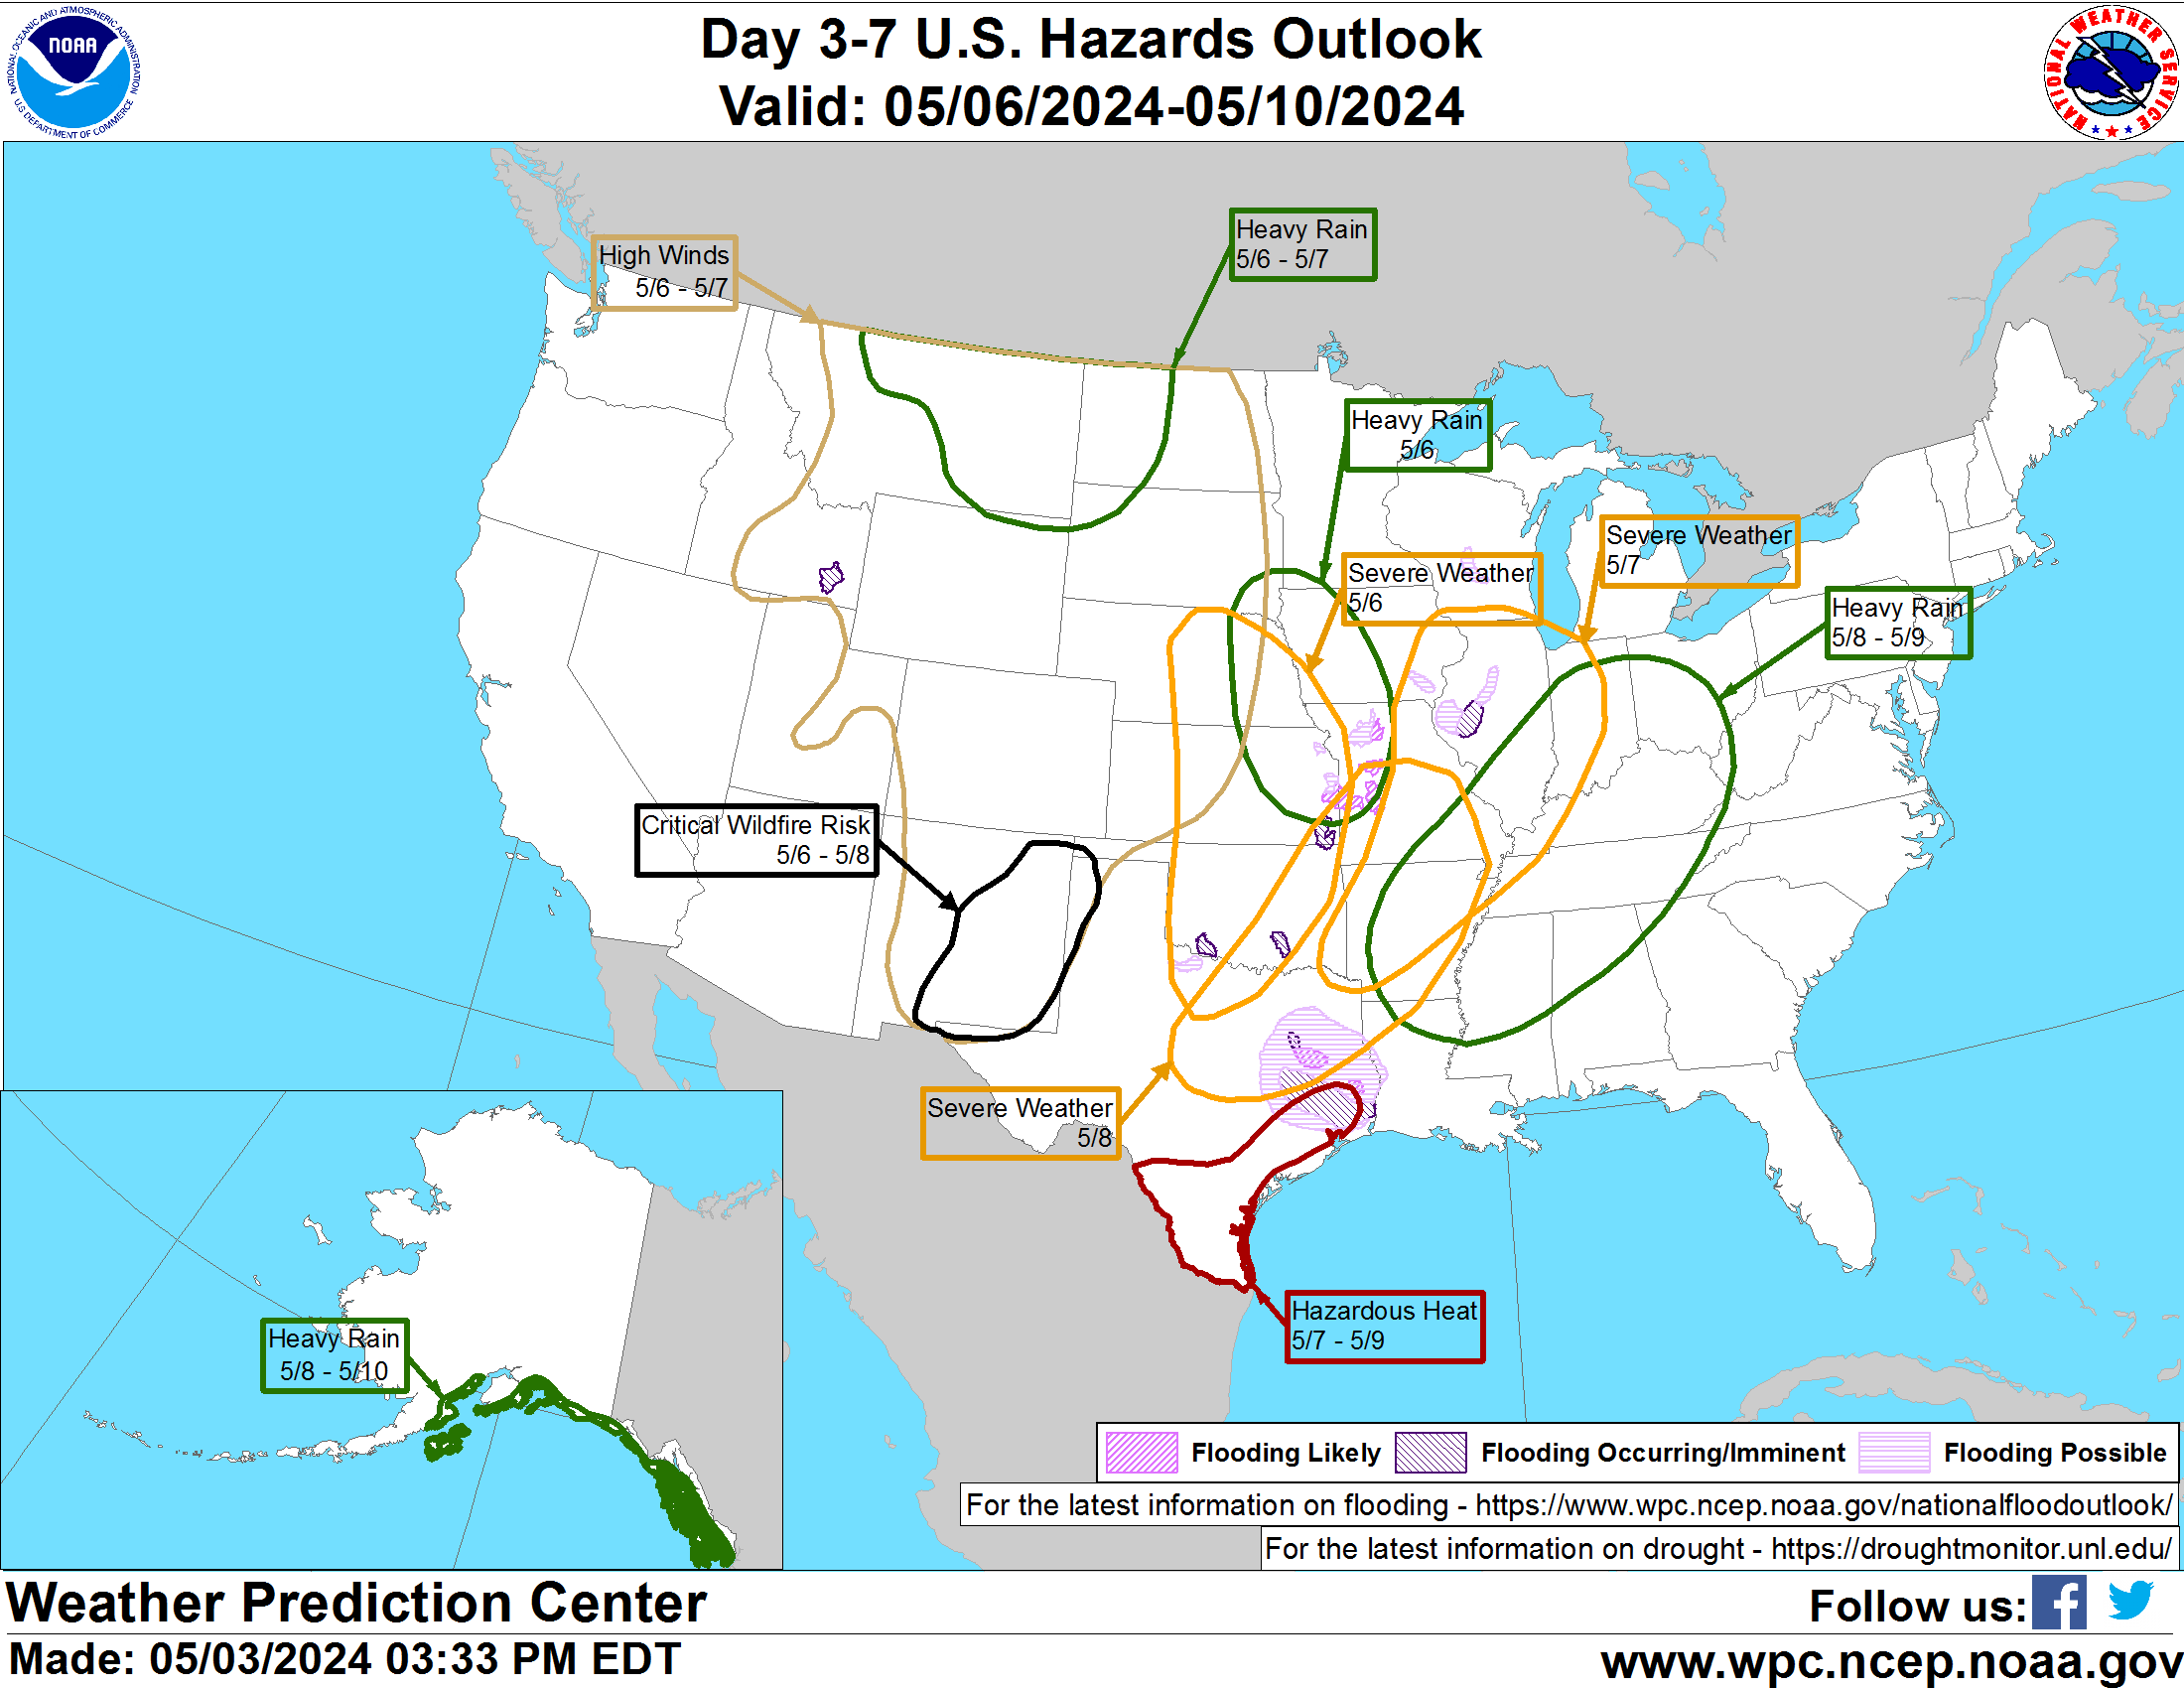
HAZARDS OUTLOOKS
Here is the latest Day 3 -7 and Day 8 – 14 hazards forecasts which are updated only on weekdays. I think it supplements the standard weather forecast.
| You can track the situation daily by accessing our Daily Weather forecast which you can access HERE. But the weather outlook maps in this article also update. Of interest are the areas of reduced precipitation. |
Looking at the month-to-date precipitation

| You can see the wet and dry areas. The first 10 days of October were relatively wet except east of the Mississippi. |
The NASS Report of the Week. This week we report on Peanut Prices.
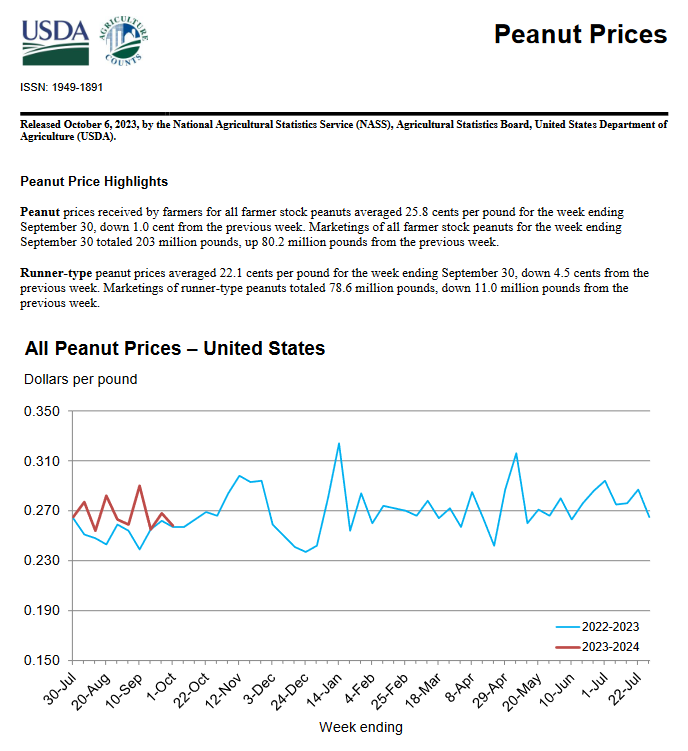
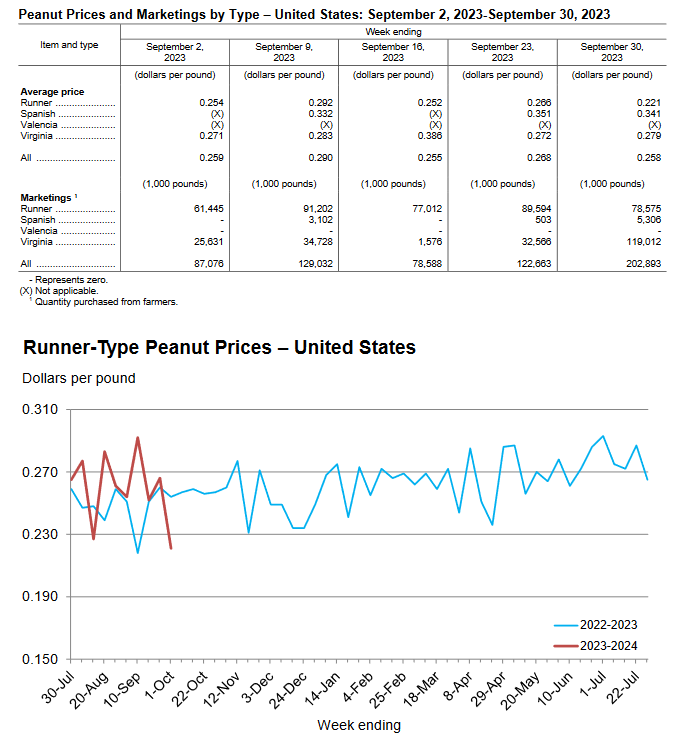
| If you are interested in peanut prices to farmers, the above provides this information. The full report can be accessed HERE. |
International
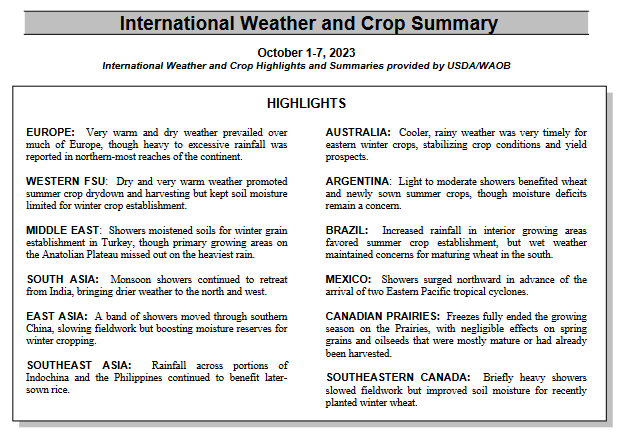
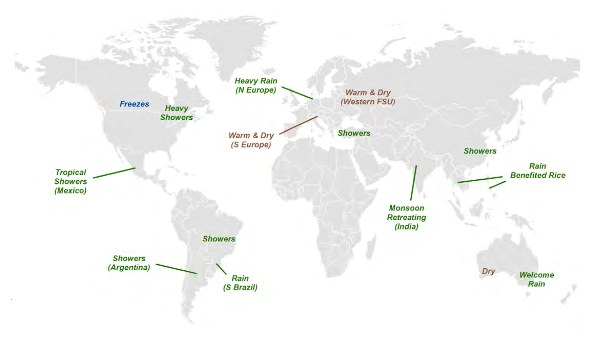
| The table and the map show weather impacts on crops internationally |
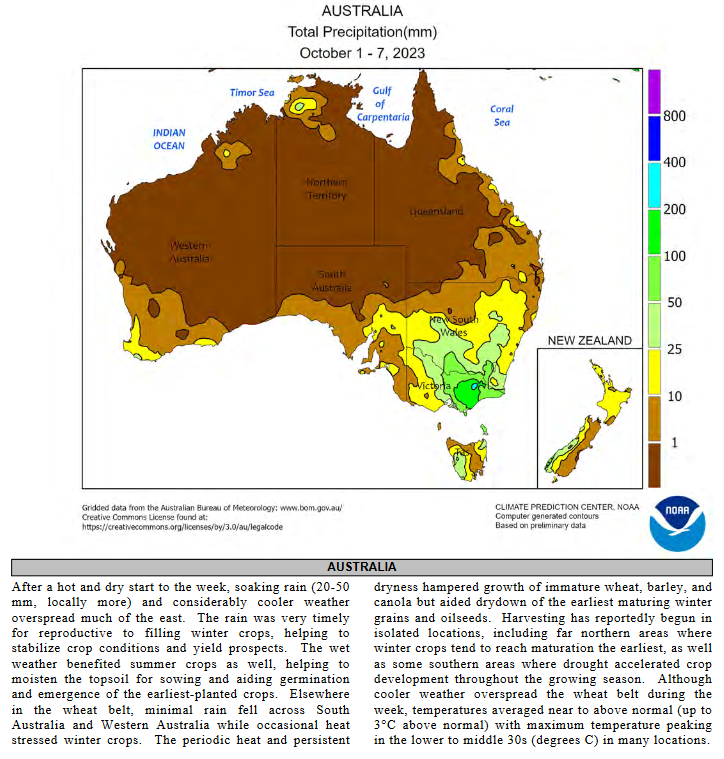
| I am showing Australia because they appear to be doing better than last week. |
Sources of Information
Weekly Updates can be found HERE
and perhaps more directly HERE
Additional Useful Sources of Information
WASDE: World Agricultural Supply and Demand Estimates HERE
NASS Report Schedule HERE
Executive Briefings HERE
Economics and Prices HERE
Office of the Chief Economist HERE.
Drought information by crop HERE
–
| I hope you found this article interesting and useful. |