At the end of every month, NOAA updates its Outlook for the following month which in this case is October of 2023. We are reporting on that tonight.
There have been some significant changes in the Outlook for October and these are addressed in the NOAA Discussion so it is well worth reading. We provided the prior Mid-Month Outlook for October for comparison. It is easy to see the changes by comparing the Mid-Month and Updated Maps.
The article includes the Drought Outlook for October. NOAA also adjusted the previously issued Seasonal Drought Outlook to reflect the changes in the October Drought Outlook. We have included a map showing the water-year-to-date precipitation. We also provide the Week 2/3 Tropical Outlook for the World.
The best way to understand the updated outlook for October is to view the maps and read the NOAA discussion. I have highlighted the key statements in the NOAA Discussion.
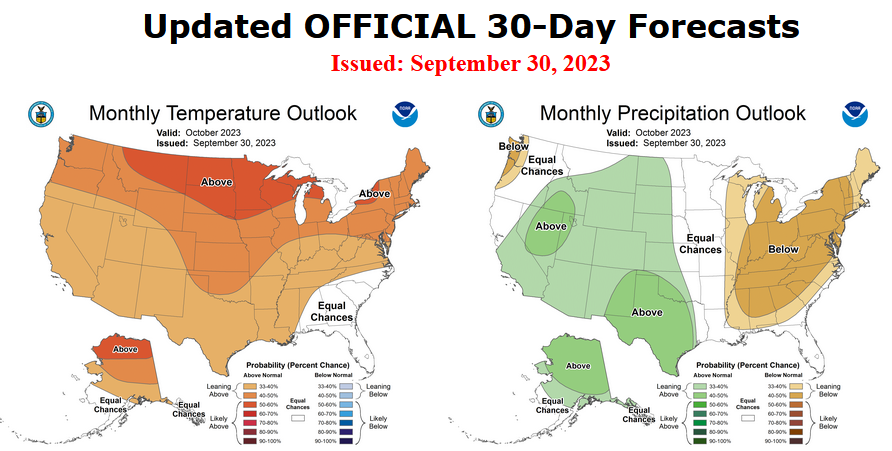
Here is the updated Outlook for October 2023
For Comparison Purposes, Here is the Mid-Month Outlook for October.
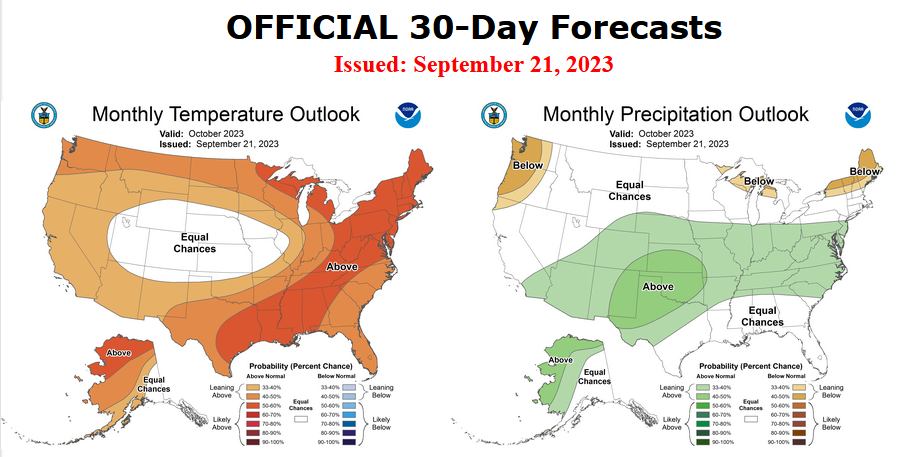
| There have been some significant changes. Remember, it is the top set of maps that are the current outlook for October. |
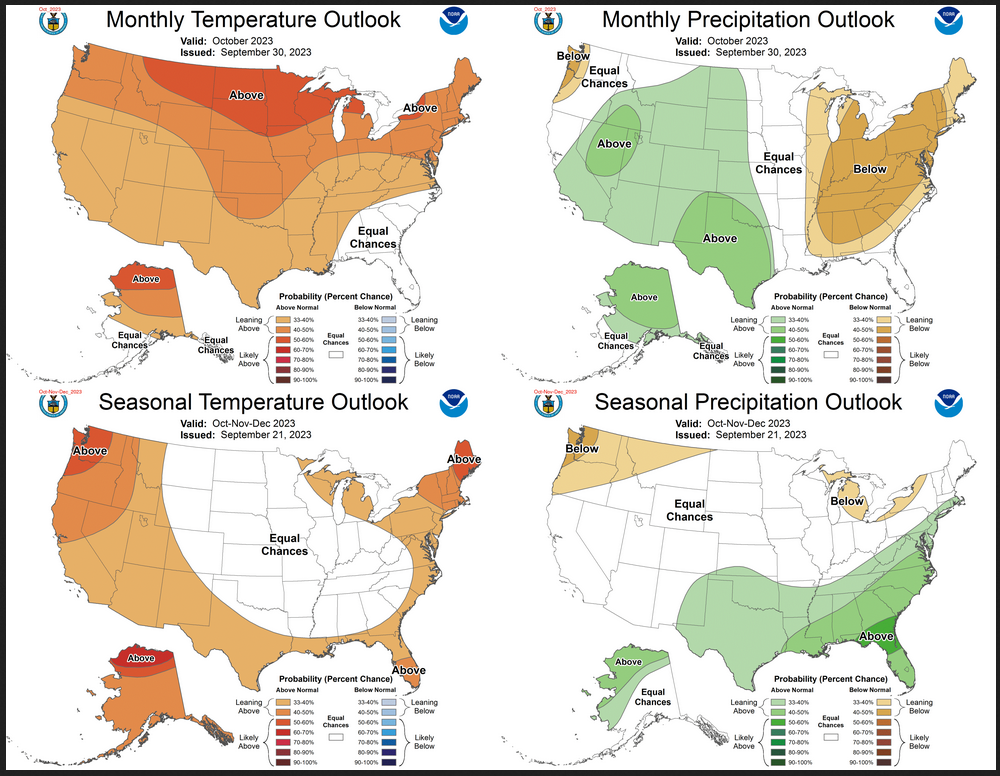
Combination of the Updated Outlook for October and the Three-Month Outlook
| Our regular Daily Weather article can be found HERE. In addition to the short-term forecast it also provides the 6 – 10 day, 8 – 14 day, and Week 3 – 4 Outlooks. That is not a full month but close to it. So it is helpful if one wants to understand how the full-month forecast is expected to vary through the month. And the maps in the Daily article update throughout the month. |
Here are larger versions of the Temperature and Precipitation Outlook maps.
NOAA (Really the National Weather Service Climate Prediction Division CPC) Discussion. I have shown certain important points in bold type. My comments if any are in brackets [ ].
Prognostic Discussion for Monthly Outlook NWS Climate Prediction Center College Park MD 300 PM EDT Sat Sep 30 2023
30-DAY OUTLOOK DISCUSSION FOR OCTOBER 2023
The updated October monthly temperature and precipitation outlook is largely adjusted by dynamical model guidance from the short and medium, extended and subseasonal forecast ranges. The MJO has not become any more organized since the middle of the month and forecasts of its subsequent evolution do not indicate that this is likely to change in the near future. Above-normal sea surface temperatures (SSTs) for waters in proximity to Alaska and across much of the northern Pacific continue to contribute to the forecast.
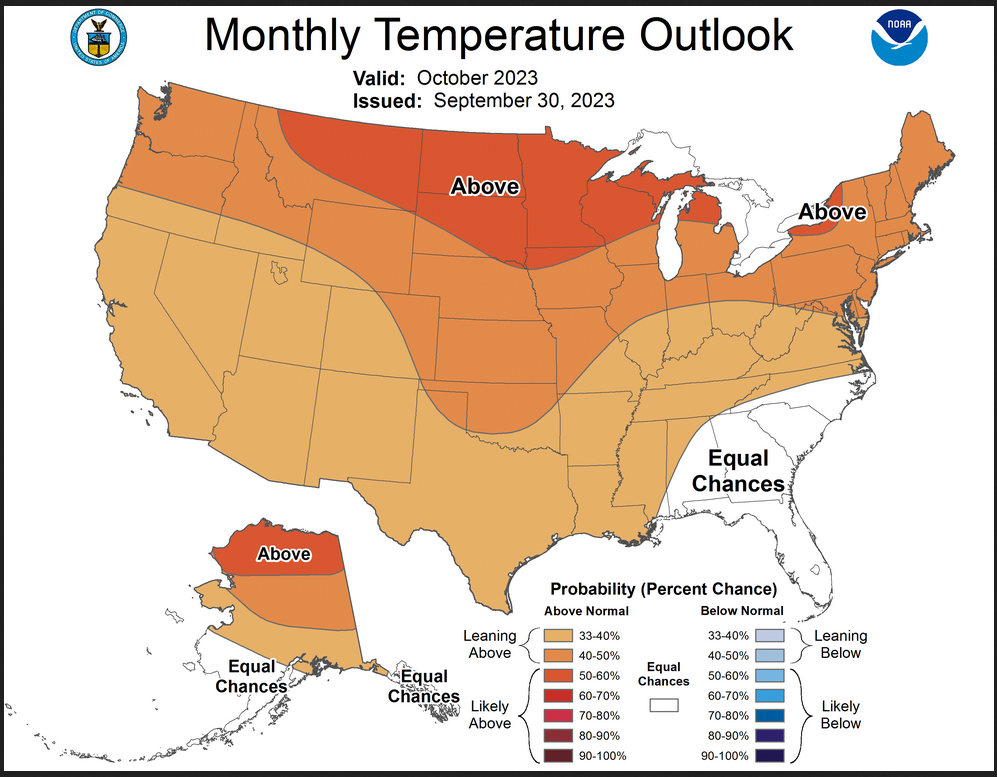
Temperature
The first 1-2 weeks of the month look to see generally progressive flow with transient troughing impacting the CONUS from the western U.S at the start of the month to the eastern seaboard during the second week. Below-normal temperatures are favored during these periods in these regional areas, but are likely to have generally minor impact on the overall monthly average anomalous temperature. Nevertheless, forecast probabilities for above-normal temperatures are reduced from the mid-month outlook for areas in the central and southern Rockies, Southwest, southern Plains and southeast CONUS.
The greatest odds for above-normal temperatures are now primarily centered over the northern Plains. Dynamical model guidance for the Week 3-4 period is generally in good agreement for elevated odds of above-normal temperatures for much of the forecast domain supporting an outlook primarily of favored above-normal temperatures, tempered by typical high uncertainty during the month of October. Only minor changes to the Alaska forecast are made in the update.
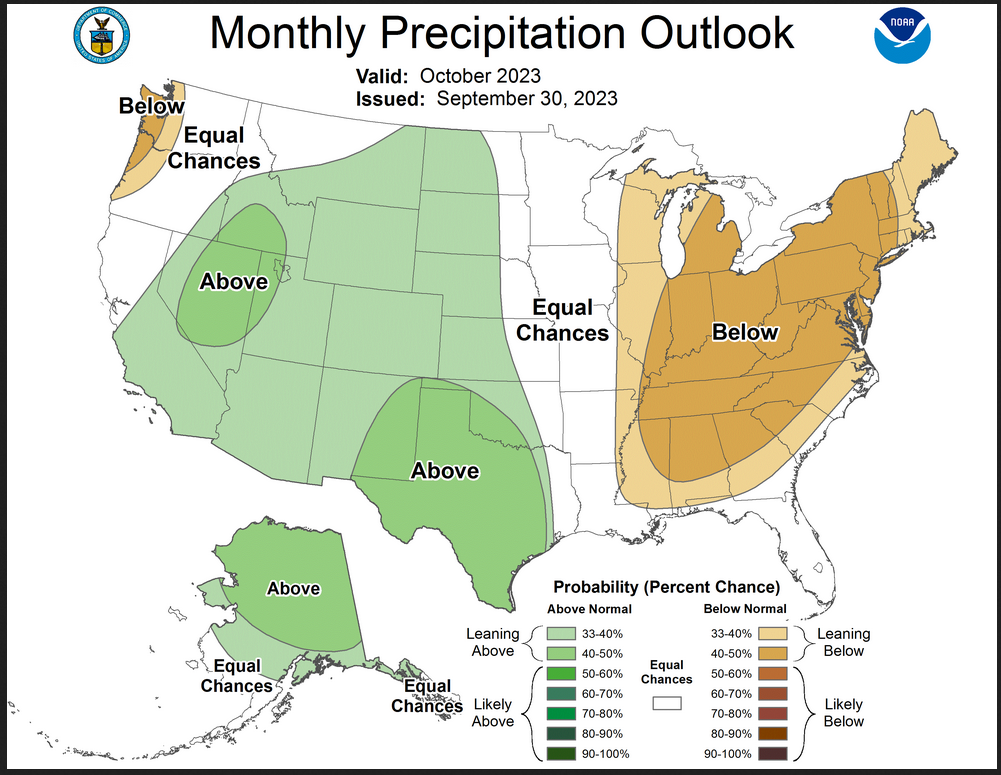
Precipitation
The forecast pattern evolution noted above during the first half of October primarily drove the forecast changes in the October precipitation outlook update from mid-month. Troughing and anomalous meridional flow during early October favors below-normal precipitation for much of the eastern U.S. from the eastern Great Lakes and Northeast southward to the Ohio Valley and Southeast. A dry start to the month in the Pacific Northwest is tempered by the potential for eastward extension of the Pacific Jet and storminess impacting the Pacific Northwest beginning the second week of October. Below-normal precipitation remains favored for parts of the far Pacific Northwest from the initial outlook due to high climatological precipitation amounts in coastal areas during October.
Elevated odds for above-normal precipitation remains forecast for much of the western CONUS, but is also extended northward at low odds to parts of the northern Plains. The highest probabilities for above-normal monthly precipitation amounts is highlighted for Texas (anticipated heavy rainfall during the first week of October) and for parts of the interior west – also for short term favored precipitation. Only minor changes are made to the forecast for Alaska with above-normal precipitation now favored for more of the state.
Drought Outlook
Here is the newly issued Drought Outlook for the month.
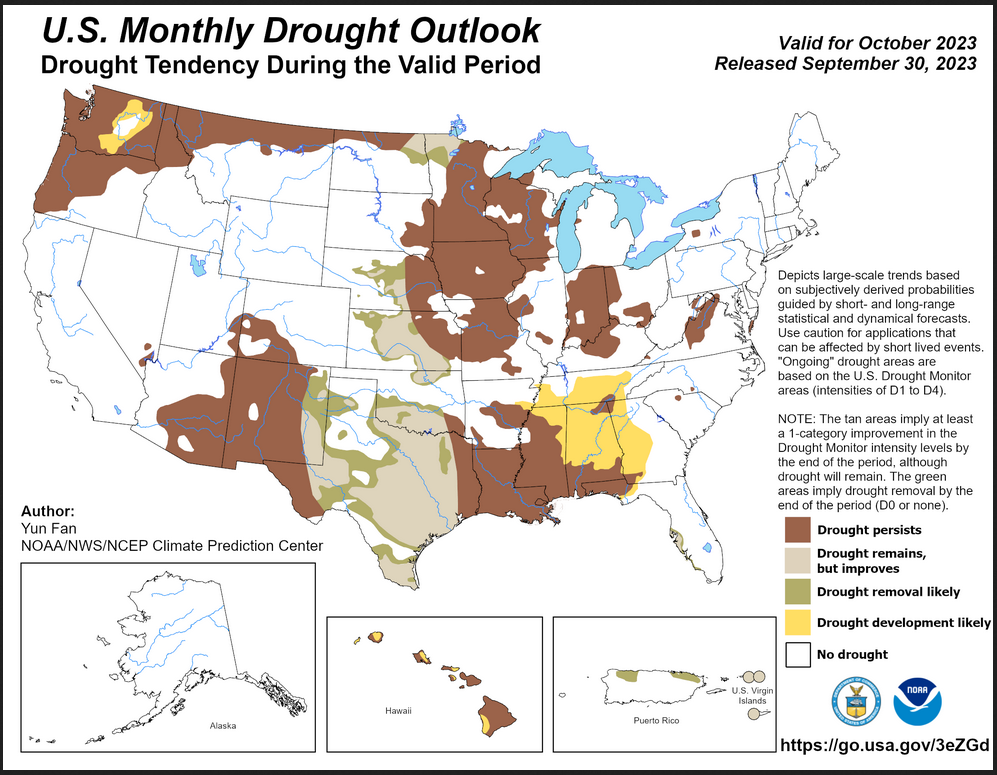
| You can see where drought development or reduction is likely. Overall the forecast is for a slight reduction of drought conditions. The summary and detailed discussions that accompany this graphic can be accessed HERE, but the short version is shown below. |
Here is the short version of the drought summary
Latest Monthly Assessment – Over the past 4 weeks, drought expanded and intensified across much of the Mississippi Valley, Ohio Valley, and parts of the Great Lakes and Four Corners regions. Two to three class degradation was observed in the Lower Mississippi Valley and Ohio Valley, due to the anomalous dry weather accompanied by excessive heat over the regions. During the last two weeks, periods of heavy rainfall across the Northern Rockies and parts of the Great Plains brought some drought relief over these regions. During September, heavy rainfall along much of the East Coast brought by tropical storms also led to drought improvement/removal over the Carolinas and Mid-Atlantic region. Drought continued to expand in Hawaii over the last four weeks. Less than 61 percent of Hawaii was in drought at the start of September, but drought covered more than 82 percent of the state as the month ended. Increased chances of below-normal precipitation with a dry climatology in October favors persistence or development across the Pacific Northwest eastward to the northern tier of the Northern Rockies and Northern High Plains. Persistence is likely for the existing drought over Arizona, New Mexico and adjacent areas due to weak or lacking wet signals in precipitation outlooks and a drier climatology. Drought improvement/removal is likely across northwestern Minnesota where 1-2 inches of precipitation is forecast in the next 7 days. Improvement or removal is favored for parts of the Central and Southern Plains due to 1-3 inches of rainfall forecast in the next 7 days, and also the monthly forecast calling for above-normal precipitation. Persistence is favored for the reminder of existing drought in the High Plains, Midwest, Southern region and Southeast due to lack of a wet signal and near to above-normal temperatures forecast for the coming month. Alaska currently is drought free and is likely to continue for October as the region enters the cold season of the year. Odds also slightly favor improvement in drought areas of Puerto Rico and the western Virgin Islands. In contrast, drought persistence or intensification is forecast across the Hawaiian Islands.
We also have an updated Seasonal Drought Outlook (link).
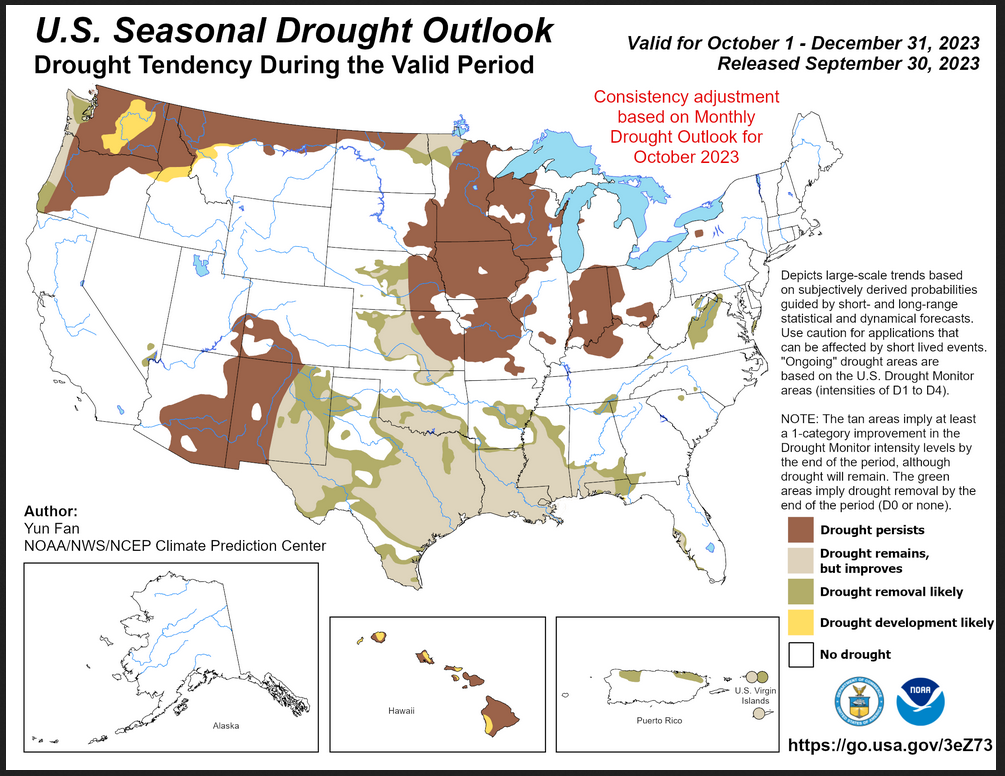
| It is this month different than the single-month outlook but it covers a longer period of time. It does not seem to be consistent with a strong El Nino but it does show improvement over current conditions. |
| To update this forecast (which updates on Tuesdays) click HERE |
Month-to-date Temperature as the current month evolves can be found at https://hprcc.unl.edu/products/maps/acis/MonthTDeptUS.png
Month-to-date Precipitation as the current month evolves can be found at https://hprcc.unl.edu/products/maps/acis/MonthPNormUS.png
CLIMAS Podcast
No Podcast this Month
Water-year-to-date precipitation. Here is the LINK
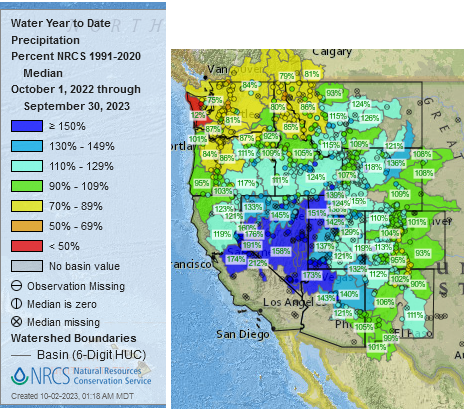
| This provides a very clear picture of the weather pattern since October 1, 2022 i.e. the full water year. It has been a wet year but also a very warm year so we see drought expanding even with increased precipitation. |
Fire Outlook (The Site has Moved and I have not figured out how to print images from the new site yet. The link is HERE.
| I hope you found this article interesting and useful |