Usually for this article where I provide a review of the prior month, I reproduce John Bateman’s email in its entirety. But John Bateman has not yet sent out his email because NCEI has not yet published their review of August 2023. I suspect the delay is due to the Labor Day weekend but there may have been other factors. But I also like to add a few additional graphics, namely the state ranking maps after John Bateman’s email. These maps show how temperature and precipitation for each state rank relative to the 129 (article originally mistakenly said 139) years of what is considered to be the most reliable data we have.
That information became available today so I am publishing it tonight. When NCEI issues their report and if John Bateman sends me his email, I will publish it or the NCEI report which is the basis for John Bateman’s email separately.

Now we will discuss the State Rankings for the single month of August 2023. Let me remind you that this shows where the Temperature and Precipitation in August rank within the 129-year history of that state. It is a good way to put August in perspective.
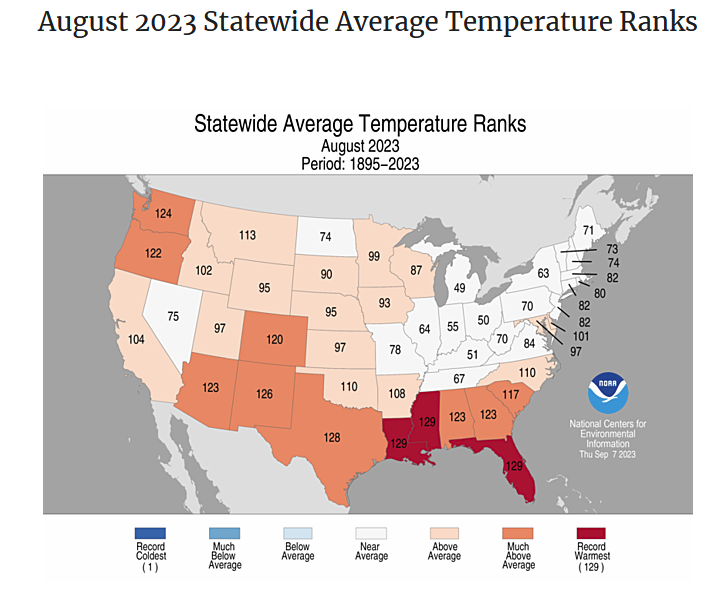
| Three states set records for average temperature. That is a lot. Many others were much above average. |
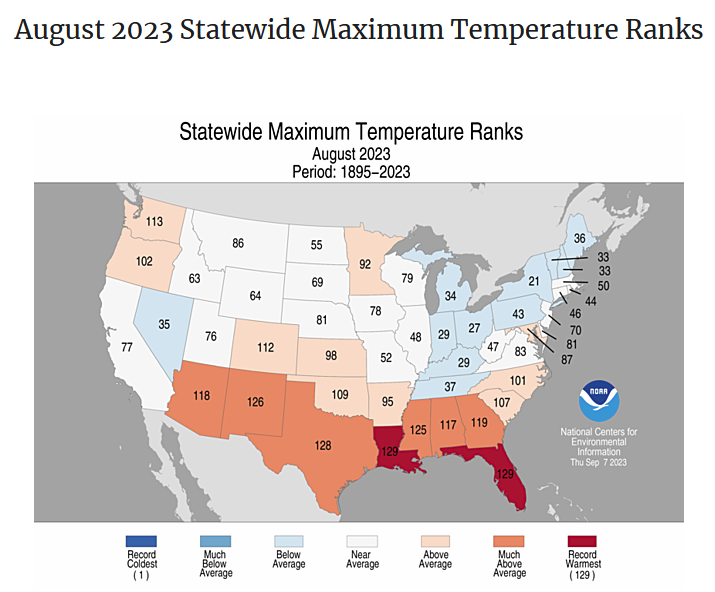
| But only two states set a record for the maximum temperatures. |
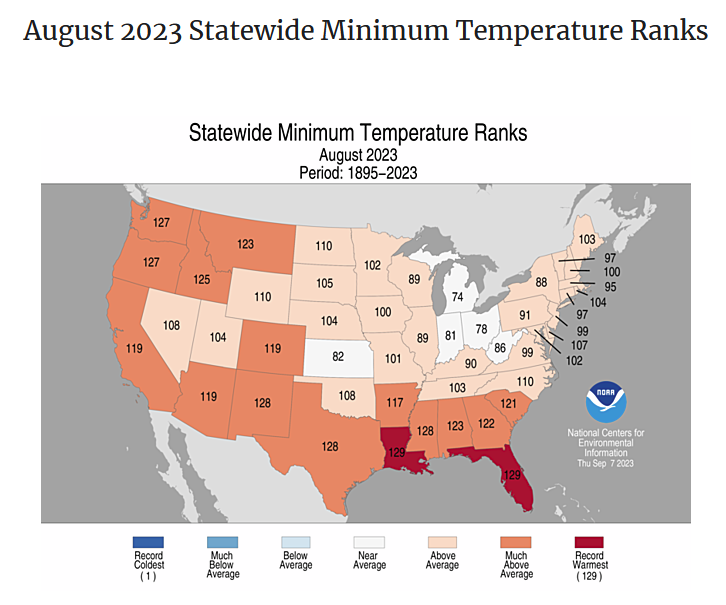
| The same two states set a record for the highest minimum temperatures usually meaning there was a lot of humidity. There were a lot of states that were much above average but not always the same states that were much above average in the first measure and graphic which is average temperature. It can get a bit confusing. High minimum temperatures mean a high use of air conditioning and for people without air conditioning, uncomfortable nights. |
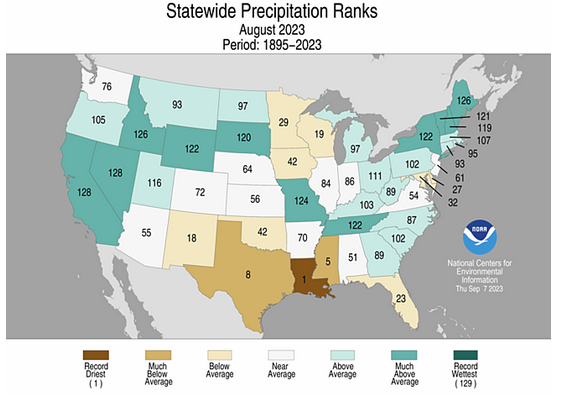
| One state set a record for being the driest in its history. However, there were many states that had much above-average precipitation. |
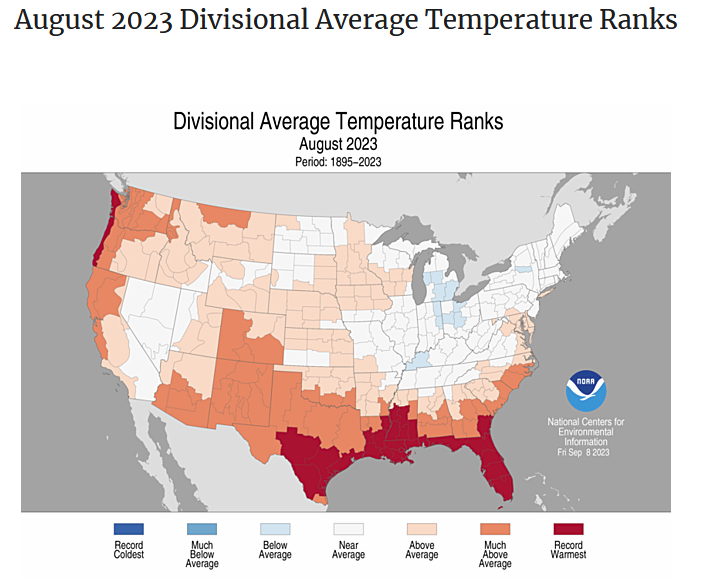
| Sometimes looking at the climate divisions within a state reveals information that looking statewide hides. Usually, I just show the climate division data just for precipitation but this month I am showing it for both temperature and precipitation. The above is for temperature. I am only showing the climate divisions data for average temperature but notice that a large part of Texas had record average temperatures even though in one of the graphics above, Texas as a whole did not set a record. |
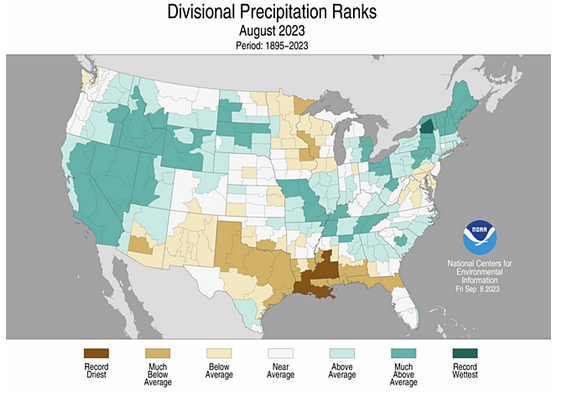
| When we look at average precipitation by climate division we see an interesting pattern within Mississippi and also in Upper New York State. I have the data by county but I try to keep these articles fairly short as one can get really tired if I present all the maps that I have. I would provide the link for all the maps but you have to know how to use that website to be able to set what you want to see. |
–
| I hope you found this article interesting and useful. |
–
Thanks Sig, I’m following all your weather related articles with interest
Marie
Sorry, I did not notice your comment sooner. I am very glad that you find my articles interesting. Tonight I will be publishing an article on NOAA’s Four-Season Outlook that they issued today.