At the end of every month, NOAA updates its Outlook for the following month which in this case is September of 2023. We are reporting on that tonight.
There have been some dramatic changes in the Outlook for September and these are addressed in the NOAA Discussion so it is well worth reading. We provided the prior Mid-Month Outlook for September for comparison. It is easy to see the changes by comparing the Mid-Month and Updated Maps.
The article includes the Drought Outlook for September. NOAA also adjusted the previously issued Seasonal Drought Outlook to reflect the changes in the September Drought Outlook. We have included a map showing the water-year-to-date precipitation. We also provide the Week 2/3 Tropical Outlook for the World.
The best way to understand the updated outlook for September is to view the maps and read the NOAA discussion. I have highlighted the key statements in the NOAA Discussion.
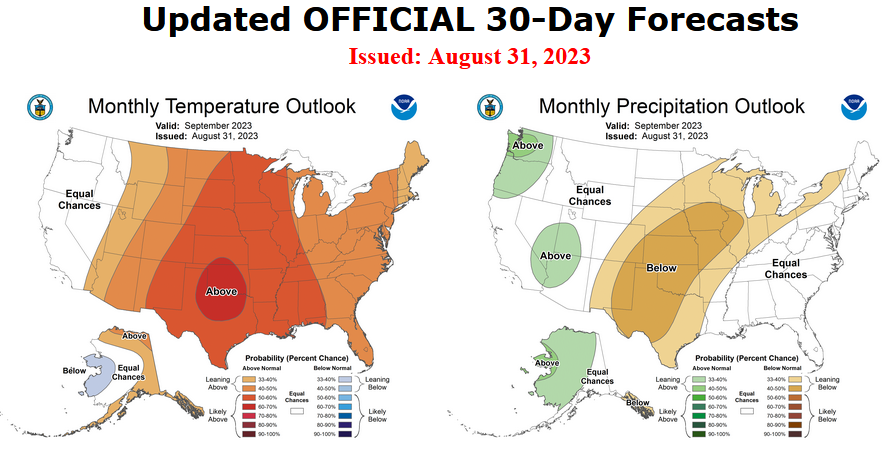
Here is the updated Outlook for September 2023
For Comparison Purposes, Here is the Mid-Month Outlook for September.
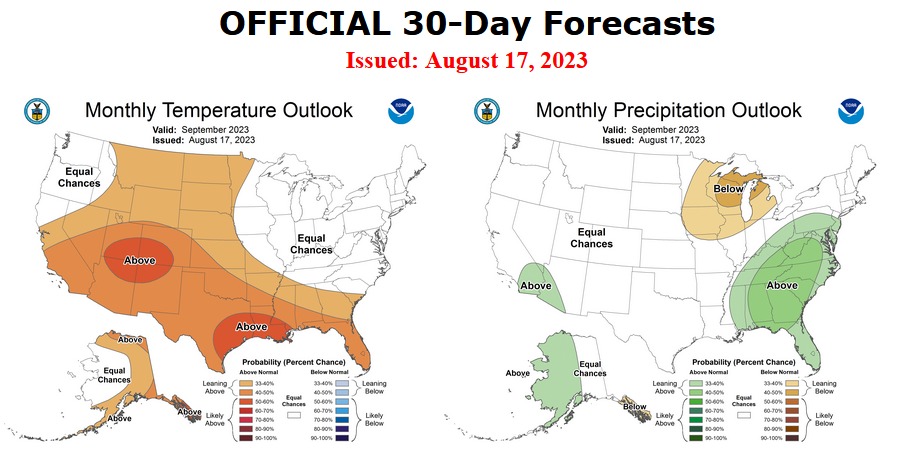
| There have been some dramatic changes. Remember, it is the top set of maps that are the current outlook for September. |
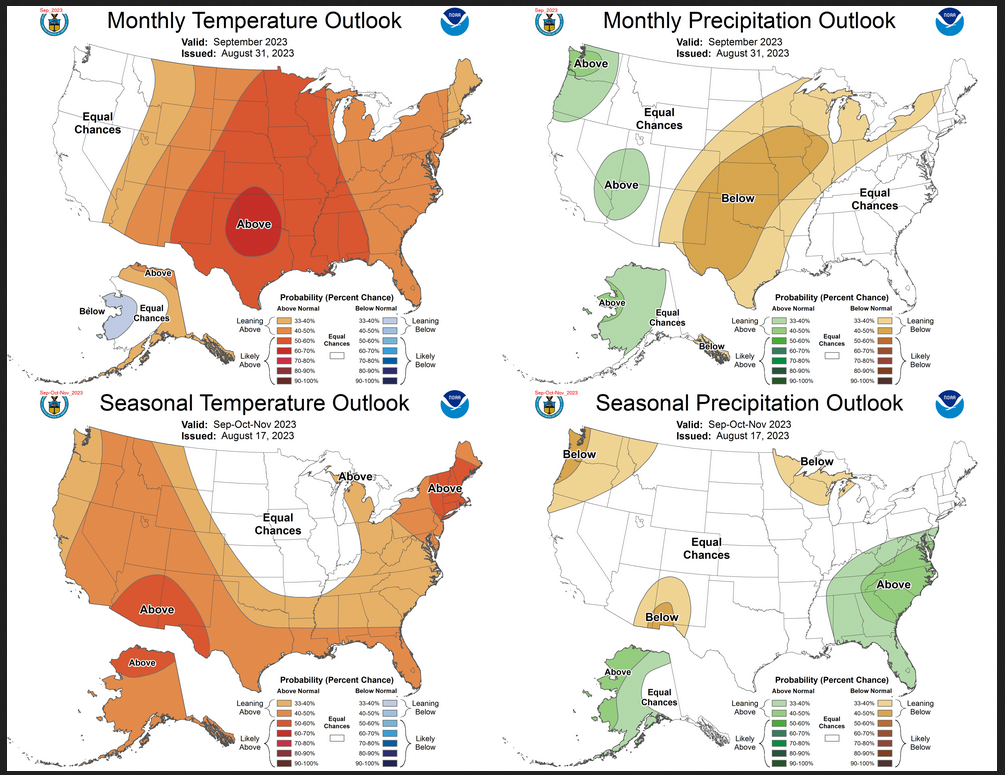
Combination of the Updated Outlook for September and the Three-Month Outlook
| Our regular Daily Weather article can be found HERE. In addition to the short-term forecast it also provides the 6 – 10 day, 8 – 14 day, and Week 3 – 4 Outlooks. That is not a full month but close to it. So it is helpful if one wants to understand how the full-month forecast is expected to vary through the month. And the maps in the Daily article update throughout the month. |
Here are larger versions of the Temperature and Precipitation Outlook maps.
NOAA (Really the National Weather Service Climate Prediction Division CPC) Discussion (I have shown certain important points in bold type. My comments if any are in brackets [ ])
30-DAY OUTLOOK DISCUSSION FOR SEPTEMBER 2023
The current state of the El Niño Southern Oscillation (ENSO) remains in the positive phase with the latest weekly observed Niño 3.4 Index value standing at +1.5 degrees Celsius. Meanwhile, the magnitude of the Real-time Multivariate (RMM) based Madden Julian Oscillation (MJO) index has weakened following a period of enhancement over the Western Hemisphere, but is forecast to potentially quickly translate and emerge over the Maritime Continent during the next two weeks. Any intraseasonal signal over the Western Hemisphere or Indian Ocean would destructively interfere with the El Niño base state. Natural analog composites derived from the current states of the MJO and ENSO are reflective of this destructive interference, as the resultant 500-hPa pattern across North America based on ENSO and the MJO inputs are almost completely out of phase with each other. Natural analogs based on the current evolution of the Arctic Oscillation (AO), North Atlantic Oscillation (NAO), and the Pacific North America (PNA) index, generally align more closely with the MJO composites for much of the forecast domain. Composites from the combined ENSO/MJO/AO/NAO/PNA state for the month of September depict above-normal 500-hPa heights over the eastern and southwestern Contiguous United States (CONUS) and over the southern two-thirds of Alaska. Anomalous mid-level troughing is depicted off the coast of the Pacific Northwest.
As we close out the month of August, short term dynamical model guidance is increasingly relied upon with the official short and medium range outlooks from the Weather Prediction Center (WPC), 8-14 Day Outlooks from the Climate Prediction Center (CPC), and Weeks 3-4 Outlooks from CPC forming the backbone of the updated September outlooks. Dynamical model guidance from the Climate Forecast System Version 2 (CFSv2), the Global Forecast System (GFS), the European Centre for Medium Range Weather Forecasts (ECMWF), and Environment and Climate Change Canada (ECCC) were utilized to supplement the official outlooks. These inputs predict anomalous ridging over the eastern two-thirds of the CONUS and Southeast Alaska during the beginning of the month. Anomalous troughing is depicted across much of northern Alaska and the western CONUS. By mid-month, above normal heights are forecast to be firmly established across the central CONUS with cyclonic flow persisting across much of Alaska. The latest CPC Week 3-4 Outlook indicated the potential for persistent ridging across the central CONUS for much of the month with weak troughing indicated across the west and east coasts of the CONUS and across western Alaska.
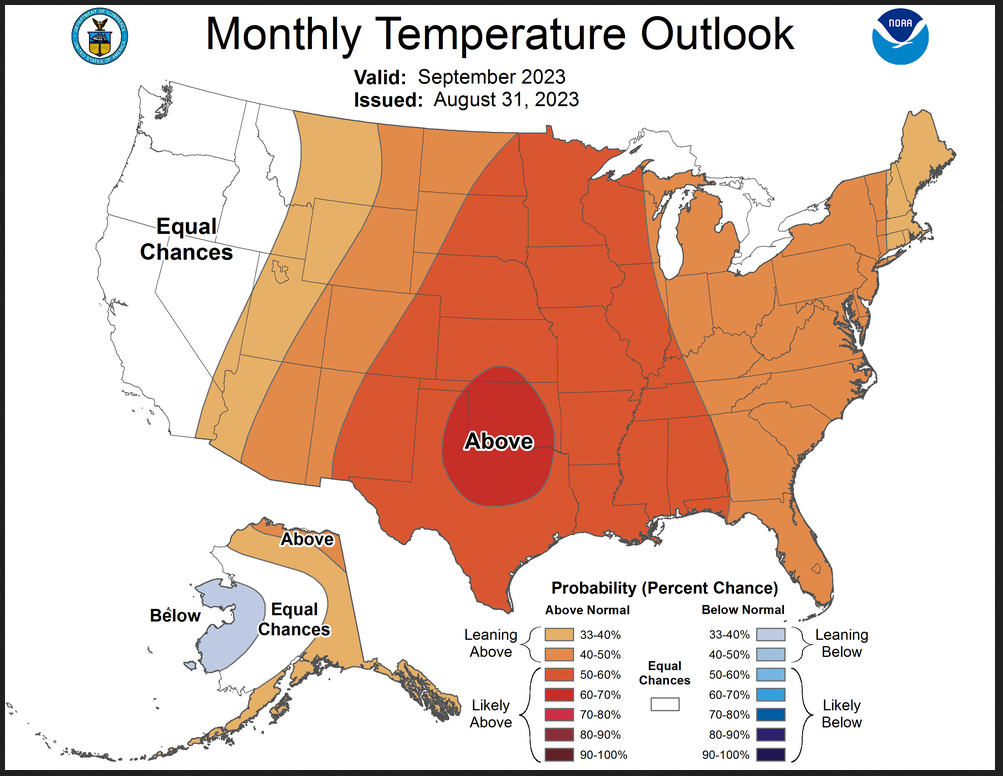
Temperature
The updated September temperature outlook indicates increased probabilities of above normal temperatures across the eastern two-thirds of the CONUS. The greatest confidence for above normal temperatures is across parts of the Southern Plains, where probabilities exceed 60 percent. This represents an eastward shift of the region of favored above normal temperatures relative to the mid-month outlook, due to the likelihood for strong, anomalous ridging over the central CONUS throughout most of the month. Above normal temperatures are also favored for the North Slope and South Coast of Alaska, the eastern Mainland, and Southeast Alaska, similar to the mid-month outlook. This tilt toward milder than normal conditions is consistent with CFSv2 guidance across southern Alaska, as well as above normal sea surface temperatures (SSTs) and below normal sea ice extent adjacent to the North Slope of Alaska. However, persistent cyclonic flow is anticipated across much of the state, which may promote bouts of colder than normal conditions, particularly across the western Mainland, where a slight tilt toward below normal temperatures is indicated. Equal Chances (EC) is indicated across the western CONUS, where cooler than normal conditions anticipated early in the month may give way to a moderation by mid-month.
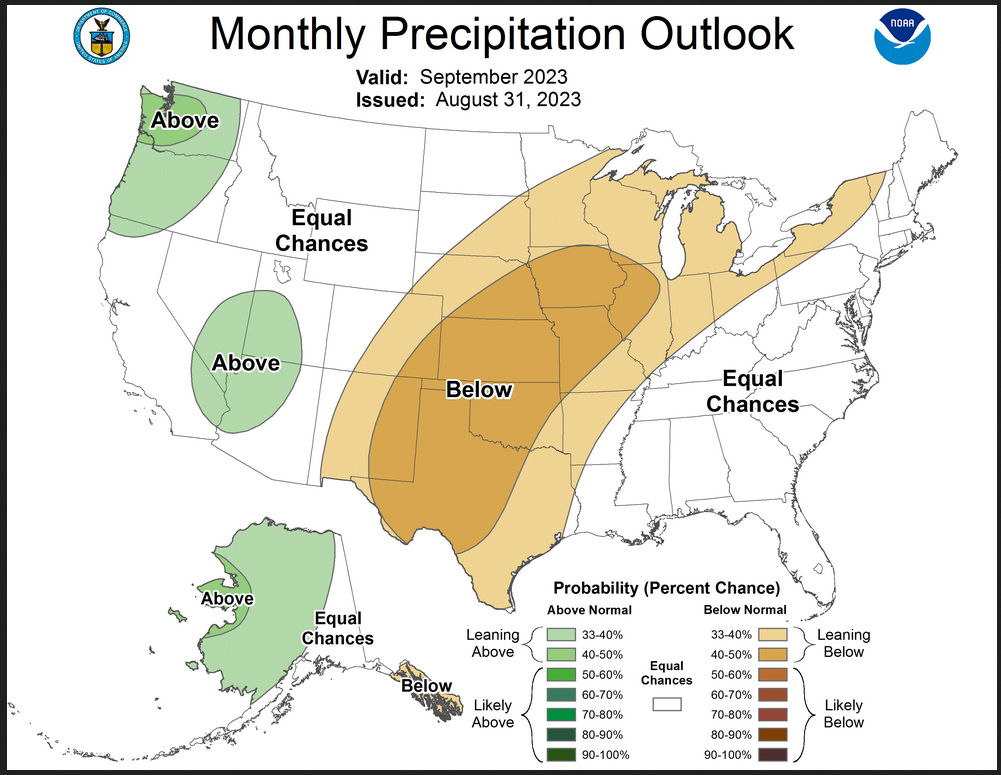
Precipitation
The updated September precipitation outlook favors below normal precipitation across most of the Plains, Upper and Middle Mississippi Valley, and Great Lakes due to anticipated persistent anomalous ridging across these regions. Conversely, chances of above normal precipitation are elevated across most of Mainland Alaska due to the potential for troughing near western parts of the state for much of the month. However, a tilt toward below normal precipitation is indicated across Southeast Alaska, consistent with CFSv2 guidance. Farther to the south, above normal precipitation is favored across the Pacific Northwest. This wet signal is consistent with the latest CPC 6-10 and 8-14 day outlooks as well as with natural analog composites, which favor anomalous troughing off the coast. Above normal precipitation is also favored for parts of the Southwest, as moist monsoonal flow is anticipated during the first couple of days of the month. However, the magnitudes of these enhanced above normal precipitation probabilities are very modest, as a drying trend is favored across the Southwest thereafter. Farther to the east, EC is indicated for the Southeast and along the Eastern Seaboard due to weak or conflicting signals from dynamical and statistical guidance. Moisture associated with Idalia is anticipated to time off across the Southeast prior to the start of the month, and a drying trend is anticipated across the region in its wake. Therefore, the tilt toward above normal precipitation that had been indicated in the mid-month outlook has been removed in favor of EC in this updated outlook.
Drought Outlook
Here is the newly issued Drought Outlook for next month.
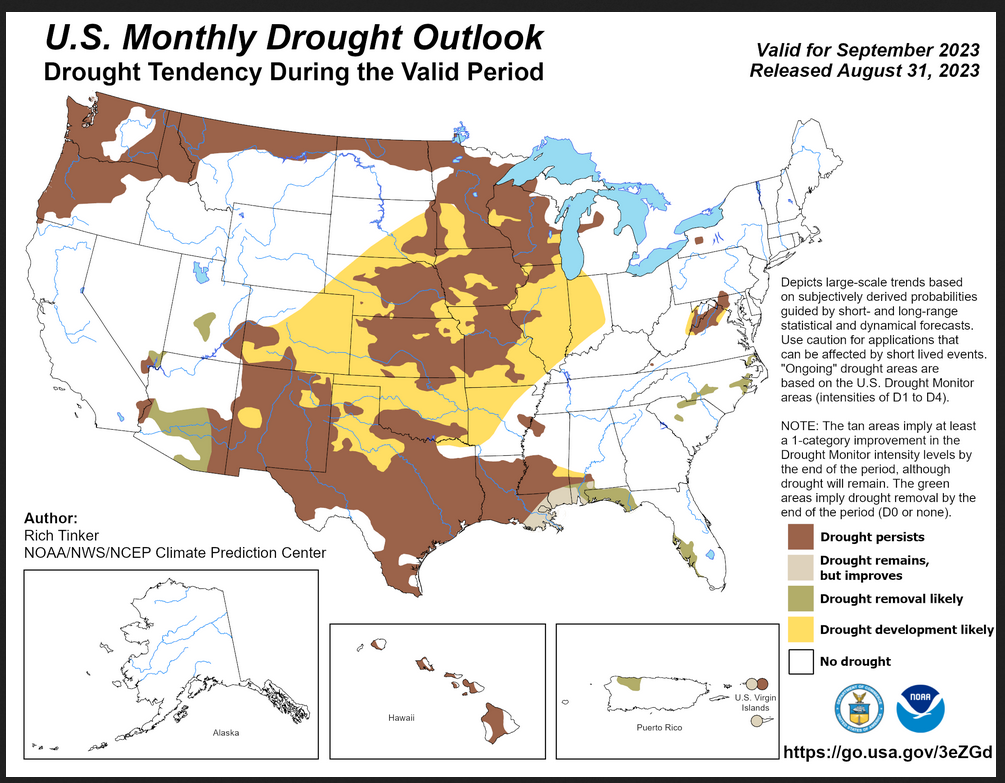
| You can see where drought development or reduction is likely. Overall the forecast is for the intensification of drought conditions. The summary and detailed discussions that accompany this graphic can be accessed HERE, but the short version is shown below. |
Here is the short version of the drought summary
Latest Monthly Assessment – Overall, drought expanded and intensified along much of the southern tier of states over the past 4 weeks, with less dramatic deterioration observed in the Upper Midwest and along the northern tier of states from parts of the Great Lakes region westward to the Pacific Coast. Areas from the central Gulf Coast region westward through the southern Plains in particular saw conditions worsen the most, with 2 to 3 class deteriorations noted over much of the region from eastern Texas eastward across Louisiana and the southernmost reaches of Mississippi and Alabama. On August 8, less than 3 percent of Louisiana was covered by extreme to exceptional drought (D3 or D4). On August 29, that number had risen to over 73 percent. Dry weather there was accompanied by excessive heat for much of the month, which exacerbated the rate of drought intensification. For more than a week, heat indexes topped 120 deg. F were reported at scattered locations each day. In addition, drought expanded in Hawaii over the last four weeks. Less than 7 percent of Hawaii was in drought at the start of August, but drought covered almost 61 percent of the state as the month ended.In contrast, drought generally improved in the middle of the Lower 48, particularly in the central Plains and Middle Mississippi Valley, and drought also eased in parts of the East and in the Desert Southwest. Hurricane Hilary rapidly moved through the Southwest in early August, dropping unprecedented amounts of rain for what is normally a dry month in the region. Almost 3 inches of rain fell on downtown Los Angeles during one day. During all Augusts combined for the prior 146 years, only 6.71 inches fell there.During September, a plume of moisture early in the month is expected to trigger areas of heavy rainfall, bringing some additional drought relief to part of the Southwest. Improvement is also expected in the Southeast from a combination of rains from Hurricane Idalia and disorganized tropical thunderstorm activity farther west toward the Louisiana Bayou. Odds also slightly favor improvement in drought areas of Puerto Rico and the western Virgin Islands.In contrast, drought persistence or intensification is forecast for a vast majority of the drought areas affecting the Lower 48 and Hawaii. Hot and dry weather in the middle of the Lower 48 is expected to bring a broad expansion of drought conditions by the end of the month, with some degree of drought anticipated to cover a large swath from the southern Plains and lower Mississippi Valley northward into the Upper Mississippi Valley and adjacent portions of the northern Great Plains and Great Lakes. Above-normal September precipitation is favored in parts of the Northwest, but this is a climatologically dry time of year there, with only 2 to 5 percent of the annual precipitation typically observed in September. As a result, precipitation totals are expected to be too low to bring any significant drought relief. Drought persistence is also forecast across the eastern Virgin Islands and Hawaii. Some degree of dryness now covers all of the 50th state, and at least a little drought expansion is expected there in some parts of the state, although no specific area seems particularly at risk.
We also have an updated Seasonal Drought Outlook (link).
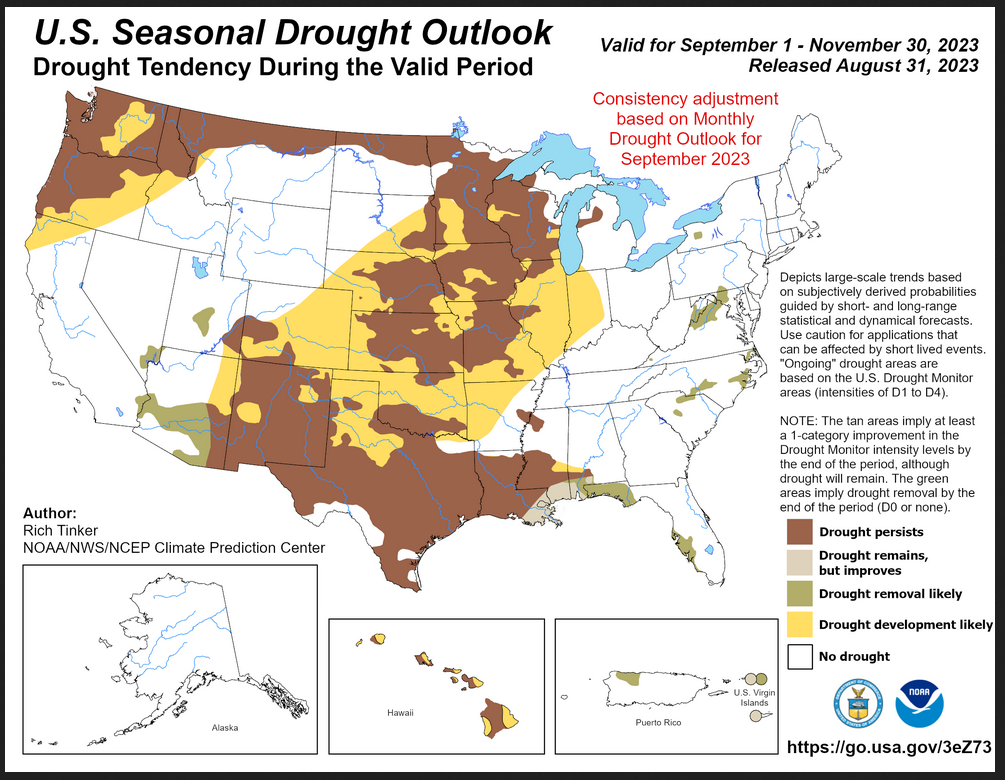
| It is not that much different than the single-month outlook but it covers a longer period of time. It does not seem to be consistent with a strong El Nino. |
| To update this forecast (which updates on Tuesdays) click HERE |
Month-to-date Temperature as the current month evolves can be found at https://hprcc.unl.edu/products/maps/acis/MonthTDeptUS.png
Month-to-date Precipitation as the current month evolves can be found at https://hprcc.unl.edu/products/maps/acis/MonthPNormUS.png
CLIMAS Podcast
No Podcast this Month
Water-year-to-date precipitation. Here is the LINK
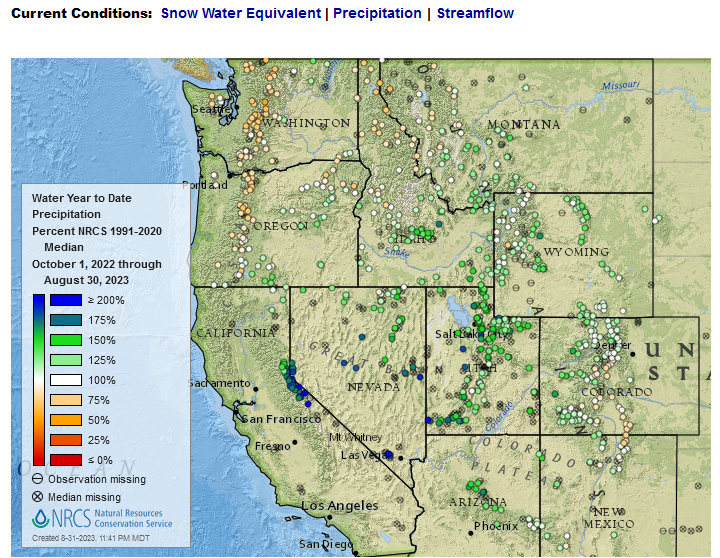
| This provides a very clear picture of the weather pattern since October 1, 2022. It has been a wet year but also a very warm year so we see drought expanding. |
Fire Outlook (The Site has Moved and I have not figured out how to print images from the new site yet. The link is HERE.
| I hope you found this article interesting and useful |