Here is what we are paying attention to in the next 48 to 72 hours. The article also includes weather maps for longer-term outlooks and a five-day World weather outlook.
We start with the U.S. Information. You can update this section here but these are 48 to 72-hour forecasts so if I have not been able to update this area twice daily, what is shown is still valid and the images in the body of the article update automatically but sometimes they are a bit slow to update.
Short Range Forecast Discussion
NWS Weather Prediction Center College Park MD
Thu Aug 17 2023
Valid 12Z Thu Aug 17 2023 – 12Z Sat Aug 19 2023…Hot/record temperatures to shift focus out of the Northwest and into
the central U.S.; Critical Risk of Fire Weather in the Northwest……Showers, thunderstorms, and an increasing risk of flash flooding for
the Southwest...…Scattered shower and thunderstorm chances continue along the East
Coast…
![]()
| Notices: Recently we published the ENSO Alert Update and you can access that article HERE. |
First, the 48-Hour Forecast (It is a 48 to 72 Hour Forecast actually)
Daily weather maps. The Day 1 map updates twice a day and the Day 2 and 3 maps update only once a day. These maps update automatically. But if that does not happen, you can get updates by clicking HERE
TODAY (or late in the day the evening/overnight map will appear)
TOMORROW
NEXT DAY
This animation shows how things may play out over the next 60 hours. To update click here.
The NWS Climate Prediction Center’s: Watches, Warnings, and Advisories plus other information can be found HERE. We post at least one of those updates daily, sometimes both. The Highlights are shown in the lede paragraph of this article.
ATMOSPHERIC RIVERS
This tells us what is approaching the West Coast. Click HERE to update If I have not gotten around to doing the update. Here is some useful information about Atmospheric Rivers.
Continuation of the NWS Short Range Forecast. It is updated by NWS twice a day and these updates can be found here
An upper-level ridge shifting from the Northwest eastward over the central
U.S. will continue to be the driver of an expansive heatwave. One more day
of oppressively hot temperatures are forecast for the interior Northwest
and portions of the Northern Rockies/adjacent High Plains Thursday. Highs
will generally be in the upper 90s to low 100s, near record-tying/breaking
levels for portions of the Northern Rockies. In addition, low relative
humidity and some gusty winds on top of the hot temperatures has resulted
in a Critical Risk of Fire Weather from the Storm Prediction Center for
portions of eastern Washington and northwest Montana Thursday and Friday.
A Pacific system/cold front pushing southeast across the region late
Thursday and into the day Friday will bring an end to the more dangerous
heat for this region, with highs remaining hot but returning to more
reasonable, summer-time temperatures generally in the low 90s. As the
ridge shifts east, temperatures will begin to soar into the upper 90s to
low 100s over western portions of the Northern/Central Plains on Friday.
This eastward shift in the ridge will also bring temperatures back up into
the mid- to upper 100s in Texas and low 100s for the Lower Mississippi
Valley, near record-tying/breaking levels, after a brief reprieve for many
the past couple of days. The ridge unfortunately looks to settle in and
lead to a long-duration heatwave over the central U.S. into next week.
Please see WPC’s Heat Key Messages for more information on this expansive
heat wave.An upper-level closed low lingering over the California coast will
continue to provide support aloft for daily shower and thunderstorm
chances over portions of the Southwest/Great Basin. Anomalously high
moisture in the region will lead to locally heavy downpours with the risk
for some isolated flash flooding, particularly for more sensitive
locations such as urban areas, burn scars, dry washes, and slot canyons.
Enhanced lift aloft and higher instability will result in a locally higher
risk of a few scattered instances of flash flooding over portions of
southwest Utah and northwest Arizona on Friday, with a Slight Risk of
Excessive Rainfall (level 2/4) in place. Confidence has increased in
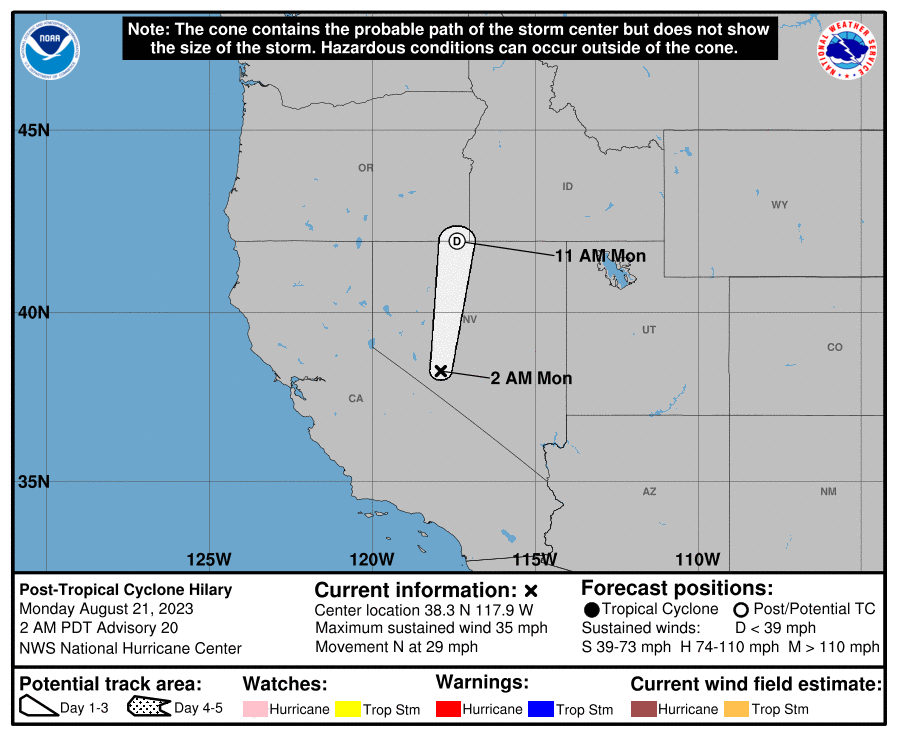
significant heavy rainfall/flooding impacts from increasing moisture
streaming into southern California and the Southwest from Hilary in the
eastern Pacific, but this will likely begin just beyond the current
forecast period during the day Saturday. High temperatures broadly across
the southern tier of the West will range from the 70s along coastal
California, 80s in the Four Corners region, and low to mid-90s for the
Central/Southern Rockies and Great Basin. Heat-related advisories/warnings
are in effect Thursday for the central California Valleys for highs in the
mid 100s and the Desert Southwest for highs into the 110s before a return
to more typical summertime temperatures Friday.Elsewhere, a frontal system passing through the Great Lakes will continue
to bring a chance for showers and thunderstorms through early Thursday
before shifting into the interior Northeast by Thursday afternoon and New
England by Friday. Some locally heavy downpours/isolated flash flooding
and an instance or two of gusty winds will be possible. Cooler
temperatures will follow behind the front, with highs in the 70s to low
80s for much of the Midwest/Northeast. Over the Southeast, a lingering
frontal boundary will provide the focus for mainly afternoon showers and
storms. Highs will be near average from the southern Mid-Atlantic through
the Southeast and into Florida, with upper 80s to low 90s expected.
Learn about wave patterns HERE.
Below is the current five-day cumulative forecast of precipitation (Updates can be found HERE)
Now we look at Intermediate-Term “Outlook” maps for three time periods. Days 6 – 10, Days 8 – 14, and Weeks 3 and 4. An outlook differs from a forecast based on how NOAA uses these terms in that an “outlook” presents information as deviation from normal and the likelihood of these deviations.
Below are the links to obtain updates and additional information. They are particularly useful if you happen to be reading this article significantly later than when it was published. I always try to provide readers with the source of the information in my articles.
| Days 6 – 10 (shown in Row 1) | Days 8 – 14 (Shown in Row 2) | Weeks 3 and 4 (Shown in Row 3 but updates only on Fridays) |
| https://www.cpc.ncep.noaa. gov/products/predictions/610day/ | https://www.cpc.ncep .noaa.gov/products/predictions/814day/ | https://www.cpc.ncep.noaa.gov/products/predictions/WK34/ |
Showing the actual maps. They should now update automatically. The Week 3 – 4 Outlook only updates on Fridays. So below is what I call the Intermediate-term outlook. On Fridays, it extends out 28 Days. That declines day by day so on Thursday it only looks out 22 days until the next day when the Week 3 – 4 Outlook is updated and this extends the outlook by one additional week.
| 6–
10
|
|
|
| 8–
14 |
|
|
| 3–
4 |
|
|
HAZARDS OUTLOOKS
Click here for the latest complete Day 3 -7 Hazards forecast which updates only on weekdays. Once a week probably Monday or Tuesday I will update the images. I provided the link for readers to get daily updates on weekdays. Use your own judgment to decide if you need to update these images. I update almost all the images Friday Night for the weekend edition of this Weather Report. So normally readers do not need to update these images but if the weather is changing quickly you may want to.
Temperature month to date can be found at https://hprcc.unl.edu/products/maps/acis/MonthTDeptUS.png
Precipitation month to date can be found at https://hprcc.unl.edu/products/maps/acis /MonthPNormUS.png
World Forecast
Below are the Day 1 -3 and 4-6 forecasts for temperature and precipitation. Updates and much additional information can be obtained HERE
World Temperature Anomalies
World Accumulated Precipitation
This information is provided by the University of Maine. They draw upon many different sources. There is a lot of information available at the link provided. I have just provided two useful forecasts. There are probably over a hundred different forecasts available from this source.
Worldwide Tropical Forecast (This is a NOAA Product)
This graphic updates on Tuesdays) If it has not been updated, you can get the update by clicking here Readers will only have to do that if they are reading this article much later than the date of it being published.
Information on Tropical Storms can be found HERE. Western Pacific information can be found HERE.
–
| I hope you found this article interesting and useful. |
–