This article is based primarily on the July 18, 2023, USDA Crop Bulletin which covers the July 10 to 16 period of time while some meteorological data covers July 9 to 15 since the crop reports may really cover that period of time in practice. The USDA report usually becomes available on Tuesdays and I was not able to publish the report from last week. This week’s report drops some of the graphics I usually present and shows some other graphics that relate to a review of June. I do not think that my readership is that interested in a review of the growing conditions Worldwide in June so I am not presenting that information but it is available in the full USDA Crop Bulletin and the link to that is at the end of the article. I will probably do a review of June weather for the U.S. in a separate article later this week.
It now seems more like an average crop but it has not gotten worse which is a relief and it seems that some of the crops are doing better. Both corn and soybeans had a very good start but the quality of the crop has been somewhat compromised by drought. Soybeans are doing a bit better than corn. The condition report seems to be a bit better for both crops. The weather outlooks are mostly favorable for most crops.
There is a recent Executive Briefing that would shed a lot more light on the situation. It is a bear to publish but I will see if I can provide the information for some of the key crops over the next two weeks.
I did not include a NASS report this week I vary these reports to give readers information on different crops. Nothing appealed to me this week.
The article includes a short international review of agricultural conditions.
![]()
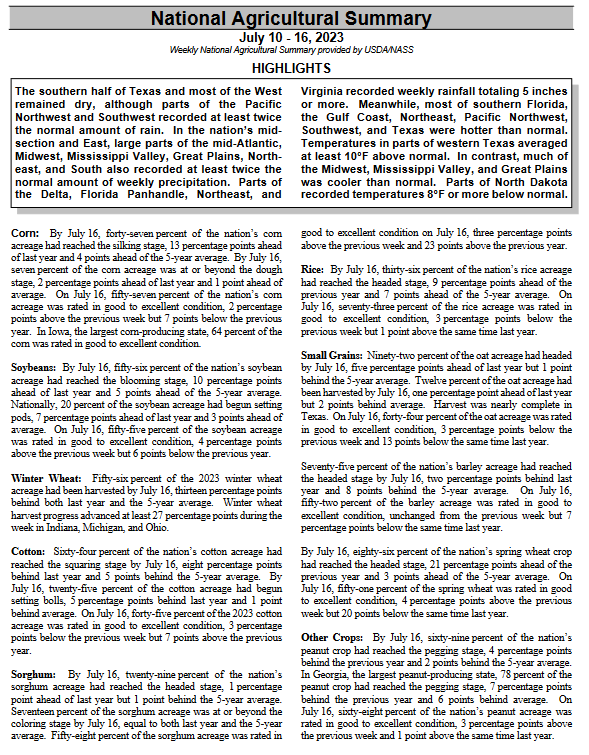
We begin with the National Agriculture Summary. The Tables below the summary have additional data. The boxes with my comments may be incomplete so for crops of interest check the data out yourself to be sure.
| Below is pretty much the same information in table format. However, there is additional information in these tables. |
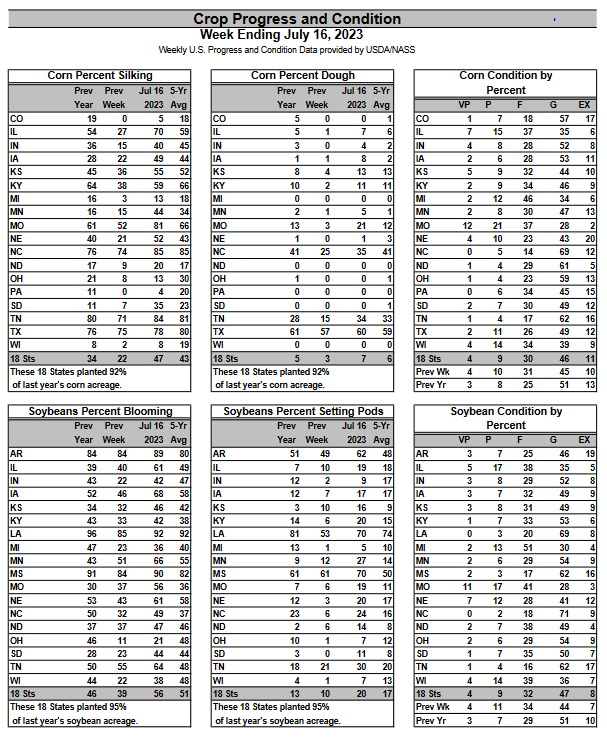
| The condition of corn and soybeans seems to be slowly increasing which is good news. |
Let us take a look at the weather forecasts.
| 6
– 10
|
|
|
| 8
– 14 |
|
|
| 3
– 4 |
|
|
| You can track the situation daily by accessing our Daily Weather forecast which you can access HERE. But the weather outlook maps in this article also update. |
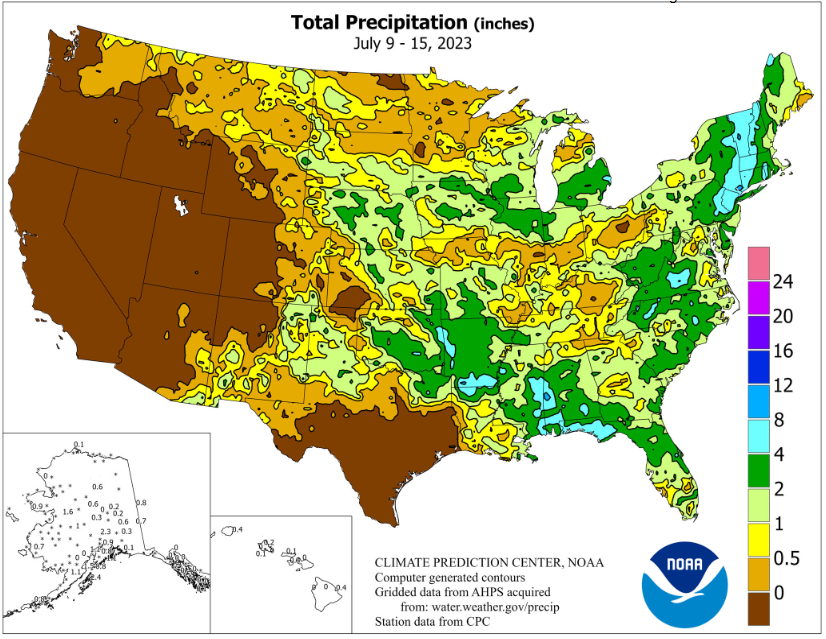
Looking at the month-to-date precipitation

| We see that the first eighteen days of July were mixed in the corn and soybean belts. |

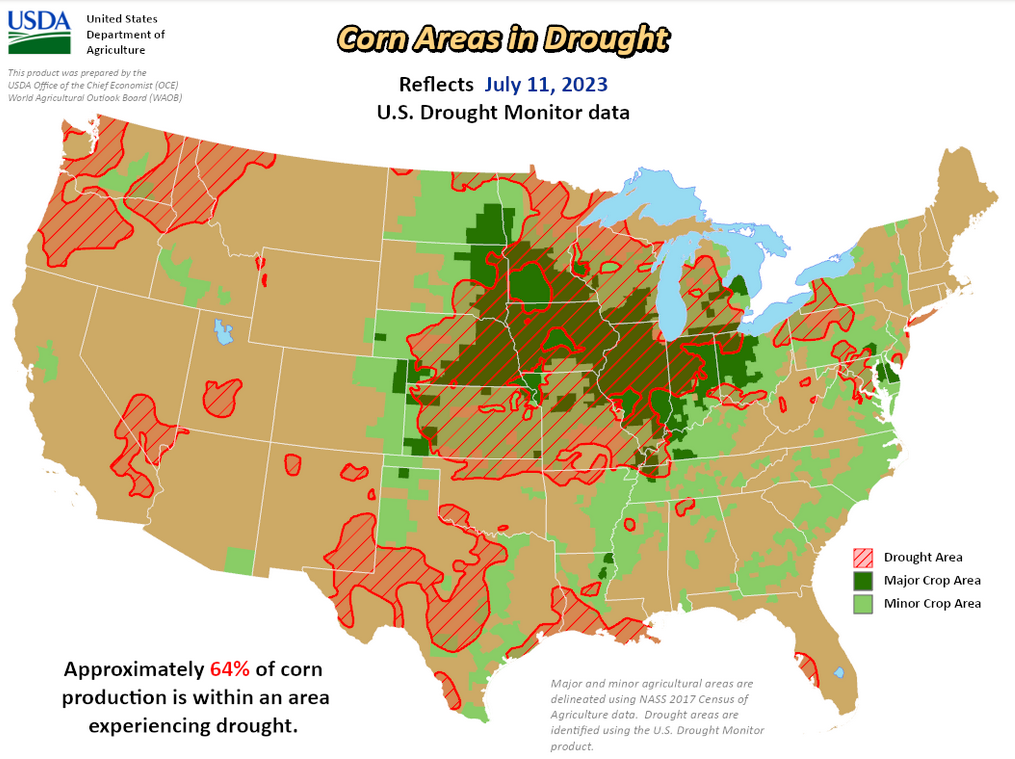
| The drought Monitor covers a Thursday to Wednesday period so it does not line up perfectly with the crop report but it is close. |
Here is another view that helps explain the situation. Similar maps for other crops can be found HERE
 |
|
|
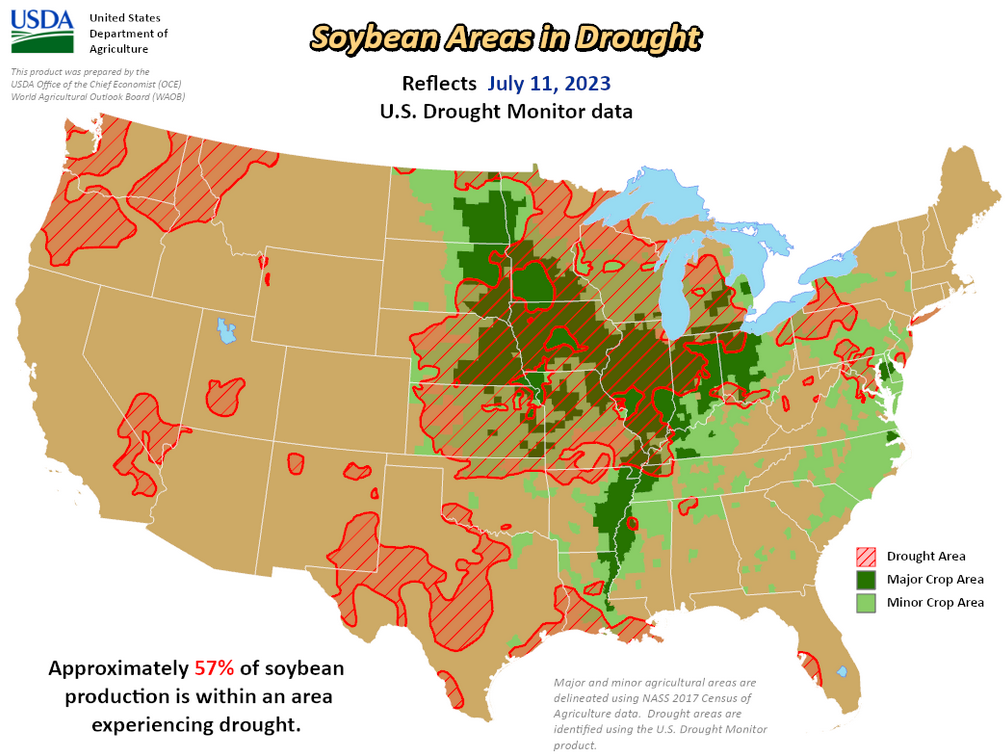
| Corn and to a slightly less extent soybeans have been negatively by drought but it seems to be improving. Notice the growing areas are fairly similar. What is key to remember is that corn is more profitable than soybeans but soybeans are less vulnerable to early Fall frosts. So a farmer can start with corn and if that fails switch over to soybeans. |
Looking at other crops.
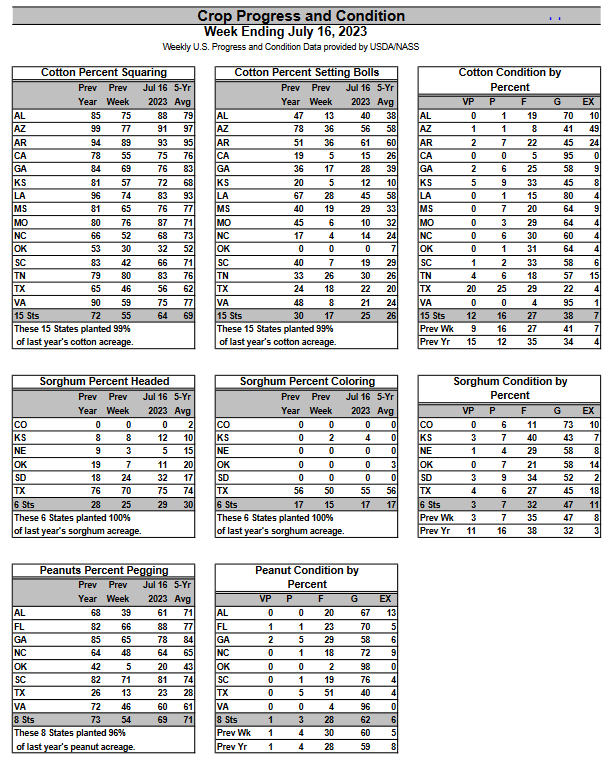
| Cotton is a little slow but the condition is good. Sorghum is on schedule in good condition. Peanuts are fine. |
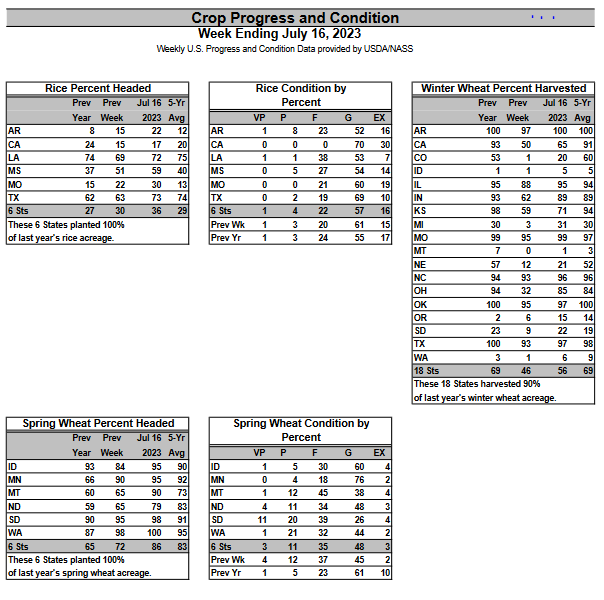
| Rice is looking good now. Spring Wheat has a quality problem. |
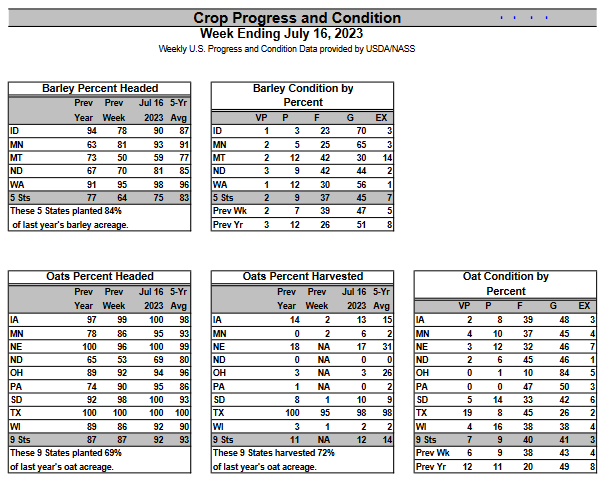
| Barley is slow and the condition was better last year. Oats are somewhat similar. |
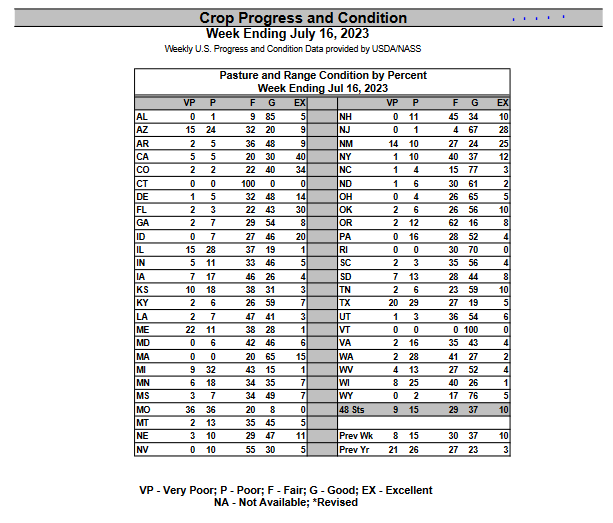
| The pastures are a lot better than last year. |
Some additional detail is provided HEREIt is mostly some additional weeks of data and it is all in larger print. |
Here is some harvest information as of July 1
| The difference between this information and what is in the progress reports is that the progress reports report percentage versus last week, last year, and the five-year average, and the above is the tons produced at the end of the harvest season. |
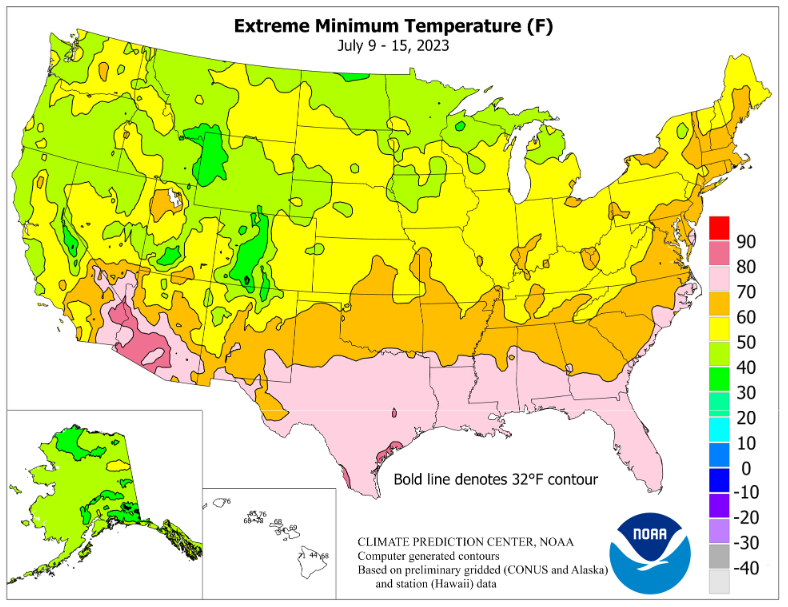
Weather Conditions Reported During the Week
| You can see the pattern here. |
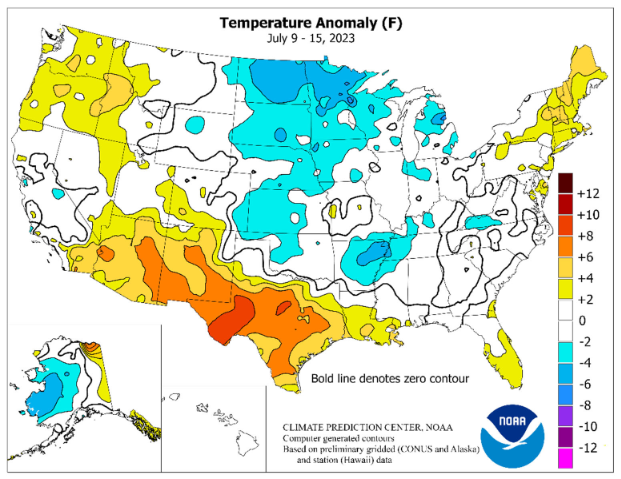
| It is pretty much the entire Southern Tier that has a problem with the heat. |
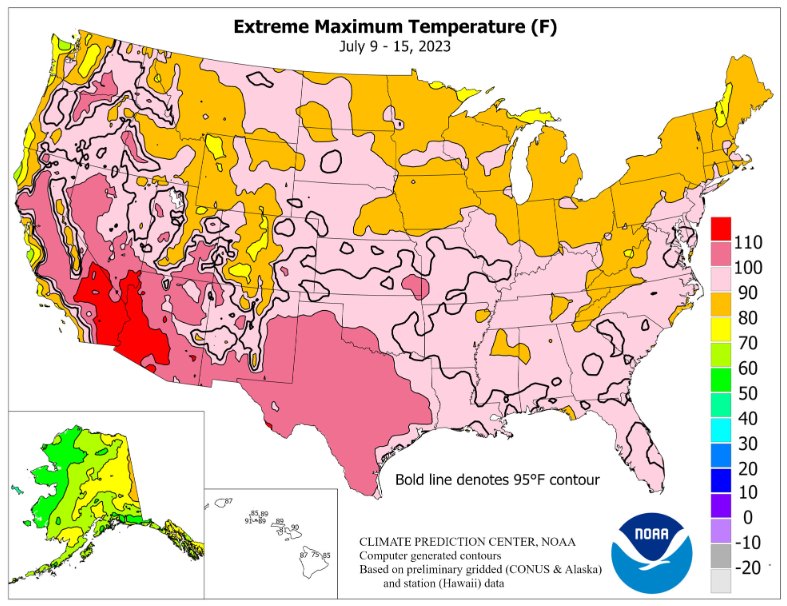
| The high temperatures of the day were a problem where it is red or pink. That is a lot of area. |
| Not a problem right now. |
International
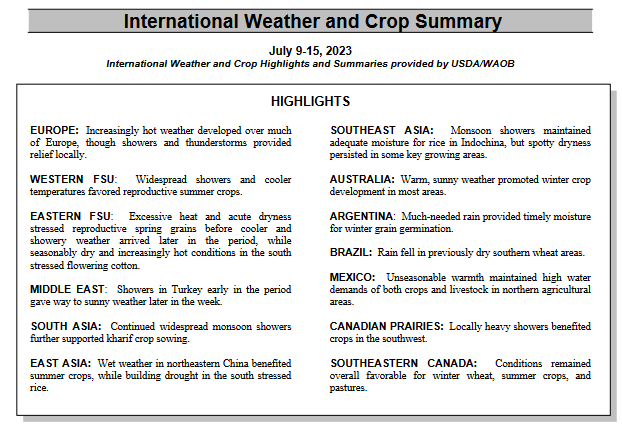
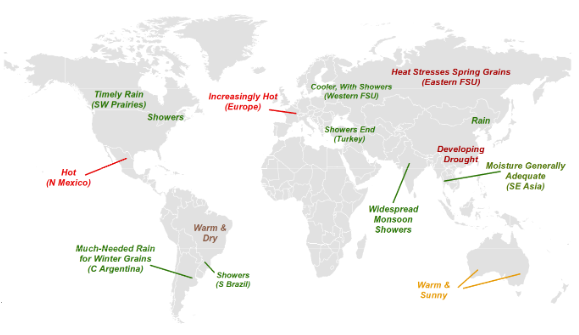
| And here is the map which was provided this week. |
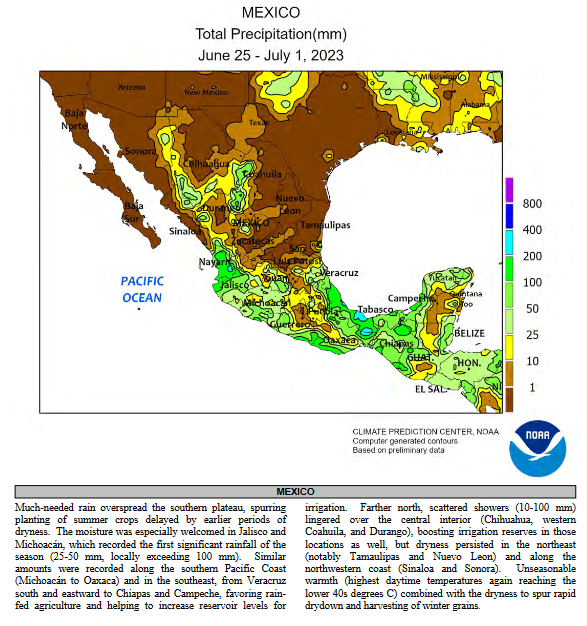
| I am showing Mexico because it informs us of the progress of the Sonoran Monsoon which seems to have retreated which is not good. |
Sources of Information
Weekly Updates can be found HERE
and perhaps more directly HERE
Additional Useful Sources of Information
WASDE: World Agricultural Supply and Demand Estimates HERE
NASS Report Schedule HERE
Executive Briefings HERE
Economics and Prices HERE
Office of the Chief Economist HERE.
Drought information by crop HERE
–
| I hope you found this article interesting and useful. |