Now Final. Sorry for the delay. It was 90% complete when published last night but I wanted to take the time to adjust the commentary and swap out two graphics.
This article is based primarily on the July 5, 2023, 2023, USDA Crop Bulletin which covers the June 25 to July 2 period of time. The USDA report usually becomes available on Tuesdays but due to the Fourth of July Holiday, it was published on Wednesday. For some reason, I forgot to publish my article Wednesday night and I remembered to do that on Friday
It now seems more like an average crop but it has not gotten worse which is a relief. Both corn and soybeans had a very good start but the quality of the crop has been somewhat compromised by drought. Soybeans are doing a bit better than corn. The condition report was about the same this week which is good given the weather. The weather outlooks are mostly favorable.
We also include the recent report on peanut prices. I vary these reports to give readers information on different crops.
The article includes a short international review of agricultural conditions.
![]()
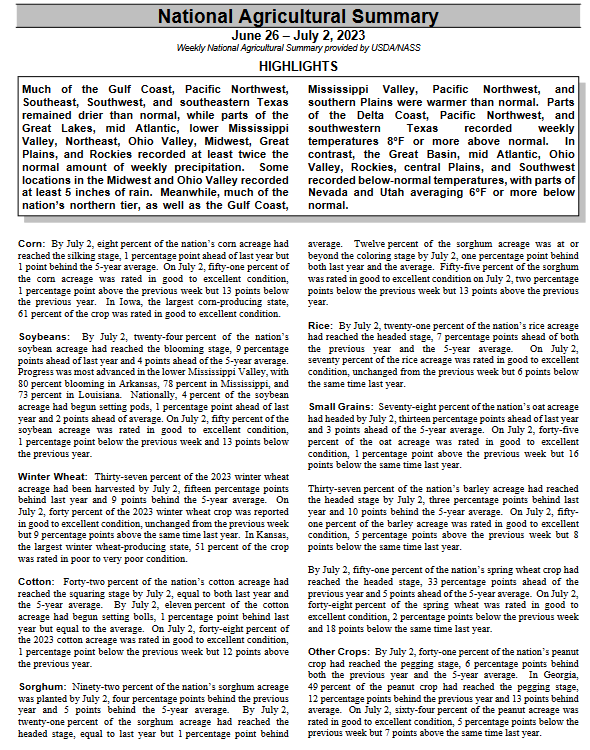
We begin with the National Agriculture Summary. The Tables below the summary have additional data. The boxes with my comments may be incomplete so for crops of interest check the data out yourself to be sure.
| Below is pretty much the same information in table format. However, there is additional information in these tables. |
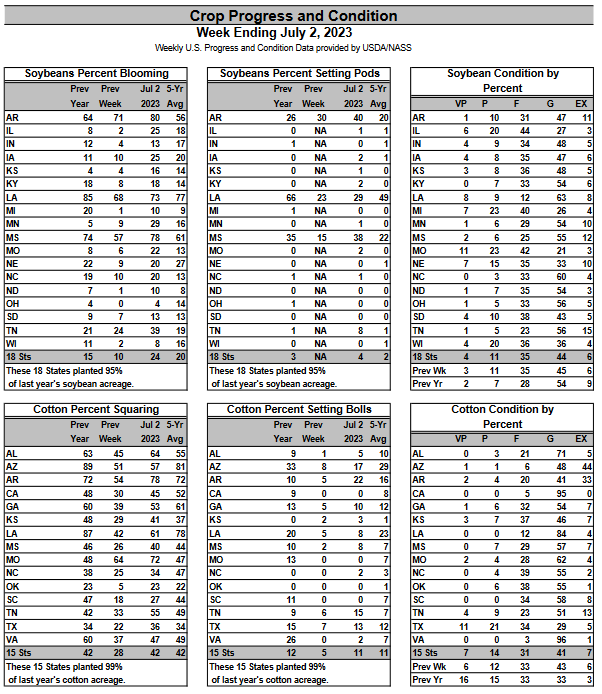
| Soybeans maintain the prior level of condition. Cotton is overall slightly good |
Let us take a look at the weather forecasts.
| 6
– 10
|
|
|
| 8
– 14 |
|
|
| 3
– 4 |
|
|
| You can track the situation daily by accessing our Daily Weather forecast which you can access HERE. But the weather outlook maps in this article also update. |
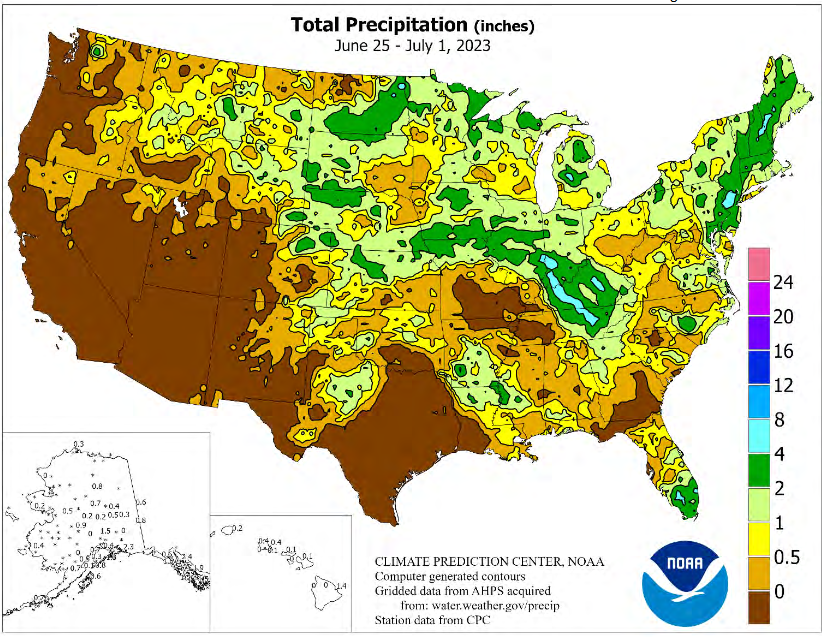
Looking at the month-to-date precipitation

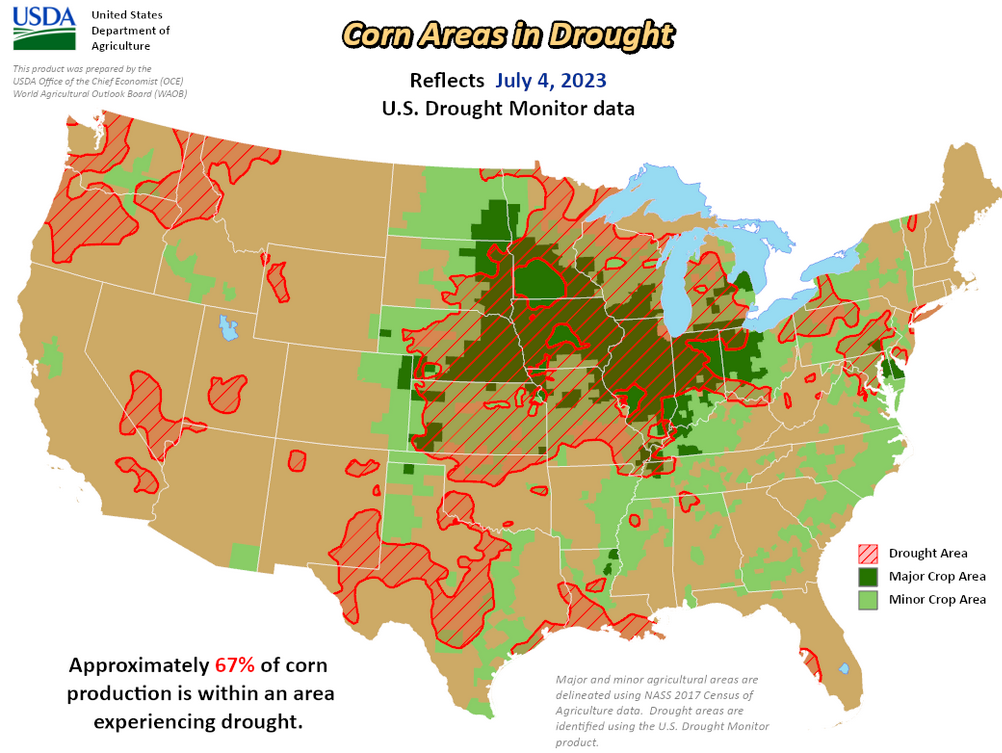
| We see that the first seven days of July were mixed in the corn belt. But drought is not the only issue corn has to deal with as per this LINK. |
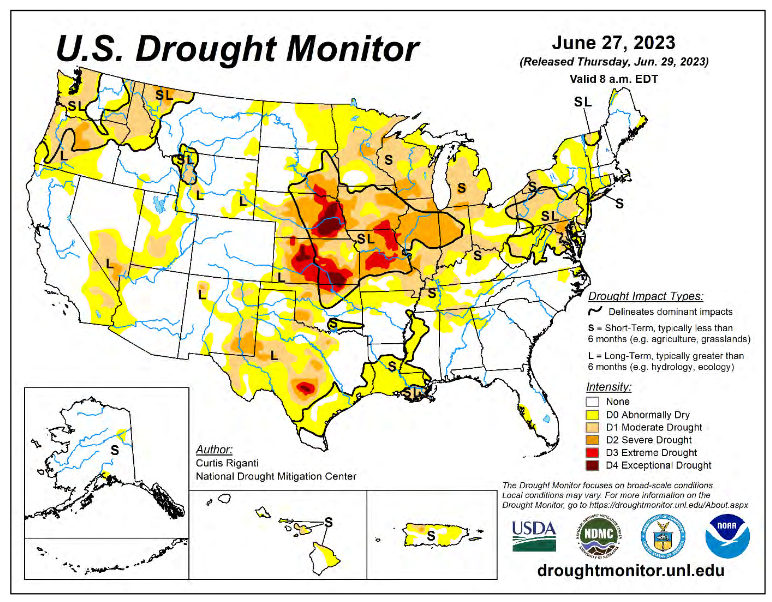
| The drought Monitor covers a Thursday to Wednesday period so it does not line up perfectly with the crop report but it is close.
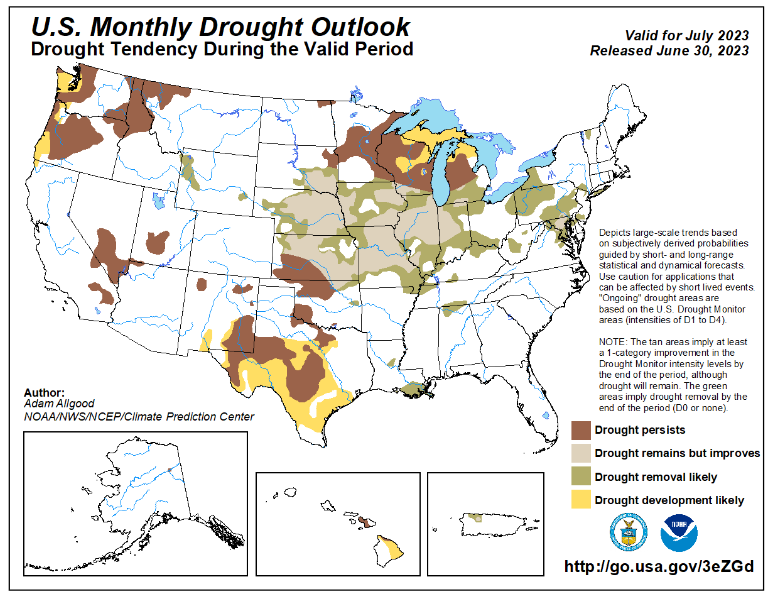
The monthly forecast shows improvement in important areas. Earlier, a number of segmented outlooks are shown some of which update daily so that can be helpful if you have a reason to consider how things may evolve with respect to U.S. crops. |
Here is another view that helps explain the situation. Similar maps for other crops can be found HERE
 |
|
|
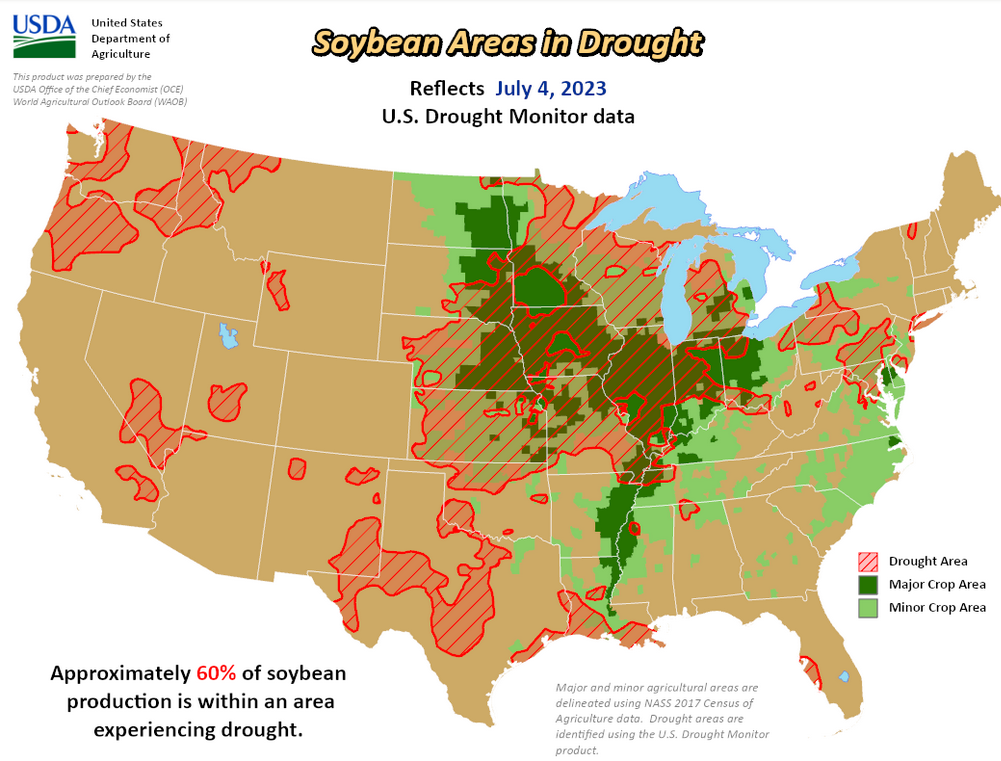
| Corn and to a slightly less extent soybeans are being impacted negatively by drought. Notice the growing areas are fairly similar. What is key to remember is that corn is more profitable than soybeans but soybeans are less vulnerable to early Fall frosts. So a farmer can start with corn and if that fails switch over to soybeans. |
Looking at other crops.
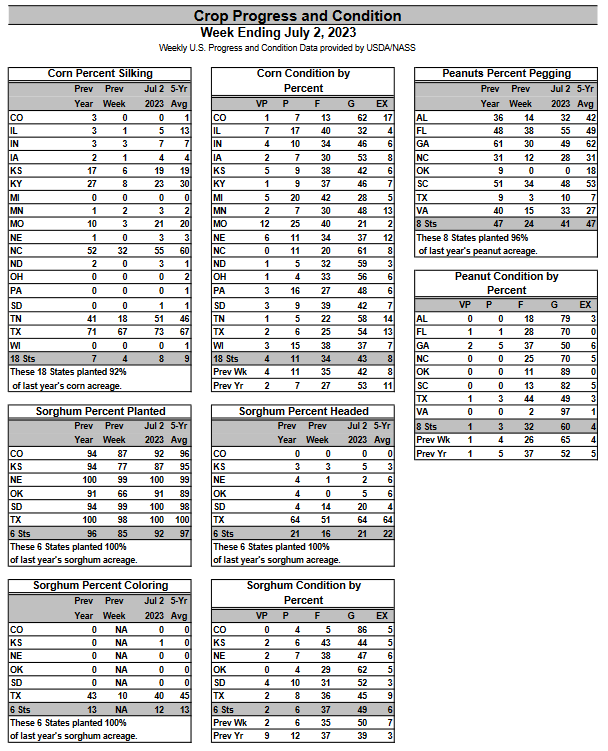
| Corn crop condition slightly improved, average year so far for Sorghum, peanuts slightly slow at getting started. |
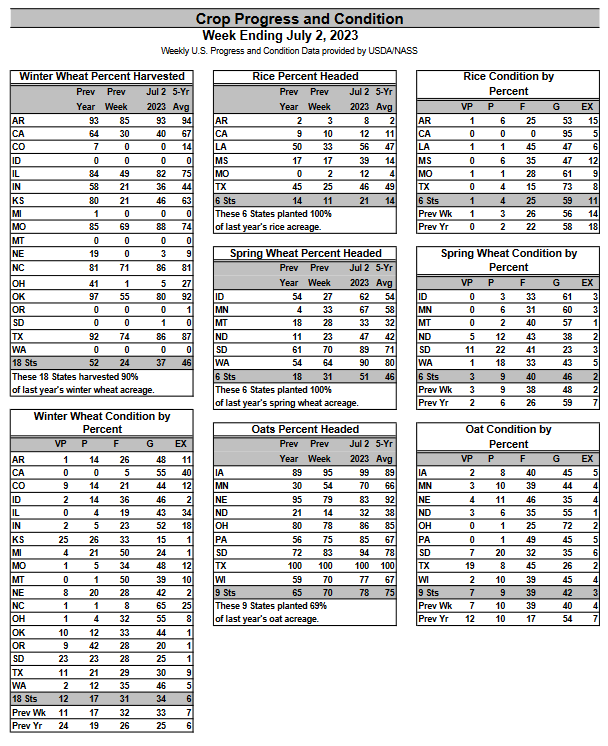
| Winter wheat harvesting is way behind, spring wheat is good, rice is just ok, and oats are good but there is a quality issue. |
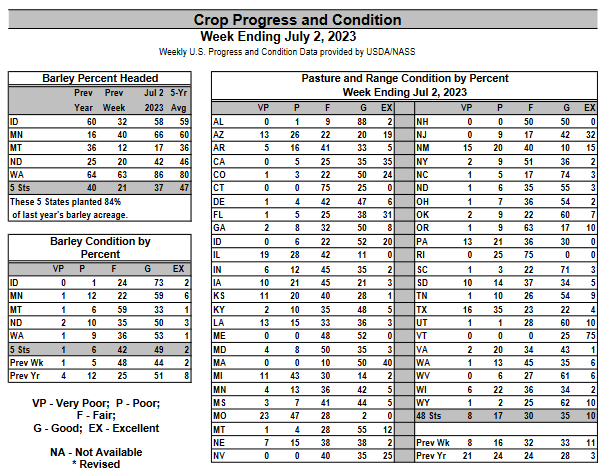
| Barley is a bit slow and the quality is off somewhat. Pasture conditions are quite improved over last year. |
Some additional detail is provided HEREIt is mostly some additional weeks of data and it is all in larger print. |
Weather Conditions Reported During the Week
| You can see the pattern here |
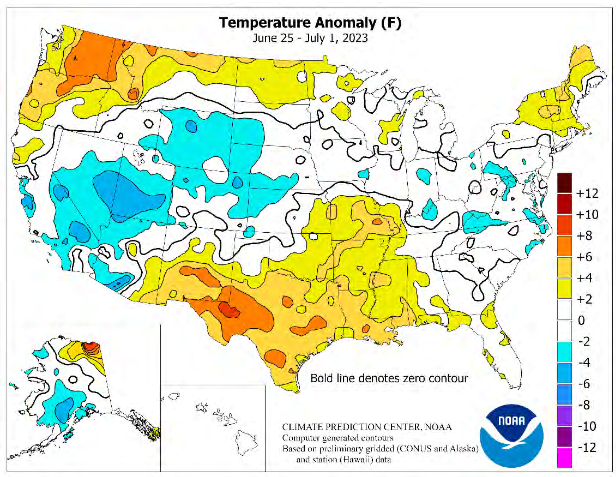
| Texas and neighboring states had problems with the heat. |
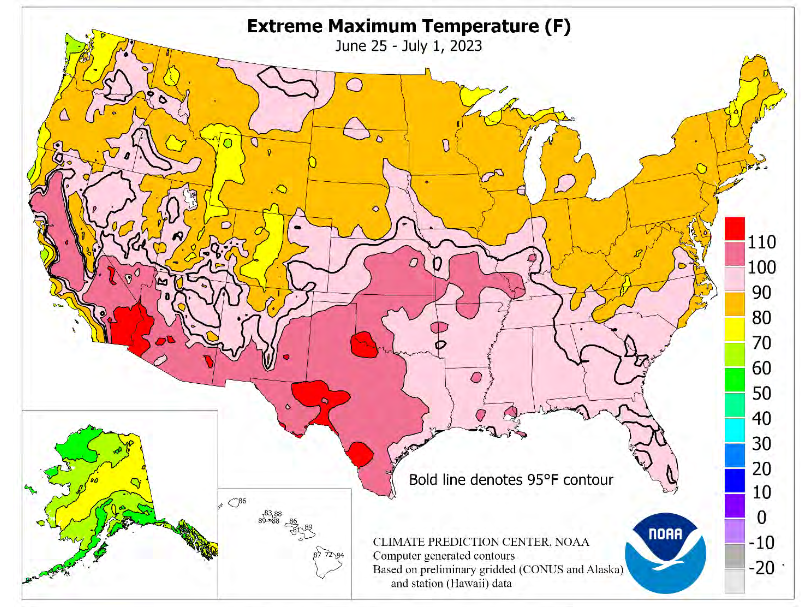
| The high temperatures of the day were a problem where it is red or pink |
Some additional information
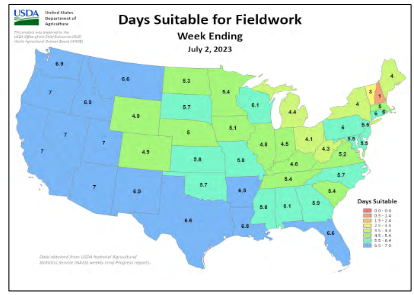
| The yellows and oranges are of interest. They show areas where the number of days suitable for fieldwork was low. There was only one state in those categories this past week. So it was a pretty good week for fieldwork. |
–
| Pan evaporation was not reported this week but refers to the technique (water in a pan) for determining the amount of drying that took place in different areas. Sometimes satellite imagery is used instead of this old-fashioned method but it seems to be preferred in the weekly Crop Bulletin. Very high or low values might be the result of faulty measurement equipment. |
Now the report on Peanut Prices.
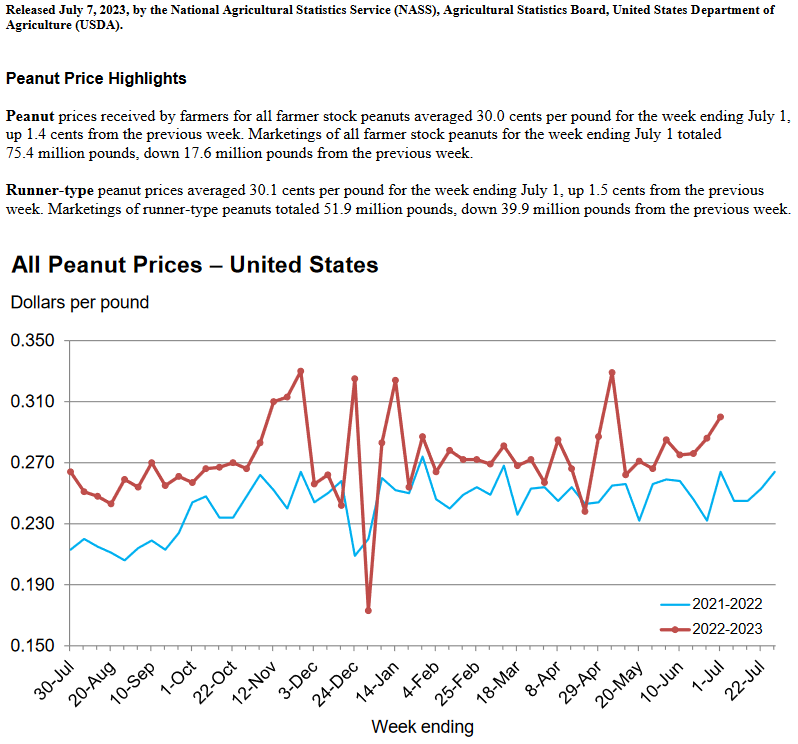
| Peanut prices are up this year. The full report can be accessed HERE. |
International
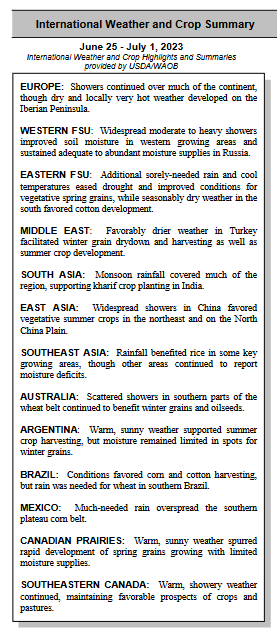
| No map was provided this week. The above shows a pretty good week with Argentina, Brazil and the Canadian Prairies wishing it was somewhat wetter. |
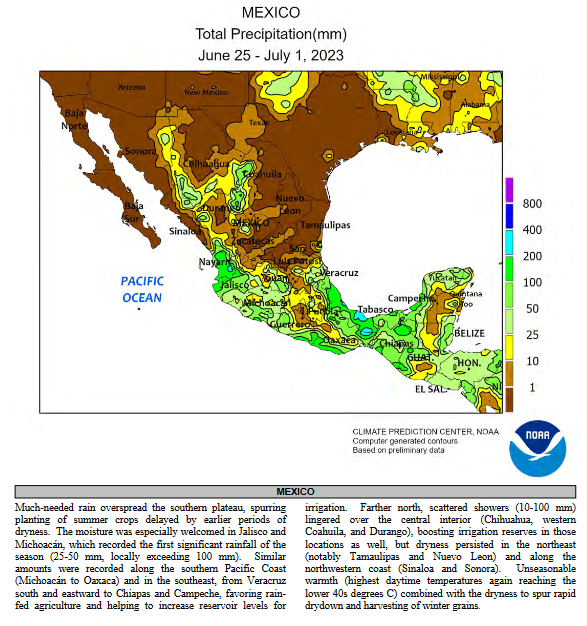
| I am showing Mexico because it informs us of the progress of the Sonoran Monsoon. |
Sources of Information
Weekly Updates can be found HERE
and perhaps more directly HERE
Additional Useful Sources of Information
WASDE: World Agricultural Supply and Demand Estimates HERE
NASS Report Schedule HERE
Executive Briefings HERE
Economics and Prices HERE
Office of the Chief Economist HERE.
Drought information by crop HE RE
–
| I hope you found this article interesting and useful. |