This article is based primarily on the June 21, 2023, USDA Crop Bulletin which covers the June 12 to June 18 period of time. The USDA report usually becomes available on Tuesdays but due to a Federal Holiday, it was issued on Wednesday.
It now seems more like an average crop. Both corn and soybeans had a very good start but the quality of the crop has been somewhat compromised by drought. Soybeans are doing a bit better than corn.
We also include the recent report on potato inventories. I vary these reports to give readers information on different crops.
The article includes a short international review of agricultural conditions.
![]()
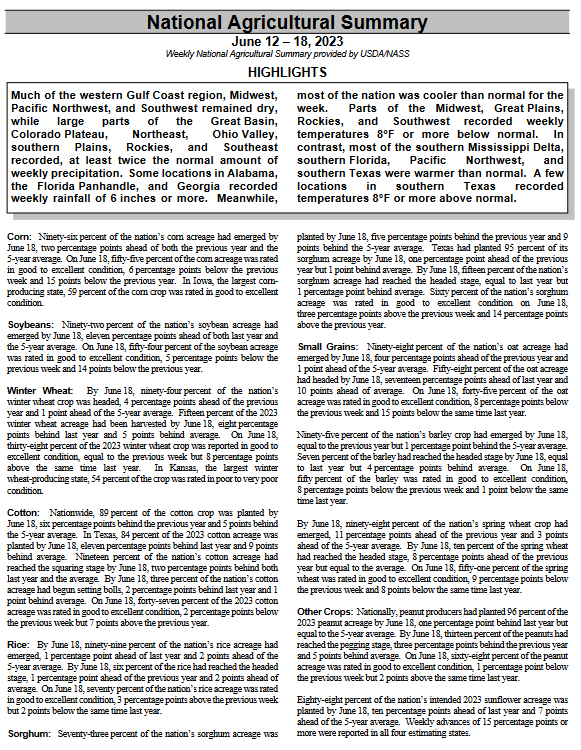
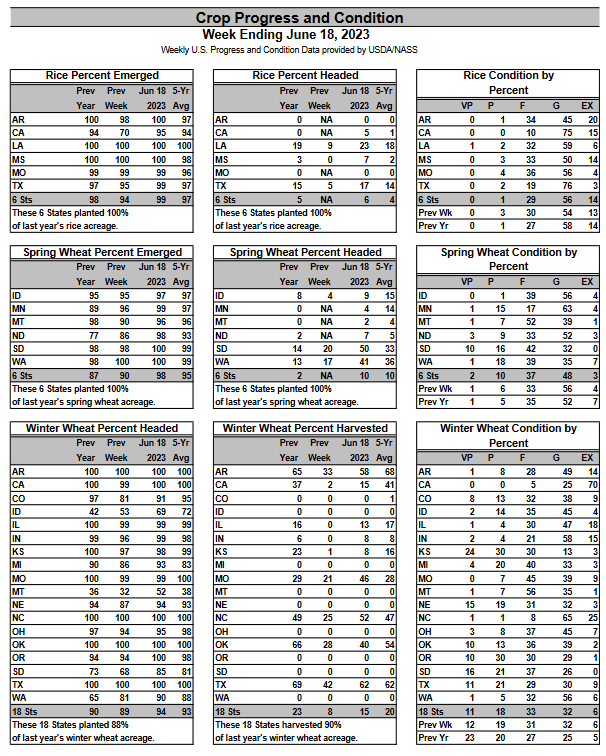
We begin with the National Agriculture Summary. The Tables below the summary have additional data. The boxes with my comments may be incomplete so for crops of interest check the data out yourself to be sure.
| Below is pretty much the same information in table format. However, there is additional information in these tables. |
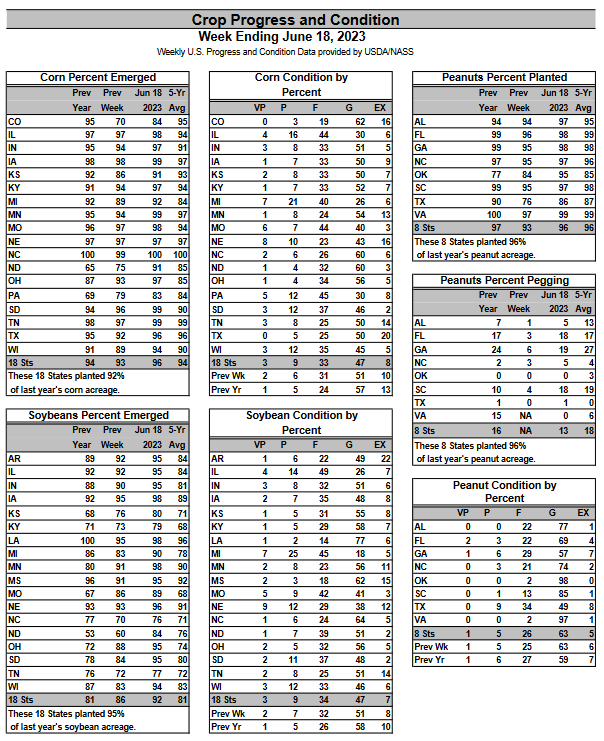
| If getting started well was the criteria, both corn and soybeans would be doing well Soybeans especially got off to a good start. But both corn and soybeans and not doing as well as last year. |
Let us take a look at the weather forecasts.
| 6
– 10
|
|
|
| 8
– 14 |
|
|
| 3
– 4 |
|
|
| There is a large warm area. Where it is warm and dry that is not good. There is one little area up by the Great Lakes predicted to be dry. You can track the situation daily by accessing our Daily Weather forecast which You can access HERE. But the maps in this article also update. |
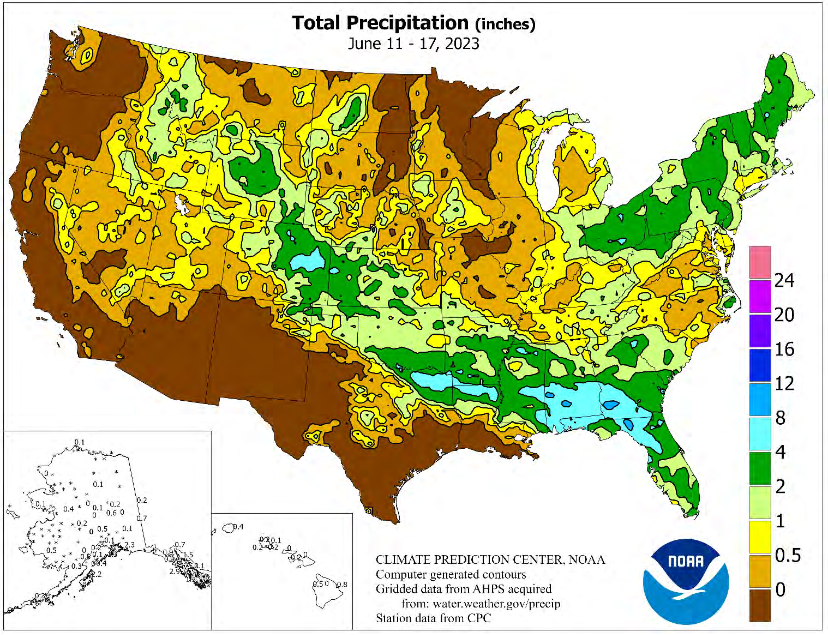
Looking at the month-to-date precipitation

| We see that the first twenty days of June were very dry in the corn belt. But drought is not the only issue corn has to deal with as per this LINK. |
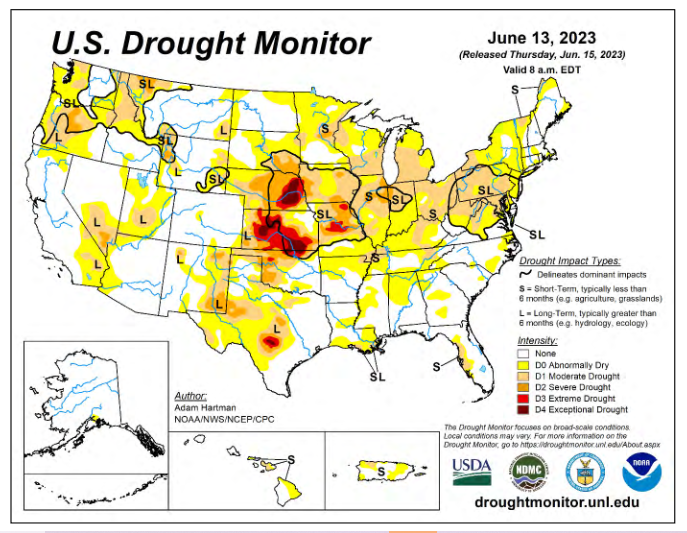
| This shows the drought situation as of June 13, 2023, the beginning of the reporting period. There is not much drought in the U.S. but what there is not favorable for agriculture. It is actually also shown in the two graphics below this one. It is not equally intense in every place. |
Here is another view that helps explain the situation. Similar maps for other crops can be found HERE
 |
|
|

| Corn and to a slightly less extent soybeans are being impacted negatively by drought. |
Looking at other crops.
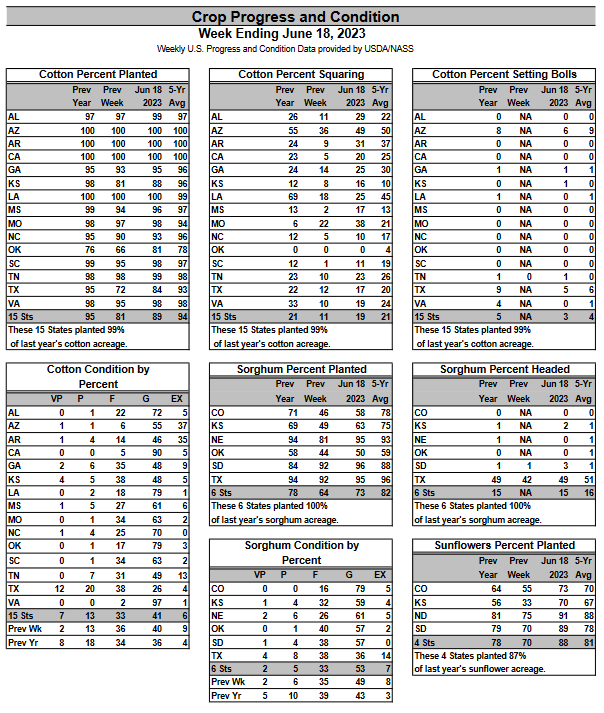
| Sunflowers are doing well but cotton is slow but the condition of the cotton crop is good. Sorghum is also slow but the condition is good. |
| These crops are ok. They generally had a good week. |
| The above looks good. |
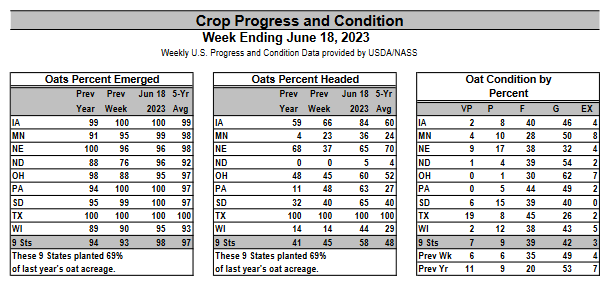
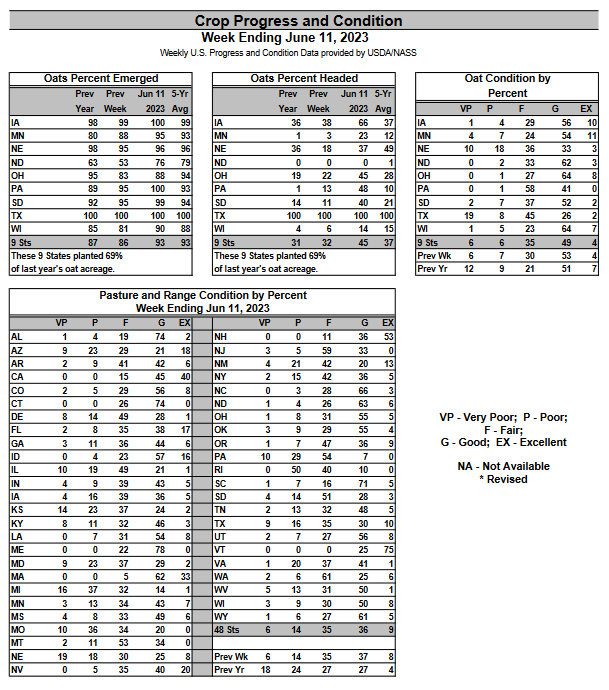
| Oats also seem to have been impacted by the drought |
Some additional detail is provided HEREIt is mostly some additional weeks of data and it is all in larger print. |
Weather Conditions During the Week Reported
| It is easy to see the wet and dry areas in the above map. This graphic is in time sync with the data that was reported. |
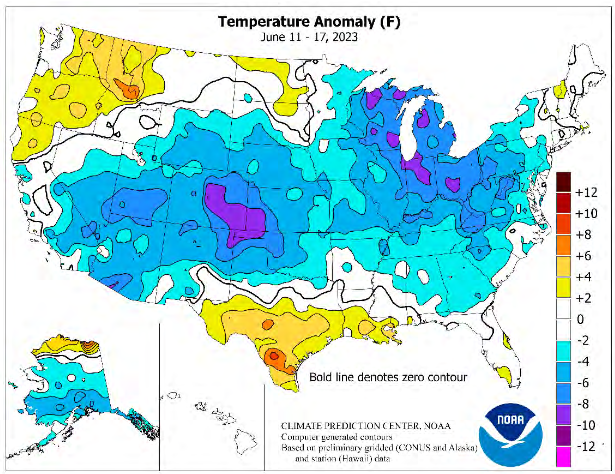
| It was mostly cool in the week reported. Texas had problems with the heat. |
| It is warm enough that there is a need for precipitation and a week of dryness can be a problem and was a problem. The heat was a problem for parts of Texas. |
| It is probably cooler than optimal for most crops. |
Some additional information
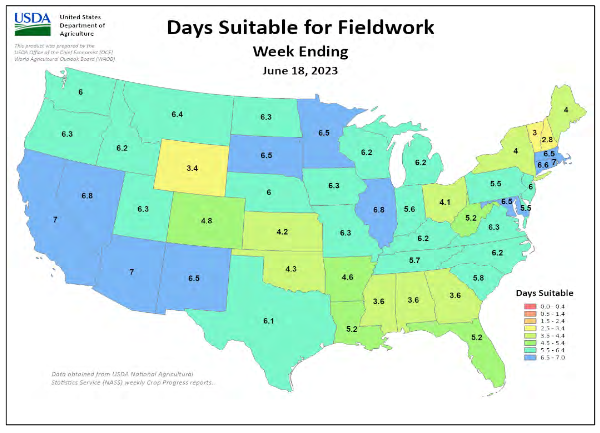
| The yellows and oranges are of interest. They show areas where the number of days suitable for fieldwork was low. There were three states in those categories this past week. |
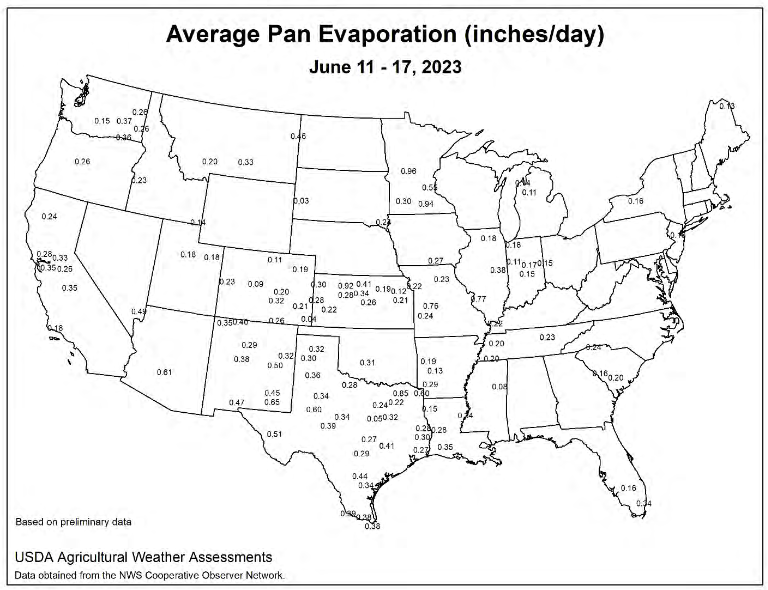
| Pan evaporation refers to the technique (water in a pan) for determining the amount of drying that took place in different areas. Sometimes satellite imagery is used instead of this old-fashioned method but it seems to be preferred in the weekly Crop Bulletin. Very high or low values might be the result of faulty measurement equipment but I did not notice any. However, I did not study the map carefully. The values that I see are in some cases starting to get up there. Look at Minnesota. Texas is where we can find high pan evaporation levels. |
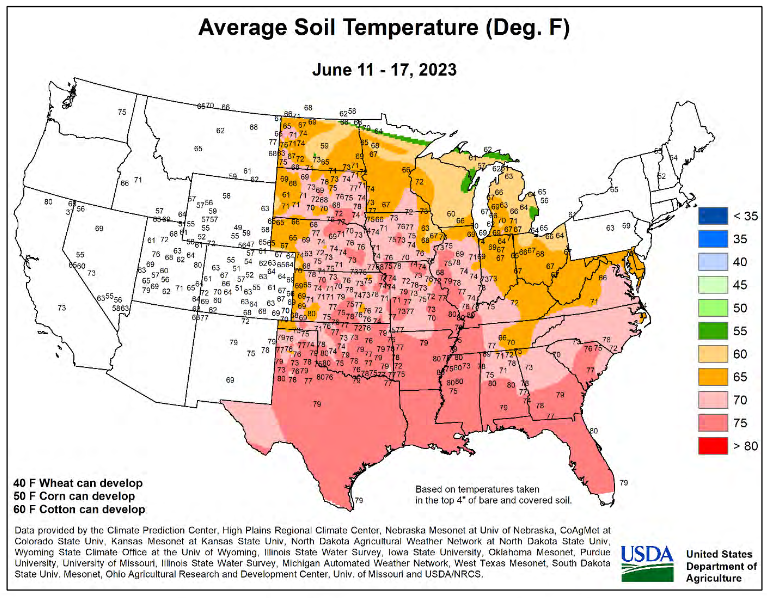
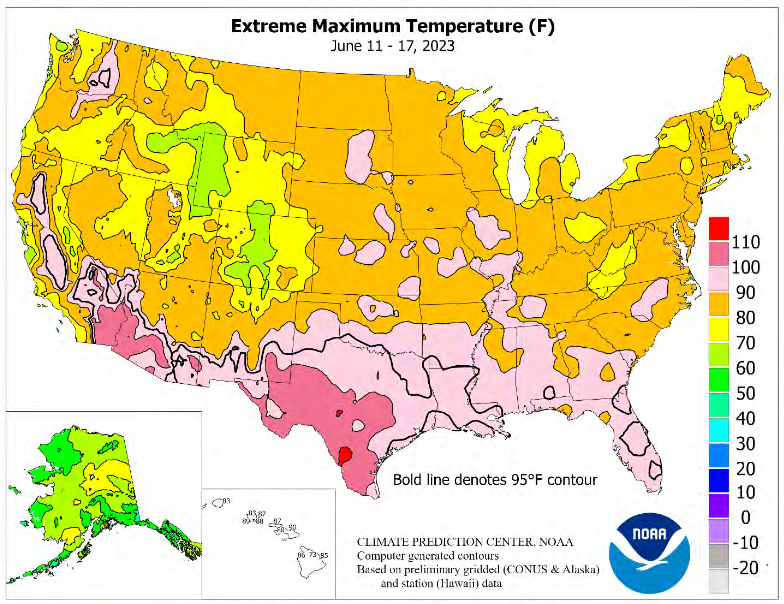
| This looks good in general but it may be too hot in some cases. |
Now the report on Potato stocks
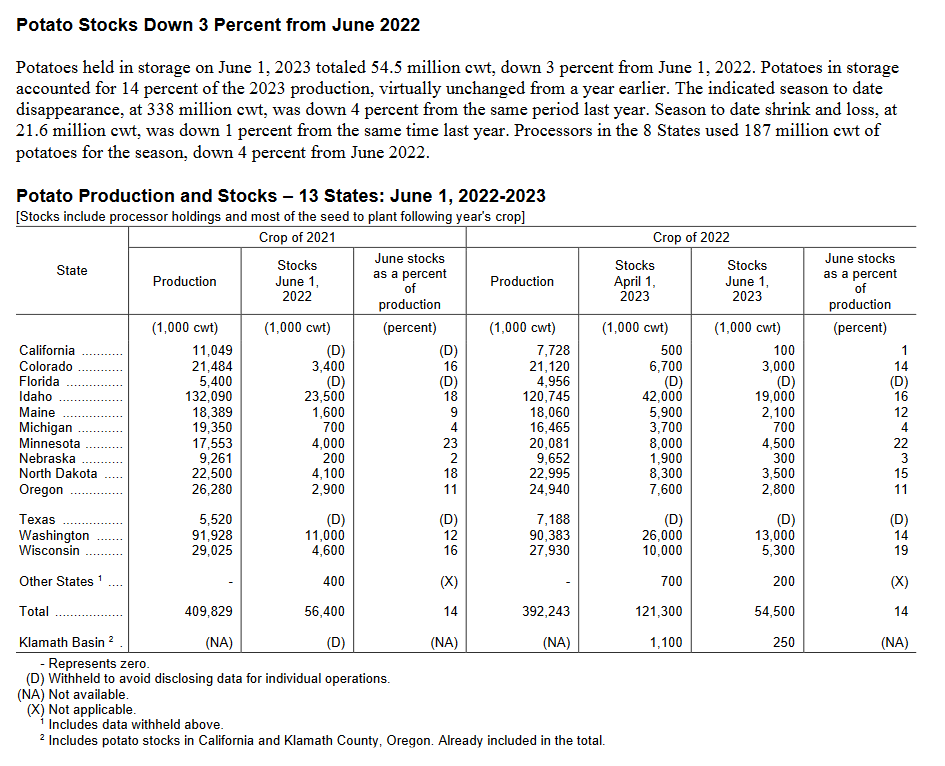
| The full report can be accessed HERE. I spent a lot of time trying to figure out what they meant by “disappearance”. Onwe would think that this would be easy to find out. It is not but I figured it out it is Production minus stocks. |
International
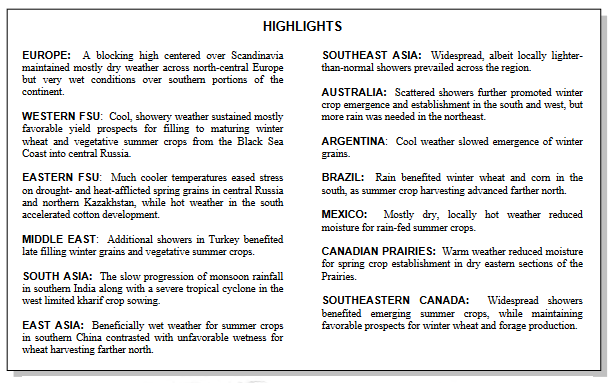
| In the above, there was a variety of less-than-optimal weather conditions in a number of the areas covered. |
The World Map
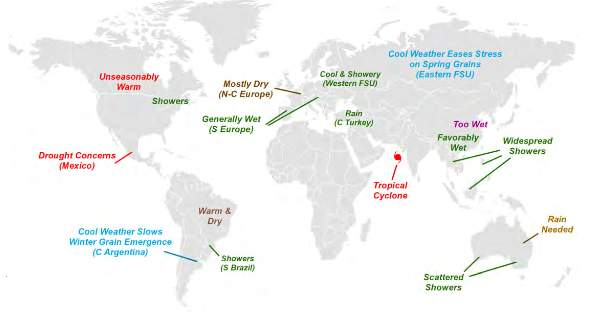
| You can see a variety of positives and negatives in this map which correlates to the graphic above the map. |
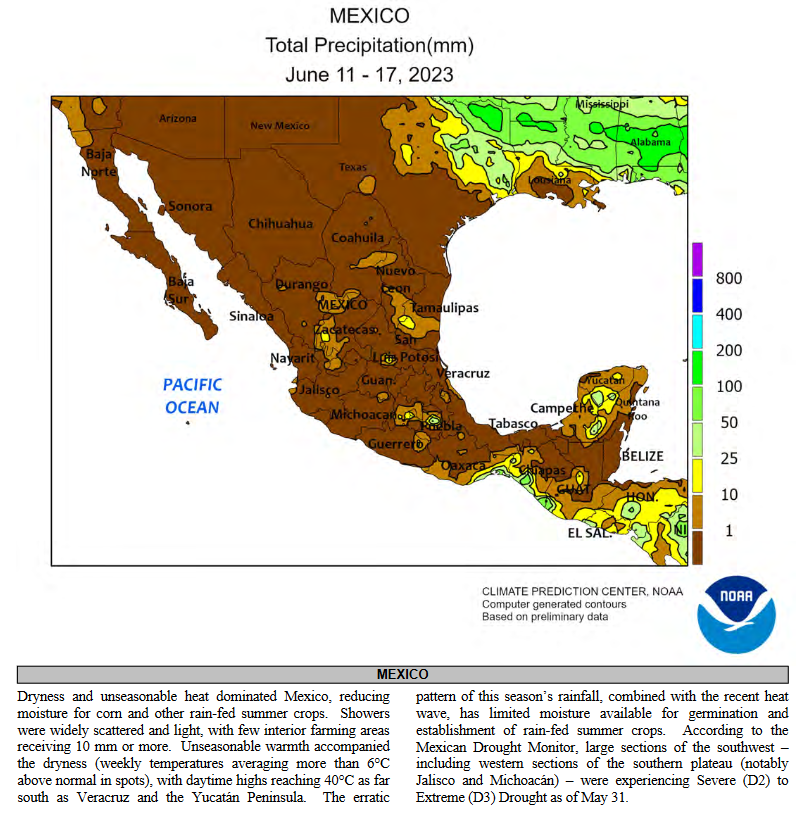
| Mexico is dry and has been dry. |
Sources of Information
Weekly Updates can be found HERE
and perhaps more directly HERE
Additional Useful Sources of Information
WASDE: World Agricultural Supply and Demand Estimates HERE
NASS Report Schedule HERE
Executive Briefings HERE
Economics and Prices HERE
Office of the Chief Economist HERE.
Drought information by crop HERE
–
| I hope you found this article interesting and useful. |