This article is based primarily on the June 13, 2023, USDA Crop Bulletin which covers the June 5 to June 11 period of time. The USDA report usually becomes available on Tuesdays but I am a day late publishing my report.
It now seems more like an average crop. Soybeans, which are a major crop are doing very well. Corn had a very good start but the quality of the crop has been compromised by drought.
We also include recent reports on the Broiler Hatchery and the Turkey Hatchery.
The article includes a short international review of agricultural conditions.
We also provide a short review of last week’s change in ENSO Status.
![]()
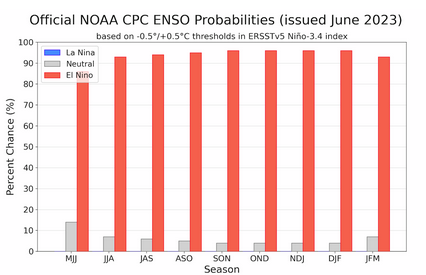
We start with the ENSO Alert System Update. We were asleep last week and got confused with May. The ENSO Alert status is update on the second Thursday which was the 8th this month unlike in May. We will provide the full report later but for now the two key slides.
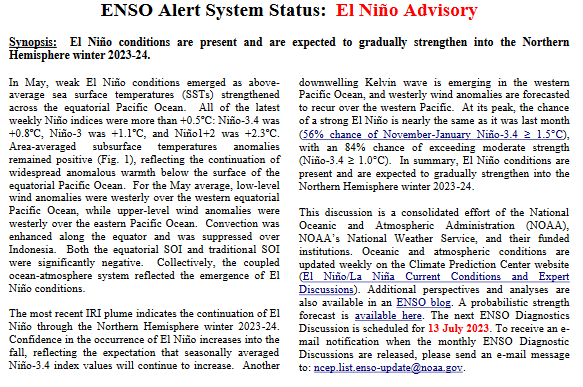
| The key here is the statement “At its peak, the chance of a strong El Niño is nearly the same as it was last month (56% chance of November-January Niño-3.4 ≥ 1.5°C), with an 84% chance of exceeding moderate strength (Niño-3.4 ≥ 1.0°C)”. Get ready. |
| At this point, the real question is about the spring of next year. |
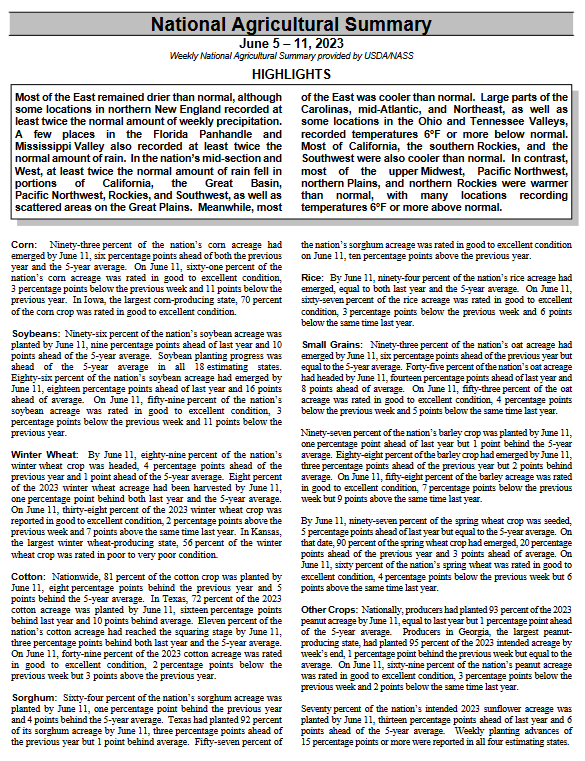
Back to Agriculture, we begin with the National Agriculture Summary. The Tables below the summary have additional data. The boxes with my comments may be incomplete so for crops of interest check the data out yourself to be sure.
| Below is pretty much the same information in table format. However, there is additional information in these tables. |
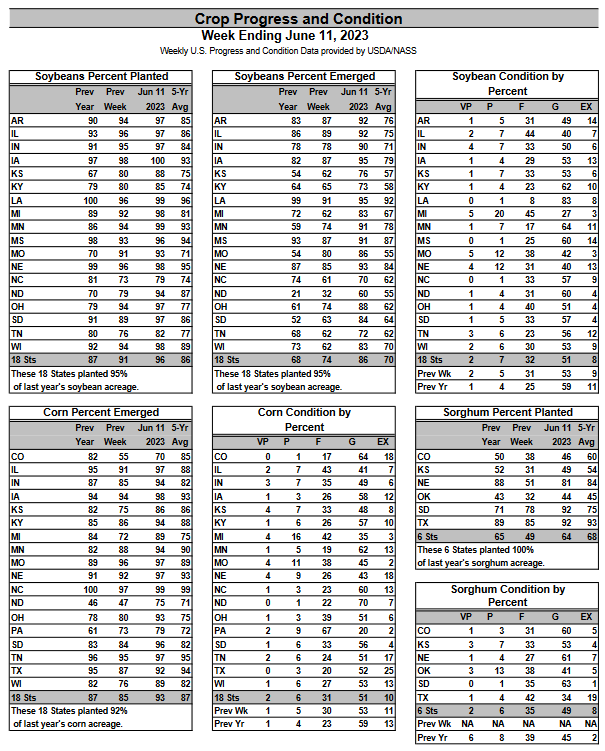
| These crops look good with soybeans looking really good. But the condition of the corn crop continues to deteriorate. In the above corn condition table, look at the excellent column by state. There is time to improve. |
Let us take a look at the weather forecasts.
| 6
– 10
|
|
|
| 8
– 14 |
|
|
| 3
– 4 |
|
|
| There is a large warm area. Where it is warm and dry that is not good. There is one little area up by the Great Lakes predicted to be dry. You can track the situation daily by accessing our Daily Weather forecast which You can access HERE. But the maps in this article also update. |
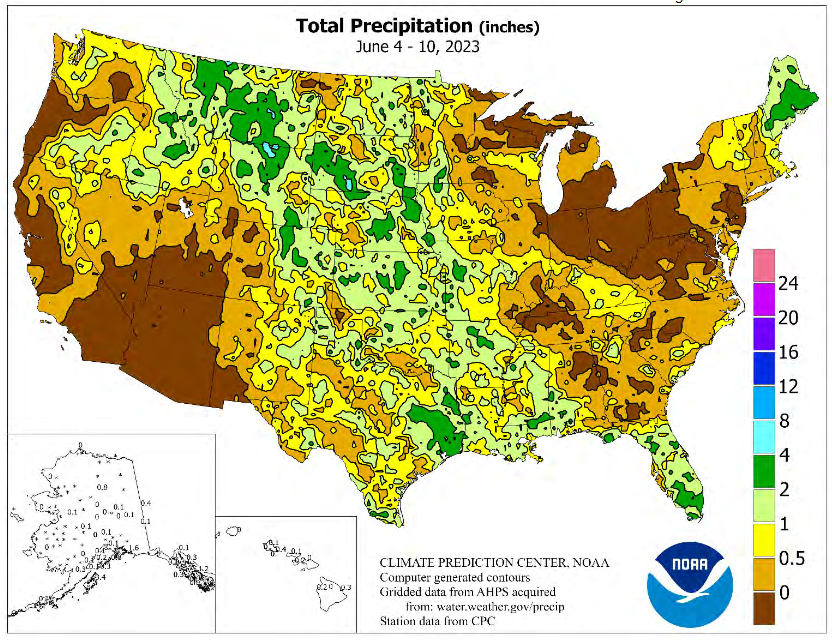
Looking at the month-to-date precipitation

–
| We see that the first twelve days of June were very dry in the corn belt. But drought is not the only issue corn has to deal with as per this LINK. |
Here is another view
This helps explain the situation. Similar maps for other crops can be found HE RE. RE. |
Looking at other crops.
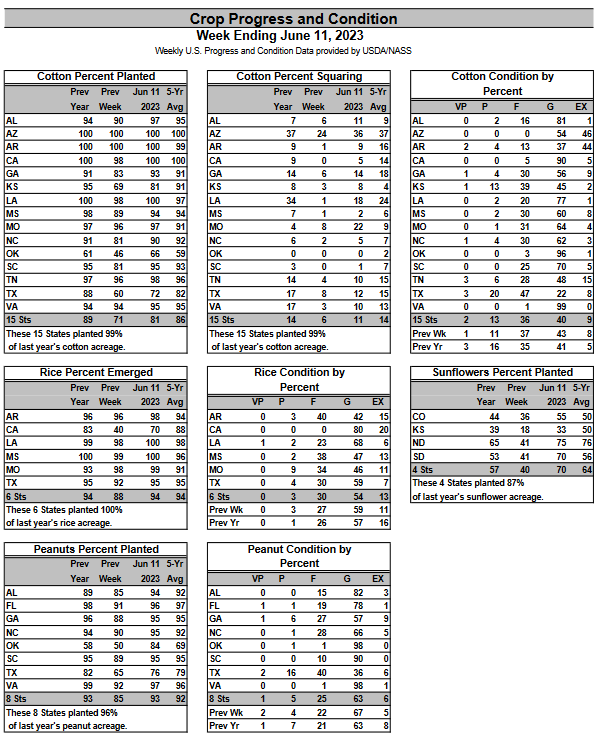
| Sunflowers are doing well but cotton is not. |
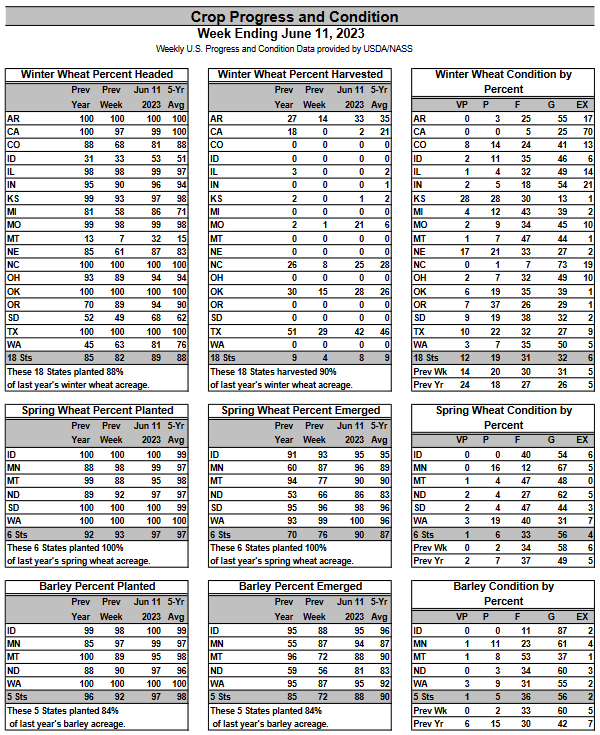
| These crops are ok. They generally had a good week. |
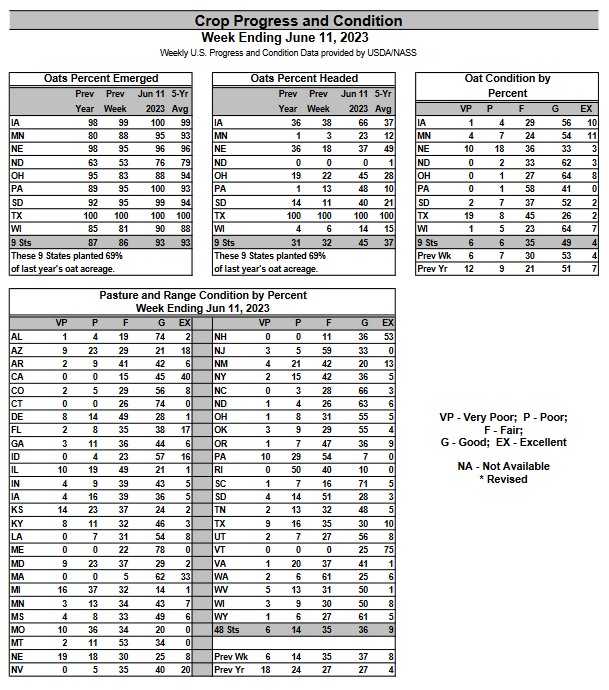
| The above looks good. |
Some additional detail is provided HEREIt is mostly some additional weeks of data and it is all in larger print. |
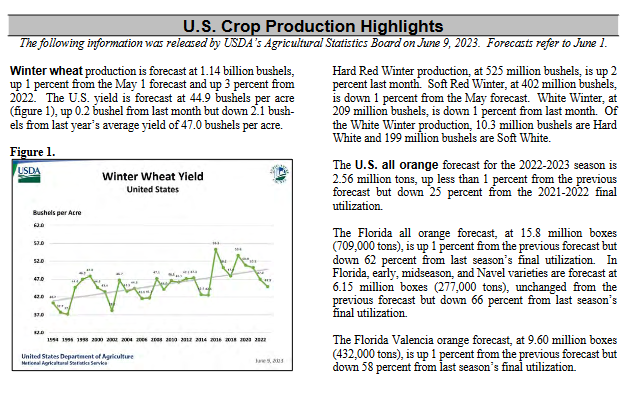
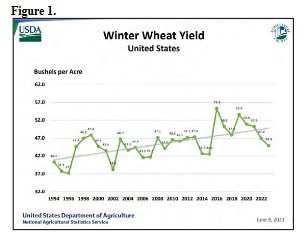
| It is hard to read the winter wheat yield number. You can see the regression line but the last five years have been down so what really is the trend? We will look into the citrus situation in a future article but I have provided a clue below. |
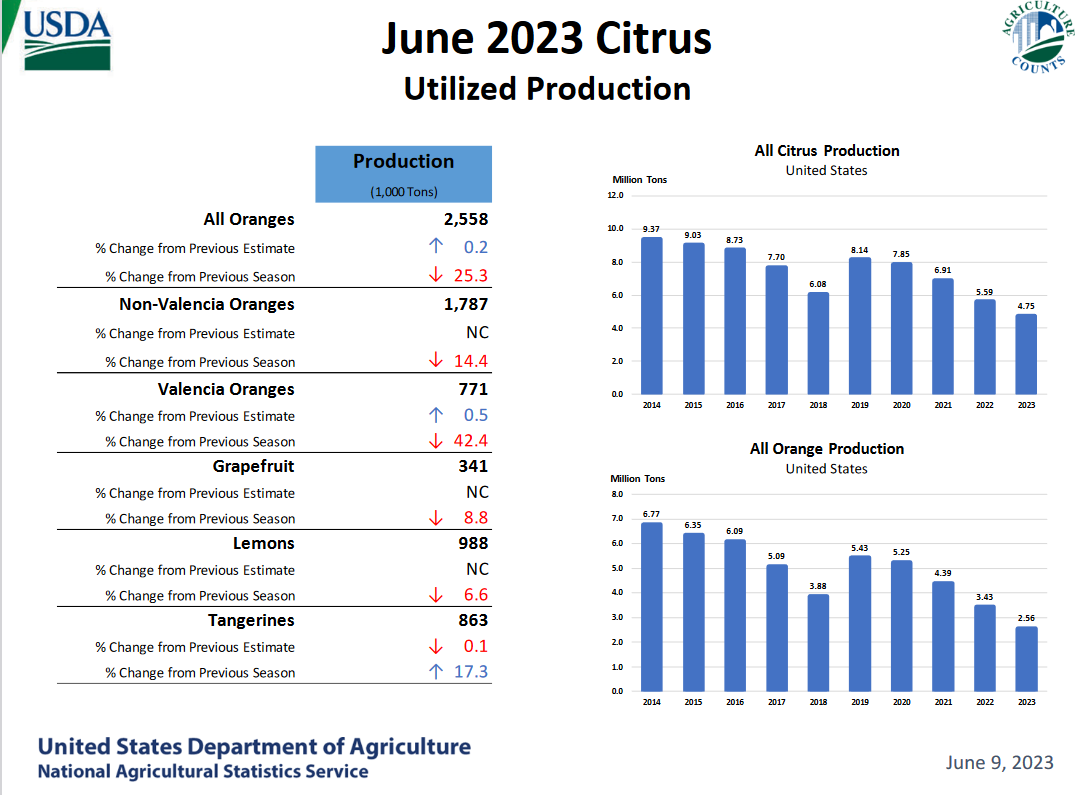
| It is difficult to reconcile the numbers without more data. But these downward trends are stunning. |
Weather Conditions During the Week Reported
| It is easy to see the wet and the dry areas in the above map. This graphic is in time sync with the data that was reported. |
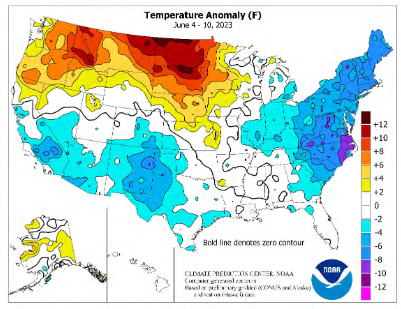
| You can see the warm anomaly which may have been beneficial to crops in that area. It is farther west than last week. |
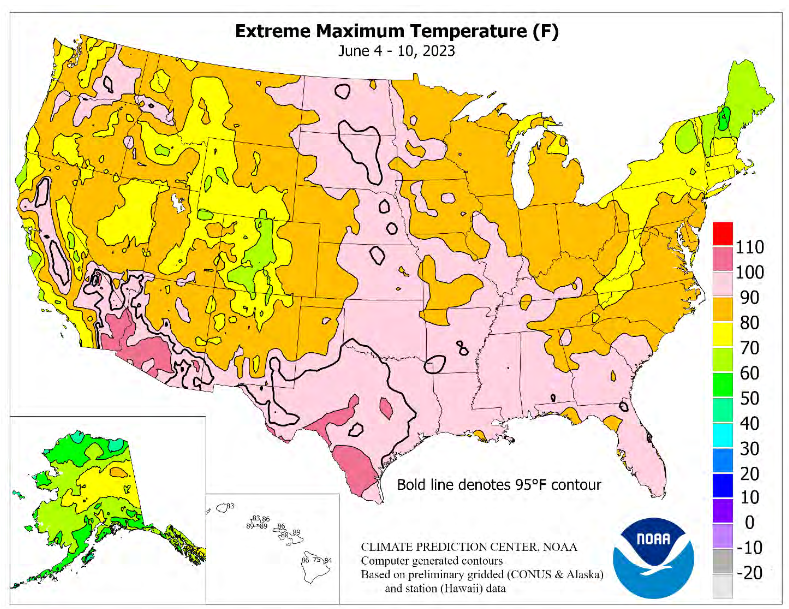
| It is warm enough that there is a need for precipitation and a week of dryness can be a problem and was a problem. Apparently warm and flooded can be a problem also and has been in Ohio. |
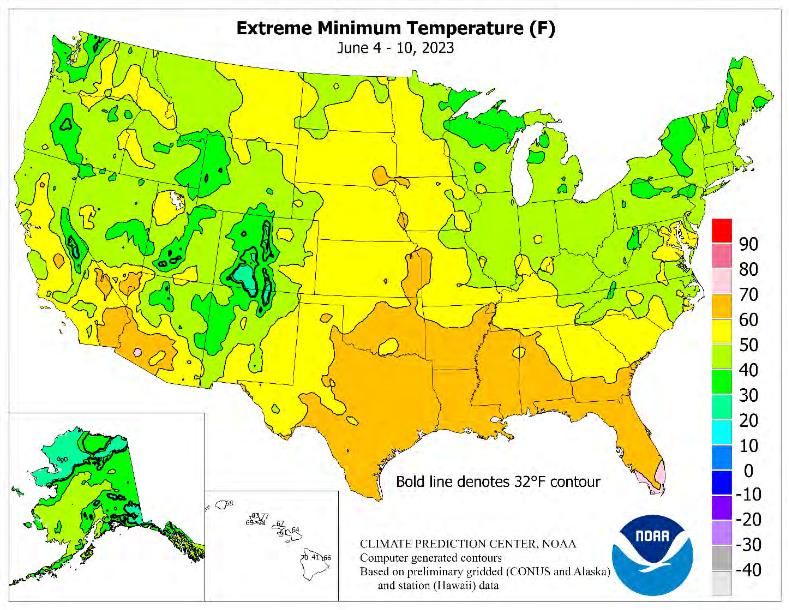
| The minimum temperatures and the cold anomalies are what is of most interest this time of the year. We had some areas that had temperatures of 32F or less but it needs to be colder than 32F usually to do significant damage and most of these in the 32F contour are in the mountains i.e. not major growing areas. |
Some additional information
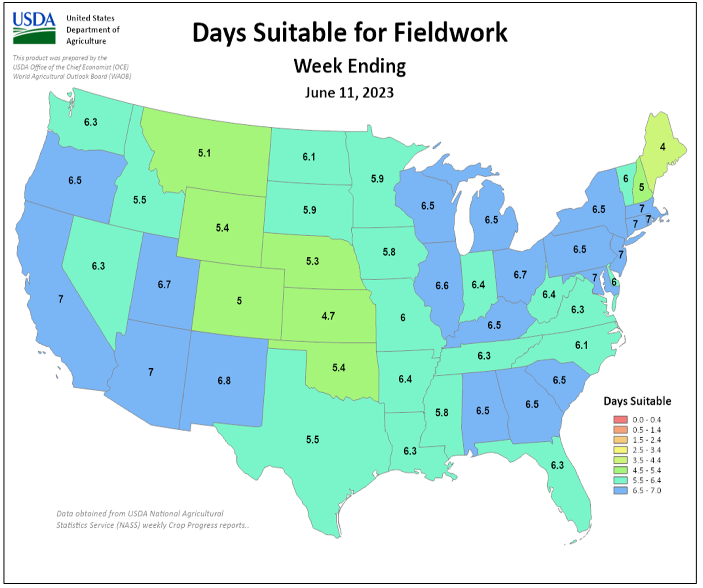
| The yellows and oranges are of interest. They show areas where the number of days suitable for fieldwork was low. There were no states in those categories this past week. |
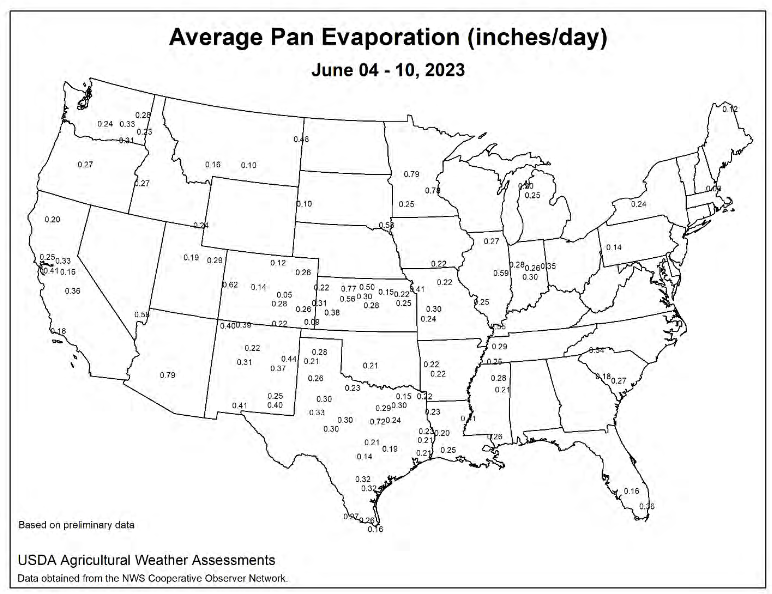
| Pan evaporation refers to the technique (water in a pan) for determining the amount of drying that took place in different areas. Sometimes satellite imagery is used instead of this old-fashioned method but it seems to be preferred in the weekly Crop Bulletin. Very high or low values might be the result of faulty measurement equipment but I did not notice any. However, I did not study the map carefully. The values that I see are in some cases starting to get up there. Look at Minnesota. |
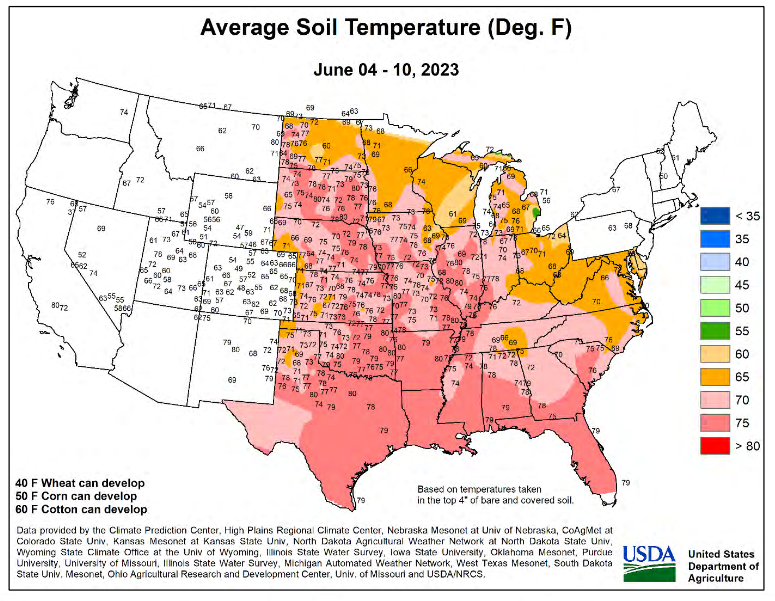
| This looks good in general but it may be too hot in some cases. |
Now the report on the Broiler Hatchery.
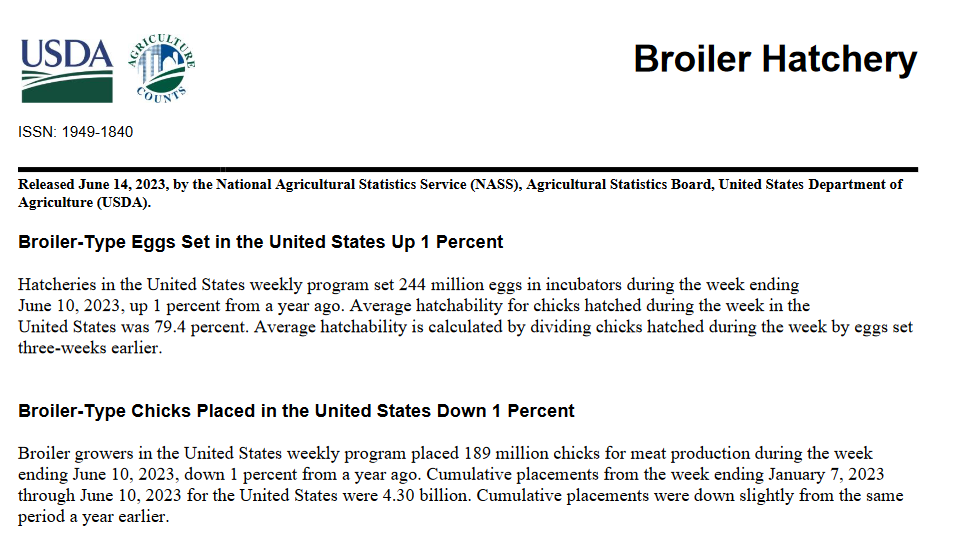
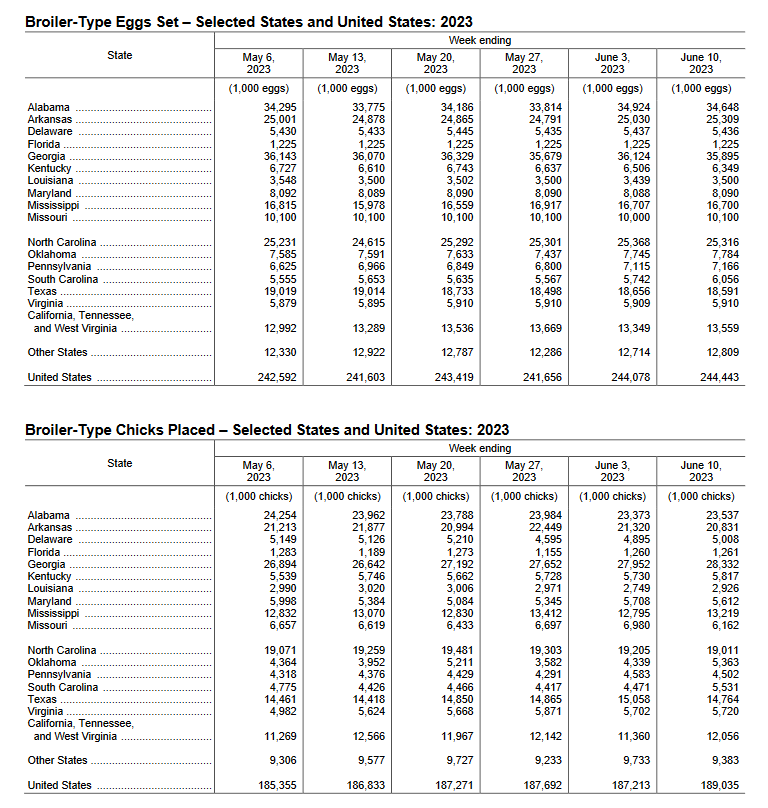
| Which came first? The full report can be accessed HERE. A personal note and these are meat chickens not egg production but when we raise chickens at our little hobby farm we look for close to 100% hatching. But that is why we never could make any money since there is a trade-off between hatchability and cost. I will not describe what you have to do to improve the hatchability percentage. I will give you a clue though it is to avoid pasting. |
And the report on the Turkey Hatchery
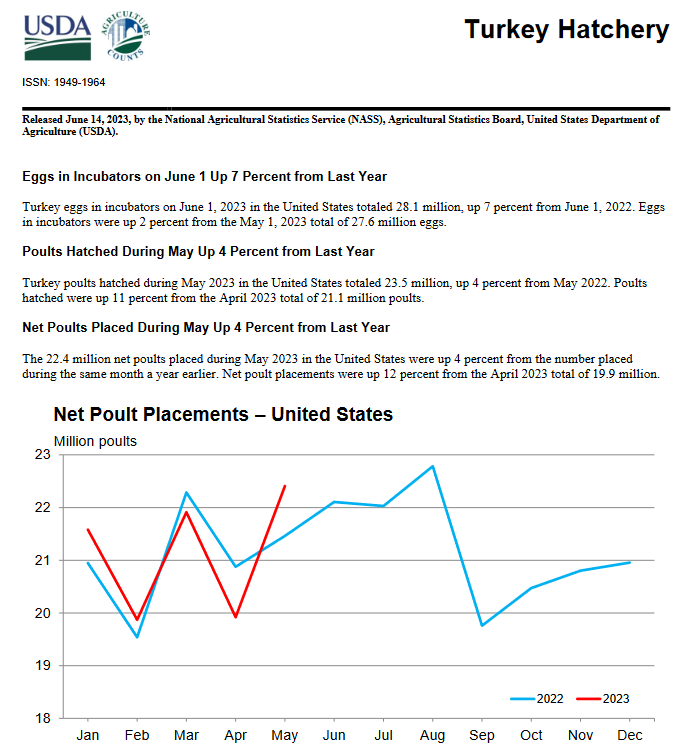
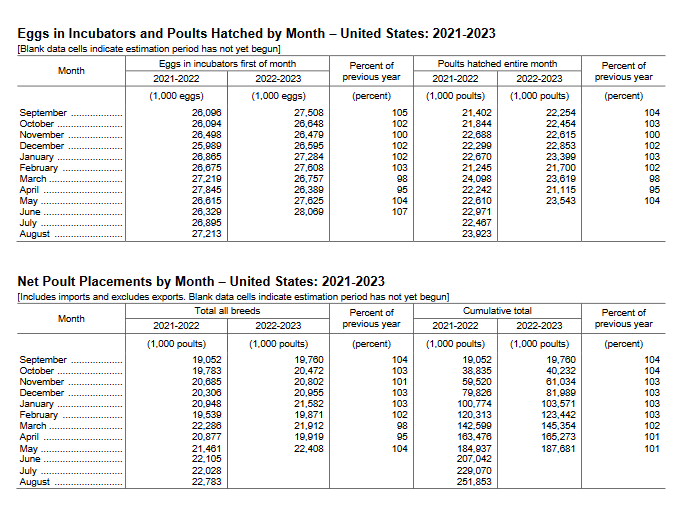
| The full report can be accessed HERE. |
International
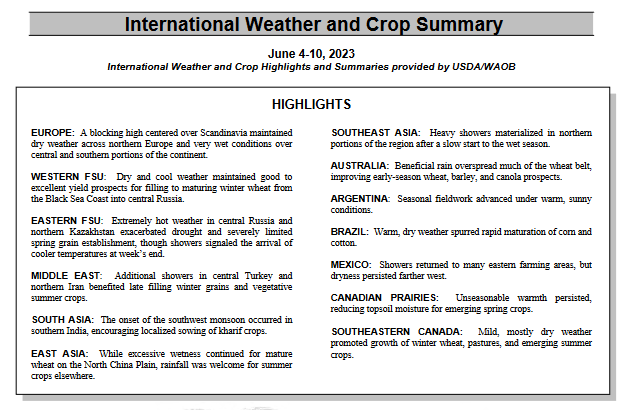
| In the above, hot weather was a problem for the Eastern FSU and the Canadian Prairies. |
The World Map
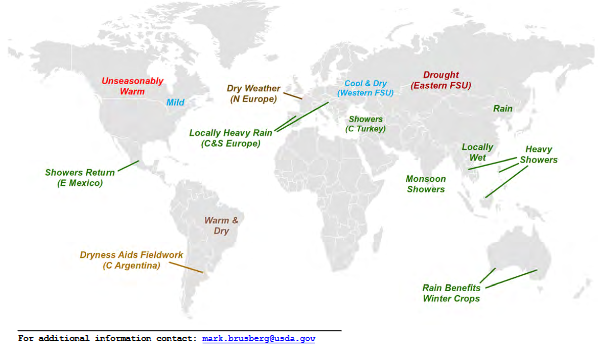
| It will be interesting to see how El Nino and the positive IOD change the pattern. |
Sources of Information
Weekly Updates can be found HERE
and perhaps more directly HERE
Additional Useful Sources of Information
WASDE: World Agricultural Supply and Demand Estimates HERE
NASS Report Schedule HERE
Executive Briefings HERE
Economics and Prices HERE
Office of the Chief Economist HERE.
Drought information by crop HERE
–
| I hope you found this article interesting and useful. |