There is a constant flow of news about Global Warming. One indicator of the drivers of Global Warming is the concentration of carbon dioxide concentrations. NOAA Report. We have previously explained how carbon dioxide and other greenhouse gases cause the atmosphere to warm. Knowing the current level of carbon dioxide in the air is essential. Based on the assumption that we have a well-mixed atmosphere one could in theory measure it anywhere. An isolated place like Mauna Loa in Hawaii is ideal except when the volcano is erupting. Usually, it is close to a perfect location. It is measured in more than one place since the assumption that the atmosphere is well-mixed is an approximation. NOAA reports on the level monthly and I thought this would be a good time to provide one of their reports and explain the Keeling Curve.
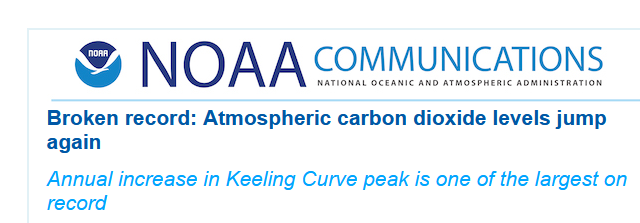
| This is a monthly report. A higher level each month is routine. |
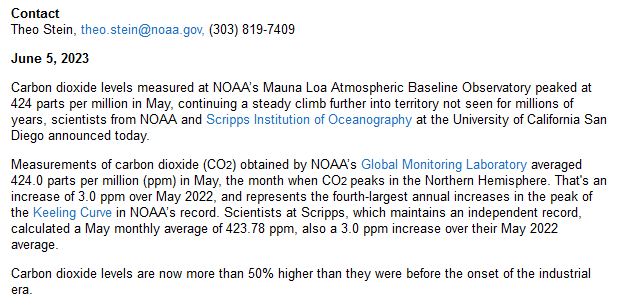
| This is the NOAA summary of the press release. I only show two graphics from the report because the summary covers the information provided. The cumulative 50% increase is pretty significant. That the increase in May was the fourth-largest monthly increase is also noteworthy. |
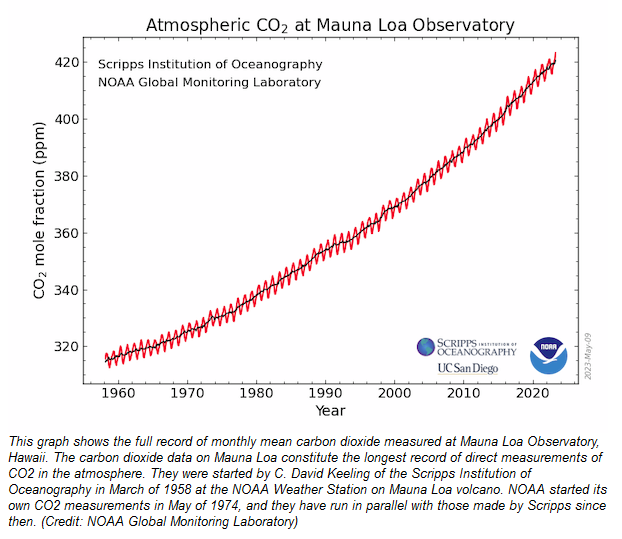
| Here is the data. You can see the annual cycle and importantly the increase is not linear. The format was developed by Charles Keeling and thus is called the Keeling Curve. |
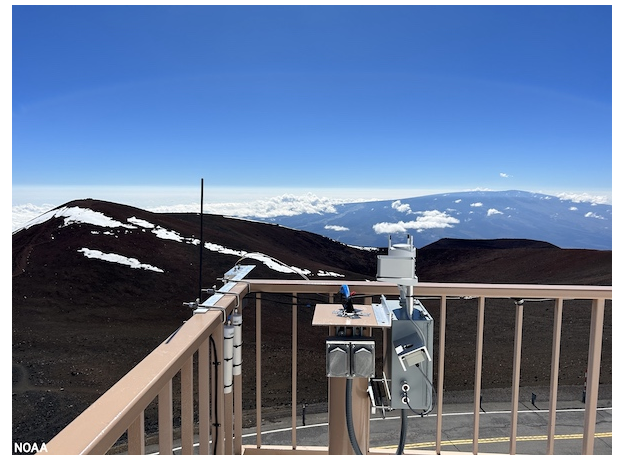
| The above is one of the places where the measurements are taken..a nice place usually above the clouds but probably the coldest place in Hawaii. |
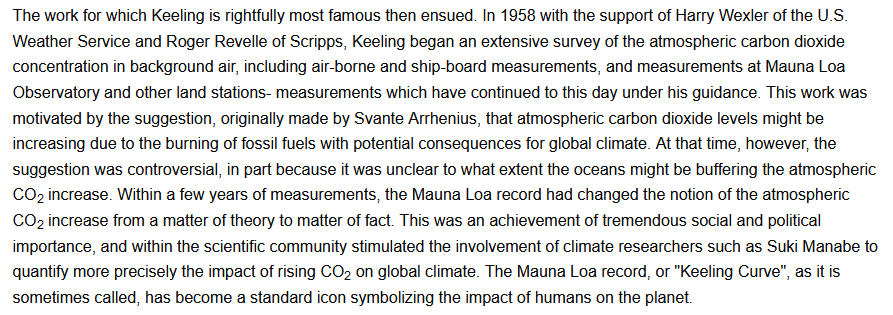
| The above for his biography at the Scripts Institute of Oceanography LINK is pretty informative but his entire biography is worth reading. In the above, we see that back in 1957 many thought the oceans would be able to absorb the carbon dioxide emitted by burning fossil fuels and other chemical reactions. Unfortunately, the rate of emissions is too high for that to be the case. |
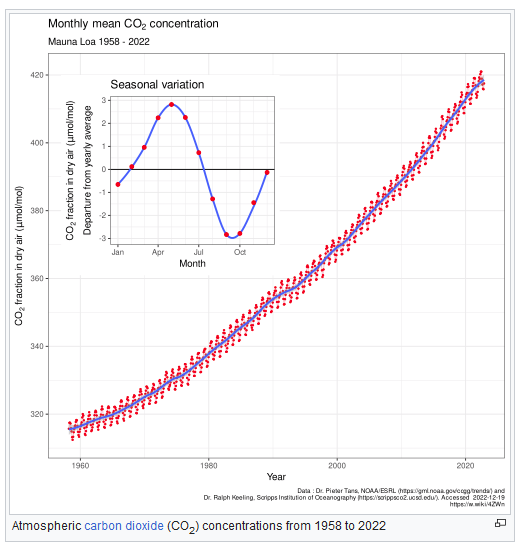
| This from Wikipedia has an inset that shows the seasonal variation in carbon dioxide levels due to there being more Land area in the Northern Hemisphere thus more sequestering of carbon dioxide in plants as part of photosynthesis. |
| More information on the Keeling Curve can be found at this Skeptical Science Article HERE. A lot of information is provided on the Keeling Curve and the impact of carbon dioxide on Global Warming. It is worth reading. |
–
| I hope you found this article interesting and useful. |
–