This article is based primarily on the June 6, 2023, USDA Crop Bulletin which covers the May 29 – June 4 period of time. The USDA report usually becomes available on Tuesdays.
Almost all crops are doing well. Soybeans, which is a major crop is doing very well. Corn has had to deal with a difficult drought situation but the weather is forecast to improve for much of the corn belt.
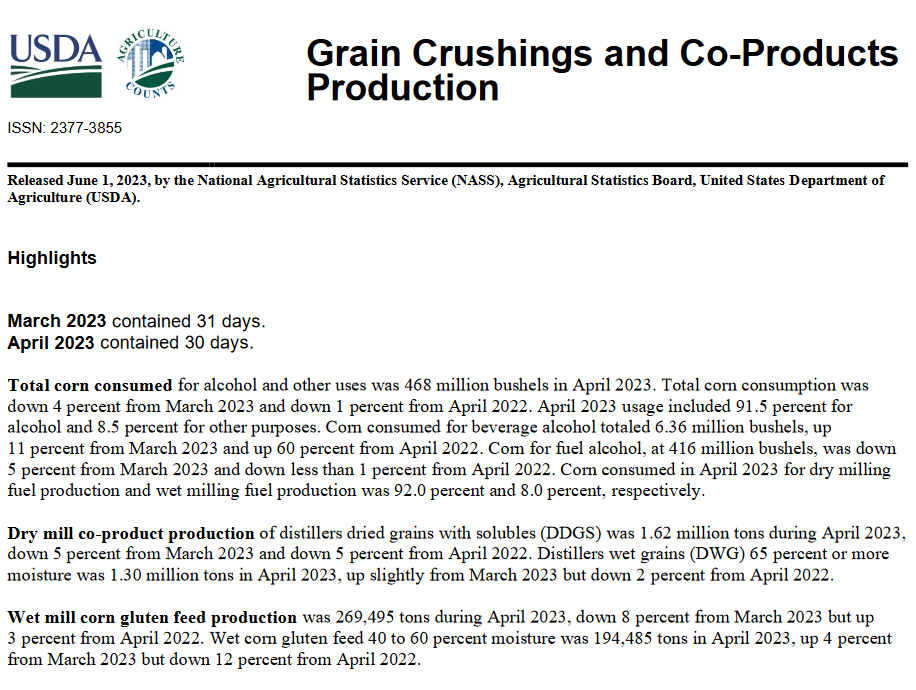
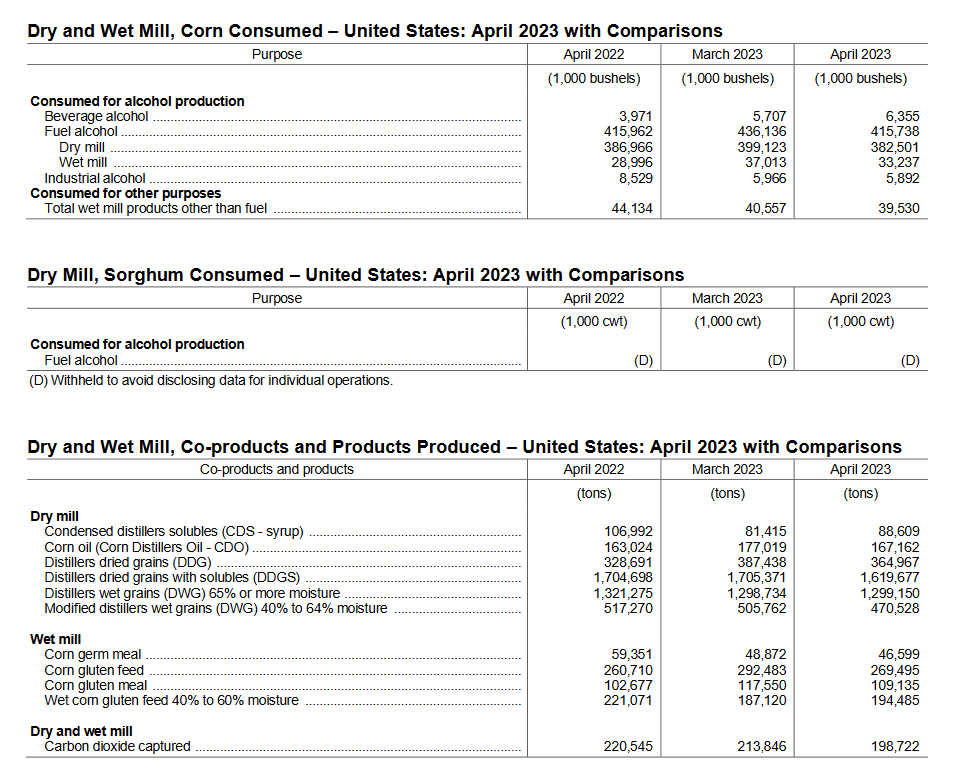
We also include the recent report on grain grindings.
The article includes a short international review of agricultural conditions.
![]()
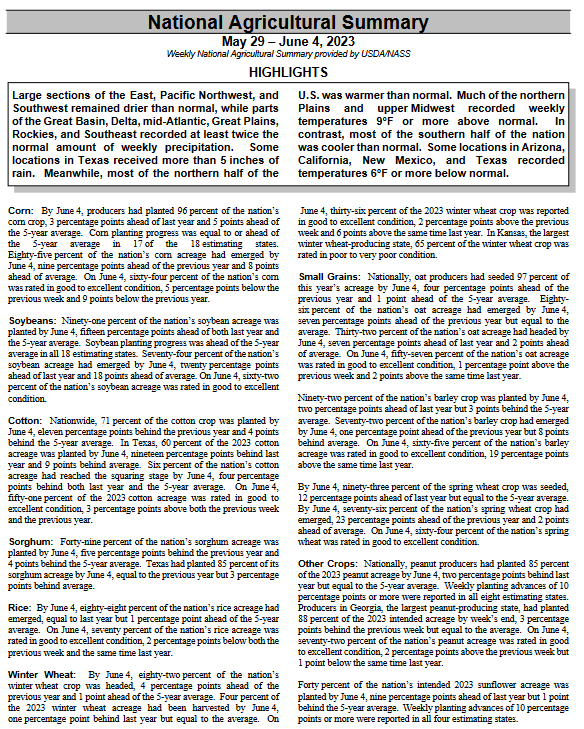
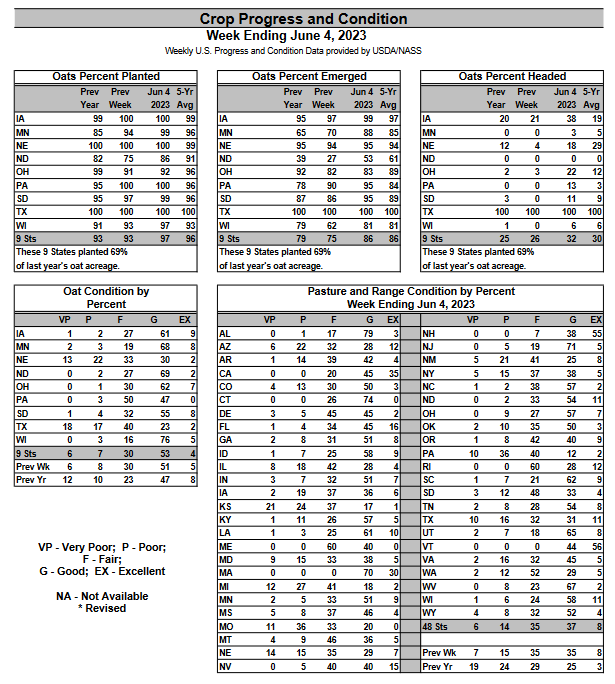
We start with the National Agriculture Summary. The Tables below the summary may have additional data. The boxes with my comments may be incomplete so for crops of interest check the data out yourself to be sure.
| Below is pretty much the same information in table format. However, there is additional information in these tables. |
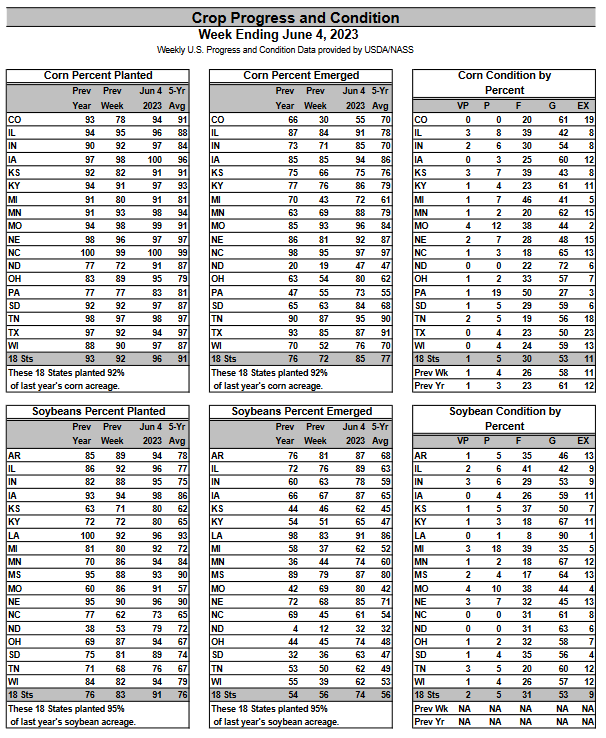
| These crops look good with soybeans looking really good. But the condition of the corn crop has deteriorated. We will see how corn fairs in states previously forecast to have a precipitation deficit in June. It looks like the second half of May and the first week of June has been very hard on the corn crop. Corn is very vulnerable to flash droughts. |
Let us take a look at the weather forecasts for June.
| 6
– 10
|
|
|
| 8
– 14 |
|
|
| 3
– 4 |
|
|
| It does not look bad from this point on. There is one little area up by the Great Lakes predicted to be dry but that is it. You can track the situation daily by accessing our Daily Weather forecast which you can access HERE. |
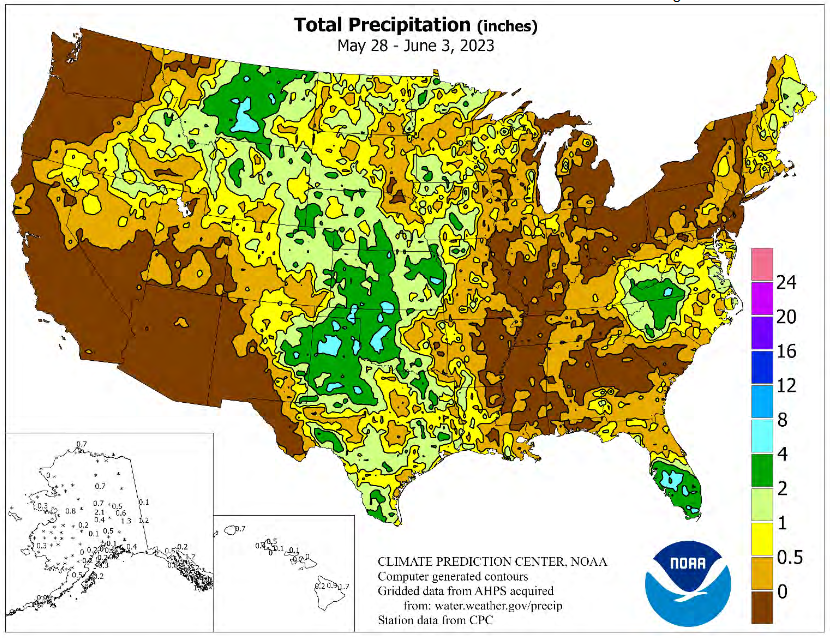
Looking at the month-to-date precipitation

–
Here is another view

| This helps explain the situation. Similar maps for other crops can be found HERE. |
Looking at other crops.
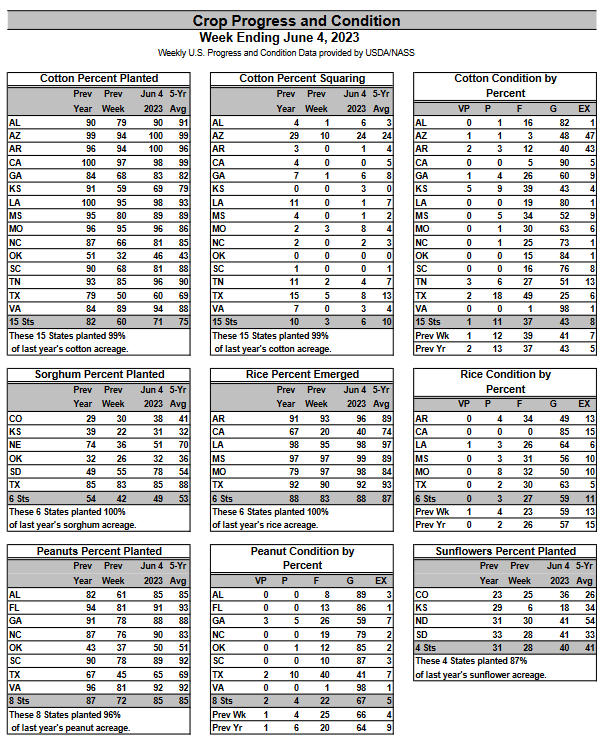
| These crops are not looking as good as last week. Cotton could be doing better but it is early. |
| These crops are ok. |
| The above looks good. |
Some additional detail is provided HEREIt is mostly some additional weeks of data and it is all in larger print. |
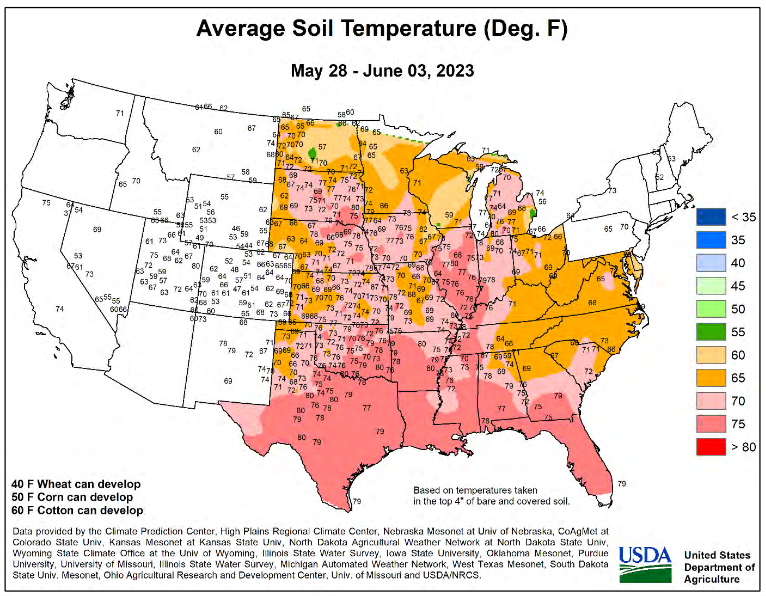
Weather Conditions
| It is easy to see the wet and the dry areas in the above map. This graphic is in time sync with the data that was reported. |
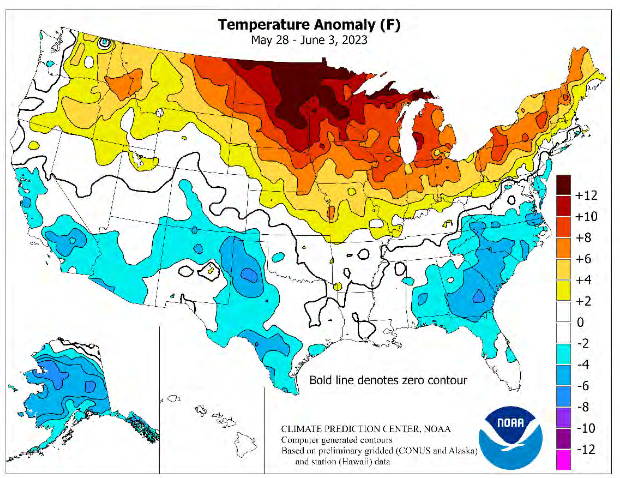
| You can see the warm anomaly which may have been beneficial to crops in that area if there had been adequate precipitation but that was not the case. |
| It is warm enough that there is a need for precipitation and a week of dryness can be a problem and was a problem. |
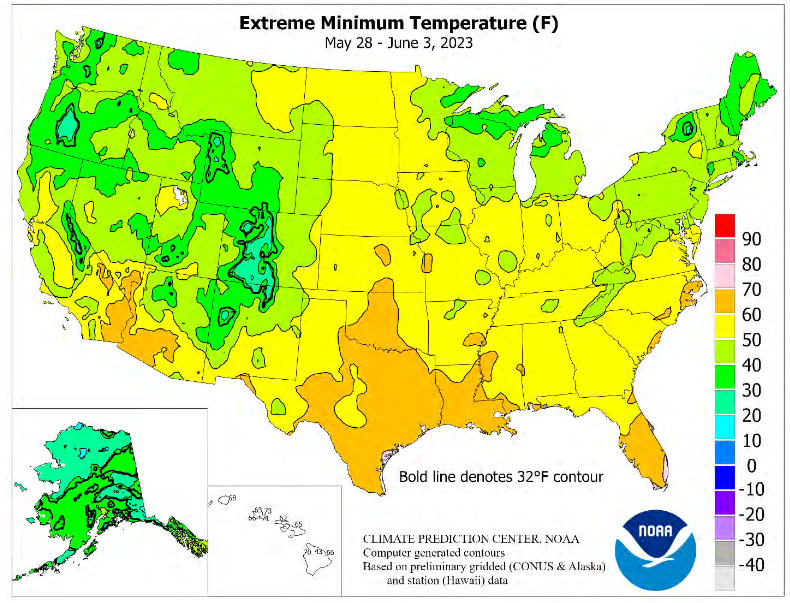
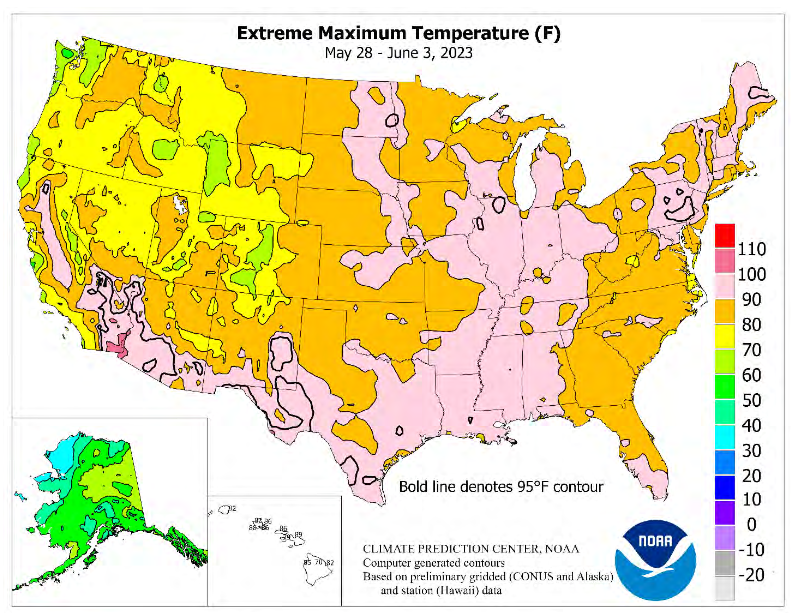
| The minimum temperatures and the cold anomalies are what is of most interest this time of the year. We had some areas that had temperatures of 32F or less but it needs to be colder than 32F usually to do significant damage and most of these in the 32F contour are in the mountains i.e. not major growing areas. |
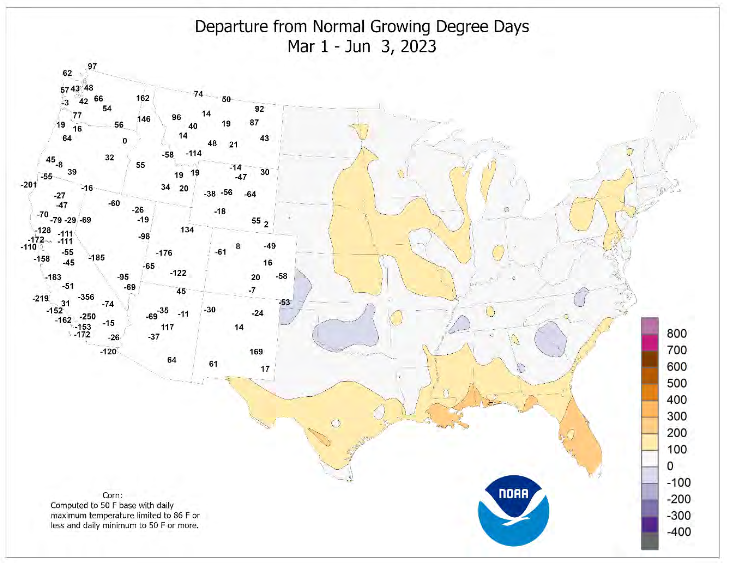
| This is the accumulated version of this map. Overall it looks positive with only a few areas in deficit and the areas with positive values were probably not warm enough to be detrimental to the crop. |
Some additional information
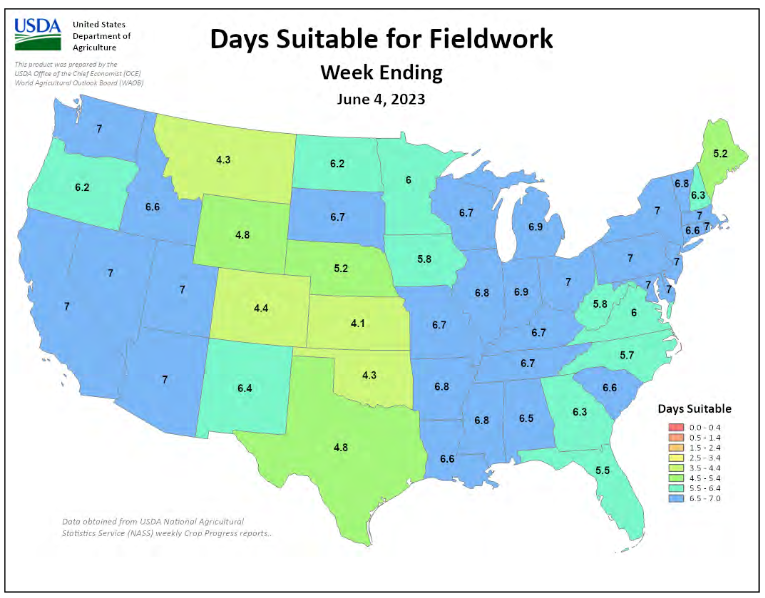
| The yellows and oranges are of interest. They show areas where the number of days suitable for fieldwork was low. There were no states in those categories this past week. |
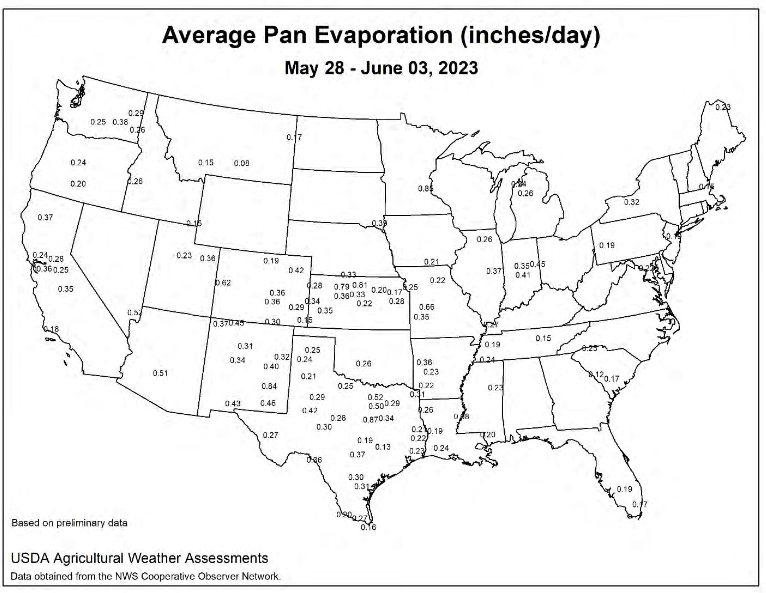
| Pan evaporation refers to the technique (water in a pan) for determining the amount of drying that took place in different areas. Sometimes satellite imagery is used instead of this old-fashioned method but it seems to be preferred in the weekly Crop Bulletin. Very high or low values might be the result of faulty measurement equipment but I did not notice any. However, I did not study the map carefully. The values that I see are pretty low. That is not surprising given the wet cool weather in much of the area where these readings were taken. When I see values greater than 1.0 I am concerned. |
| This looks good. |
Now the report on Grain Crushings.
International
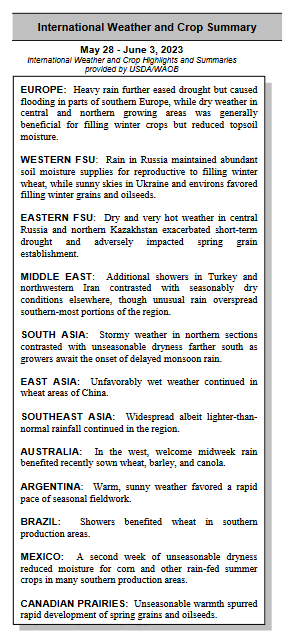
| In the above, lack of rain was a problem for the Eastern FSU, South Asia, and Mexico while it was too wet in East Asia. |
No World Map this month so I decided to show Europe. 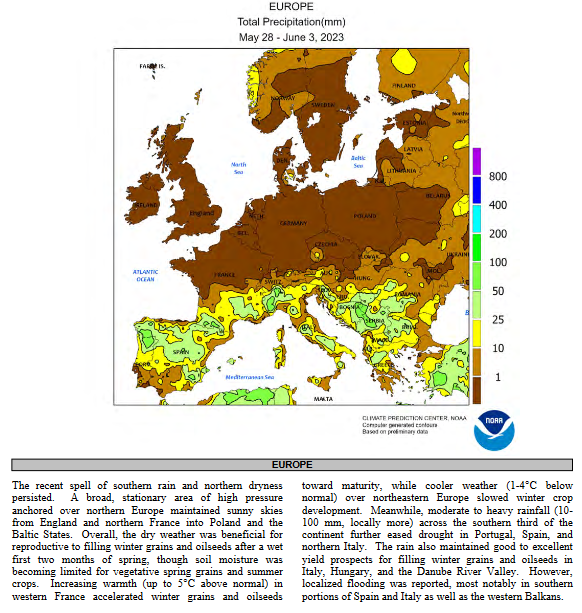
| Talk about a North/South Divide. |
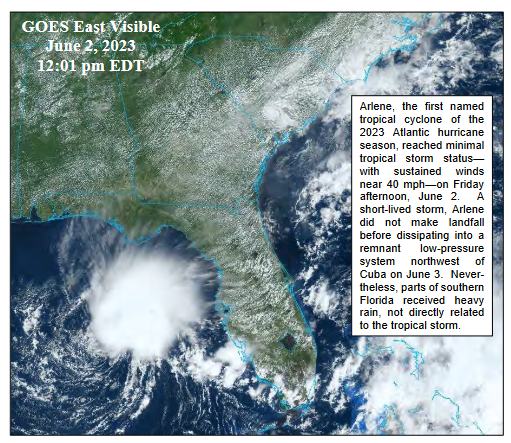
| Dodged a bullet |
Sources of Information
Weekly Updates can be found HERE
and perhaps more directly HERE
Additional Useful Sources of Information
WASDE: World Agricultural Supply and Demand Estimates HERE
NASS Report Schedule HERE
Executive Briefings HERE
Economics and Prices HERE
Office of the Chief Economist HERE.
Drought information by crop HERE
–
| I hope you found this article interesting and useful. |