At the end of every month, NOAA updates their Early Outlook for the following month which in this case is March. They also issue a drought outlook for the following month. We are reporting on that tonight. The updated Outlook is not very different from the Early Outlook which NOAA now calls the Mid-Month Outlook. It is a bit less warm than the Mid-Month Outlook, slightly wetter, and there seems to be a lower level of confidence in the probabilities associated with the various anomalies in the Outlook. There is a lot of variation throughout the month and this is described in the NOAA discussion and we provide partial-month outlooks for the first 25 days of March. We also provide enough information for readers to understand any changes from the Mid-Month Outlook and we try to figure out why these changes were made.

Updated March Outlooks
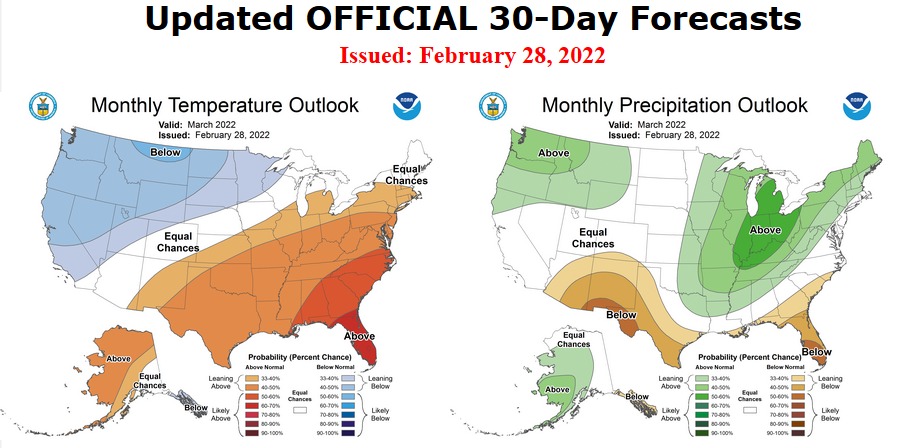
For those who want a quick answer, here is the updated Outlook for March. NOAA uses the word “outlook” when they are forecasting deviations from normal (also known as climatology). That makes sense and it reminds me to remind everyone that this is what is being presented here: predicted deviations from normal. And if you look at the legend and the labeling, NOAA is quite clear that this is what they are doing. Quite frankly I think this sort of map is more useful than a forecast of absolute values of temperature and precipitation for most purposes.
Here are larger versions of the Temperature and Precipitation Outlooks.
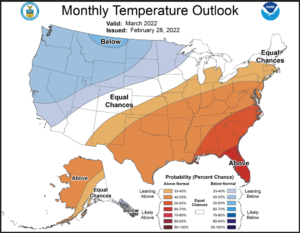
First Temperature

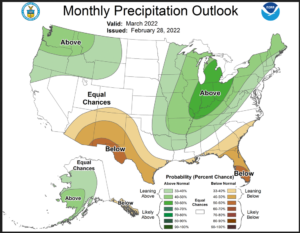
Then Precipitation

NOAA Discussion
30-DAY OUTLOOK DISCUSSION FOR MARCH 2022
The current state of the El Niño Southern Oscillation (ENSO) remains in the negative phase with the latest weekly observed Niño 3.4 Index value standing at -0.8 degrees Celsius. Meanwhile, the magnitude of the Real-time Multivariate (RMM) based Madden Julian Oscillation (MJO) index has decreased in recent days, but still maintains a signal near the Indian Ocean and Maritime Continent. Composites from this combined ENSO/MJO state for the month of March depicts a 500-hPa flow pattern consistent with the negative phase of the Pacific / North American (PNA) teleconnection pattern and similar to that indicated by the previous March 2022 outlook issued on February 17 (herein referred to as the mid-month outlook). However, as we close out the month of February, short term dynamical model guidance is increasingly relied upon with the official 3-7 Day Outlooks from the Weather Prediction Center (WPC), 8-14 Day Outlooks from the Climate Prediction Center (CPC), and Weeks 3-4 Outlooks from CPC forming the backbone of the updated March 2022 outlooks. These outlooks reveal a variable pattern for the month of March with changeable weather across large swathes of the country as the month progresses. Dynamical model guidance from the Climate Forecast System Version 2 (CFSv2), the Global Forecast System (GFS), the European Centre for Medium Range Weather Forecasts (ECMWF), and Environment and Climate Change Canada (ECCC) clearly indicate this variable pattern. The consensus of these dynamical models forecast ridging over the western two-thirds of the Contiguous United States (CONUS) early in the month quickly being replaced by a deep trough by mid-month with ridging developing downstream across the Eastern Seaboard. The CFS and GFS indicate the potential for a more zonally oriented pattern across much of the CONUS by the time we close out the month of March. Dynamical model guidance forecasts a strong ridge to build across much of Alaska during early to mid-March. However, the CFSv2 and GFS indicate the potential for increased troughing over southeastern parts of the state towards the end of the month.
The updated March temperature outlooks indicate increased probabilities of above normal temperatures across much of the eastern and south-central CONUS. The greatest confidence for above normal temperatures is across the Florida Peninsula, where probabilities exceed 60 percent. This represents an eastward shift in the area of favored above normal temperatures relative to the mid-month outlook, due to the potential for deep troughing over the western CONUS by the middle of the month. This potential trough leads to an expansive area of favored below normal temperatures across much of the western and north-central CONUS. Probabilities of above normal temperatures are elevated upstream across western Alaska as a strong ridge builds during the first half of the month. Below normal temperatures are slightly favored for the Alaska Panhandle due to the potential for increased troughing during the latter half of the month.
The updated March 2022 precipitation outlook is generally consistent with the negative phase of ENSO and similar to that depicted in the mid-month outlook. As a strong trough is forecast to develop across the western two-thirds of the CONUS by mid month, moist flow ahead of it favors above normal precipitation for much of the east-central CONUS and eventually to the Northeast. Above normal precipitation is also favored for the northwestern CONUS, due to an active pattern predicted early in the month coupled with likely mean cyclonic flow for the month as a whole. A tilt in the odds toward below normal precipitation is indicated across much of the Southern Tier of the CONUS, consistent with the consensus of dynamical model guidance and with La Niña composites. Above normal precipitation probabilities are enhanced for much of western and central Alaska, due to the potential for prevailing southwesterly mid-level flow. As a ridge builds across the Mainland early to mid-month, below normal precipitation is favored downstream of the ridge axis across the Panhandle.
PNA
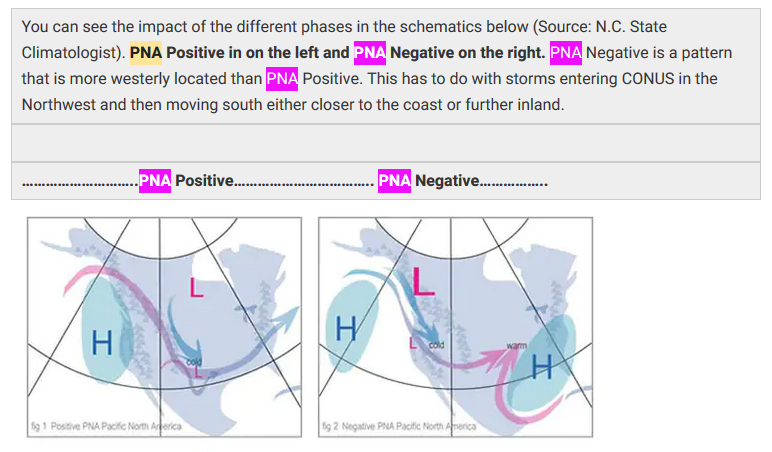
Notice that with a negative PNA (PNA-) storms that approach the U.S. from the Pacific Ocean are likely to dip to the south along the West Coast or the Great Basin rather than farther to the east. I am curious as to why the Southwest would be dry with a negative PNA but notice the subtle difference between the March Outlook and the Outlook for the three-month period. The Southwest dry anomaly does not extend as far to the west in March.
Week 3-4 Discussion
Because of the major shift in the Outlook for the second half of March, I am including the Discussion issued for Weeks 3 and 4. But remember that was issued last Friday.
Week 3-4 Forecast Discussion Valid Sat Mar 12 2022-Fri Mar 25 2022
La Nina continues to be the primary tropical driver of the climate pattern over North America, and is reflected in the predicted temperature and precipitation patterns for week 3-4. The Madden-Julian Oscillation (MJO) continues to be active with anomalous convection over the Indian Ocean. The ECMWF ensemble mean predicts a decrease in the amplitude of the MJO RMM index during the next two weeks, and it is uncertain how much of a role the MJO will have on the mid-latitude circulation pattern over North America. The week 3-4 temperature and precipitation outlooks are based primarily on dynamical model guidance including the GEFS, ECMWF, JMA, and SubX multi-model ensemble. The outlook is consistent with La Nina composites and decadal climate trends.Dynamical model forecasts are broadly consistent with an evolution of the pattern predicted for week 2 with weakening of 500-hPa height anomalies and westward retrogression of a ridge over Alaska that is centered over the Aleutians and Bering Strait during week 3-4 period with positive 500-hPa anomalies persisting over the Alaska Mainland. Negative 500-hPa height anomalies and a trough is predicted from northern Canada southwest into the northwestern CONUS by most model solutions. Positive 500-hPa height anomalies are predicted across the southern tier of the CONUS and over most of the East.
Above normal temperatures are favored for most of Alaska except the southeast, under the predicted ridge and positive 500-hPa height anomalies. Below normal temperatures are more likely for the Alaska Panhandle, under negative 500-hPa height anomalies and northerly flow. Below normal temperatures are favored from coastal areas of the Pacific Northwest across much of the northern tier of the CONUS, under negative 500-hPa height anomalies. Above normal temperatures are likely for most of the southern half of the CONUS, excluding the west coast, under positive 500-hPa height anomalies. Probabilities exceed 70 percent for parts of the Southwest and the Florida Peninsula, where dynamical model forecasts are very consistent. The temperature outlook favors week 3 dynamical model forecasts slightly over week 4 forecasts that predict more extensive above normal temperatures over the East.
Dynamical model forecasts consistently predict likely below median precipitation for the southern coast of the Alaska Mainland and the Alaska Peninsula, under northerly mid-level flow. Above median precipitation is slightly favored for the northwestern coast of the Alaska Mainland, with potential onshore flow. For the CONUS, the precipitation outlook for week 3-4 is mostly consistent with the canonical La Nina pattern. Above median precipitation is favored for the Northwest and from the Central Mississippi and Ohio Valleys across the Northeast, influenced by the predicted trough over the Northwest. Below median precipitation is favored for parts of Southern California across the Southwest into the Southern Plains and along the Gulf Coast, under positive 500-hPa height anomalies.
Dynamical models are in good agreement and consistent with La Nina composites for enhanced probabilities of above median precipitation throughout Hawaii. Based on dynamical model forecasts, above normal temperatures are likely for Hawaii, related to positive sea surface temperature anomalies around the islands.
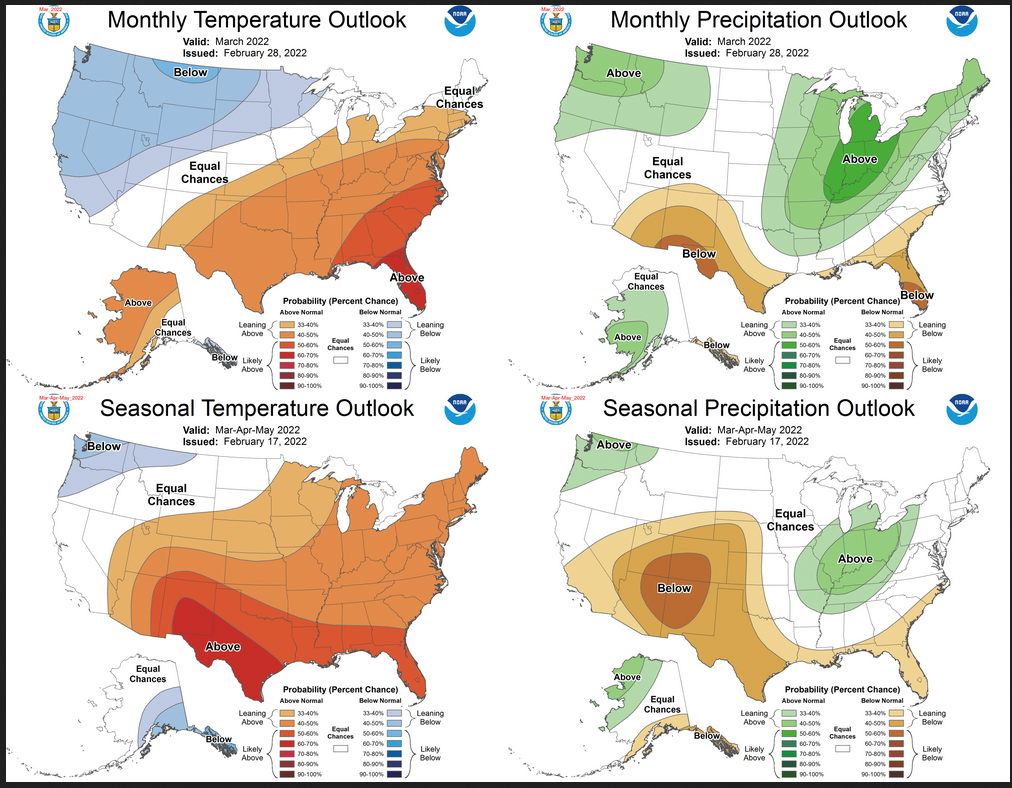
Then we look at the new Monthly Outlook plus the three-month outlook Issued on January 20, 2022
Assessment
Of interest is the similarity between March Outlook and the three-month Outlook. The probabilities shown for March with respect to precipitation are higher than the probabilities shown for the three-month period. That is partially because the first month is easier to predict than the three months. But there are certain aspects of the expected pattern that add to NOAA’s confidence with respect to the March Outlook.
I do not see enough in the discussion that reflects a significant change in thinking relative to April and May. But it is important to keep in mind that the three-month outlook issued on February 17 reflects the Mid-Month Outlook for March. So if March actually happens as forecast, April and May would need to be only slightly different than the previously issued three-month outlook. That is necessary for the three-month outlook to remain correct. Here is the formula for sorting this out.
| For both temperature and precipitation, if you assume the colors in the maps are assigned correctly, it is a simple algebra equation to solve the month two/three forecast probability for a given location = (3XThree-Month Probability – Month One Probability)/2*. So you can derive the month two/three forecast this way. You can do that calculation easily for where you live or for the entire map. |
One way to get a handle on what has changed is to compare the updated March Outlook with the Early/Mid-Month Outlook for March issued on February 17. They are now calling that the Mid-Month Outlook.
To do that I have to do what is essentially cut and paste.
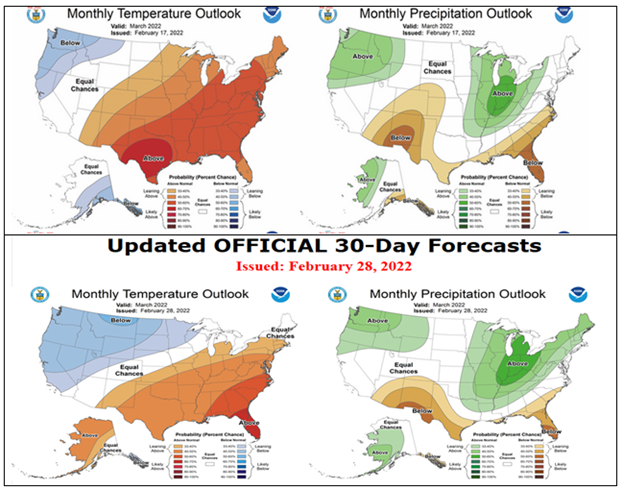
That looks like it worked. The method I used loses a little resolution but I think you can compare the two. The top is the Mid-Month Outlook and below it is the Updated Outlook. There have been some slight changes. You can see what they are. For temperature, it is a lot cooler than the Mid-Month Outlook and the levels of confidence are lower. I am not sure how to interpret the slight change in precipitation.
There are no reversals in the new forecast for March relative to the three-month forecast other than for Alaska. All the changes, except for Alaska, are from above normal to equal chances (EC) or the reverse or from below normal to EC or the reverse. There are no changes from above normal to below normal or the reverse. So the changes are easily seen but not extremely significant.
Drought Outlook
Here is the newly issued Drought Outlook for March 2022
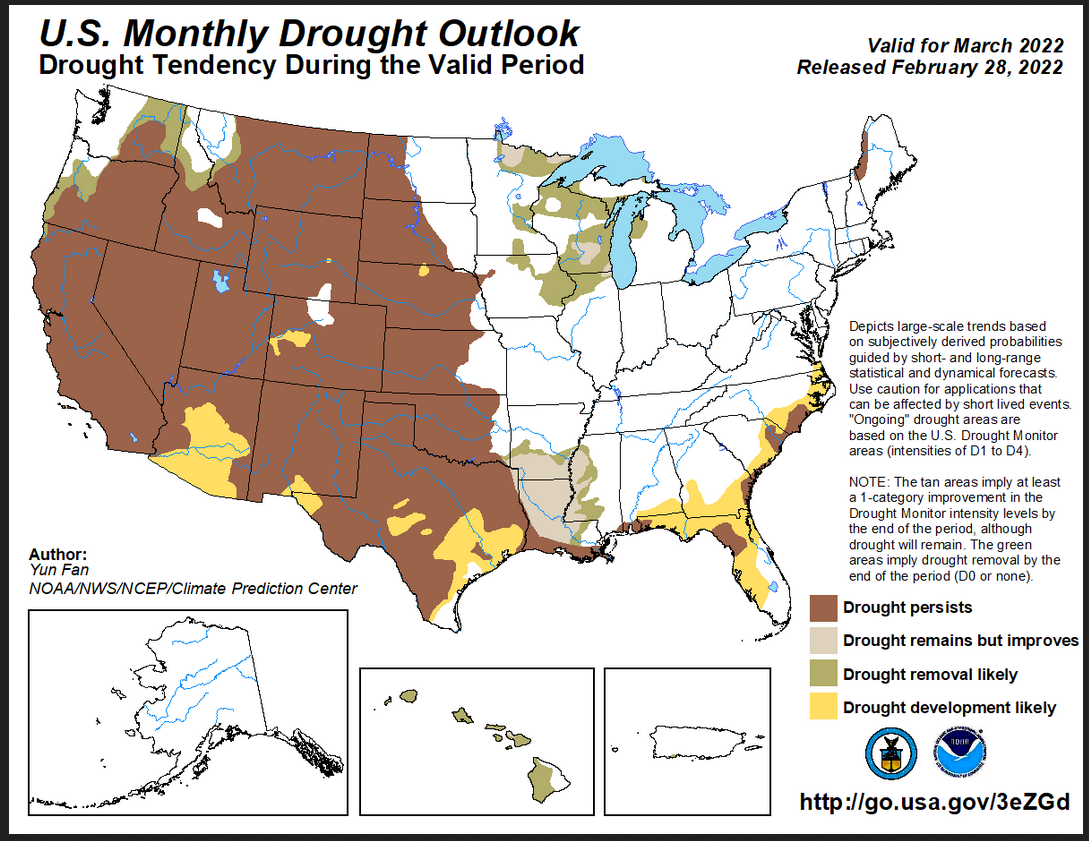
On balance, some areas improve, some get worse. The summary and detailed discussions that accompany this graphic can be accessed here https://www.cpc.ncep.noaa.gov/products/expert_assessment/mdo_summary.php
Visual Consistency Testing.
What I am going to try to do is show the 5-day outlook, 6 – 10 day outlook, 8 – 14 day outlook, and Week 3-4 outlook. Since this is a Monday, this will give me 25 days of forecasts out of 31 days in March so it should be pretty good but by no means perfect.
I am going to have small images that I think you will be able to click on them to make them larger. I also think that they will auto-update. Thus you have a weather forecasting system here.
Let’s see what we get
First Temperature
| Maximum Temperature Day 3 | Days 6 – 10 | Days 8 – 14 | Weeks 3-4 |
 |
 |
 |
 |
At this point in time, we have 25 days of short-term precipitation forecasts for March which has 31 days. So we are missing about a week. It seems to be consistent with the short-term forecasts. I believe the short-term forecasts will update in the article but I am not sure of that.
There is a lot of variation throughout the month.
And then Precipitation
| Cumulative Days 1 – 5 | Days 6 – 10 | Days 8 – 14 | Weeks 3-4 |
 |
 |
 |
 |
At this point in time, we have 25 days of short-term forecasts for March which has 31 days. So we are missing about a week. It seems to be consistent with the short-term forecasts. I believe the short-term forecasts will update in the article but I am not sure of that.
Sometimes it is Useful to take a look at Persistence. Is the March Outlook similar to the February Actual
Looking back on February 2022 to relate the forecast for March to August to the actual for February.
Here is the actual for February minus one day on the left and the Outlook for March on the right. One row is for temperature and the bottom row is for precipitation.
| February Actual (27 0f 28 Days | March Outlook | |
| Temperature | 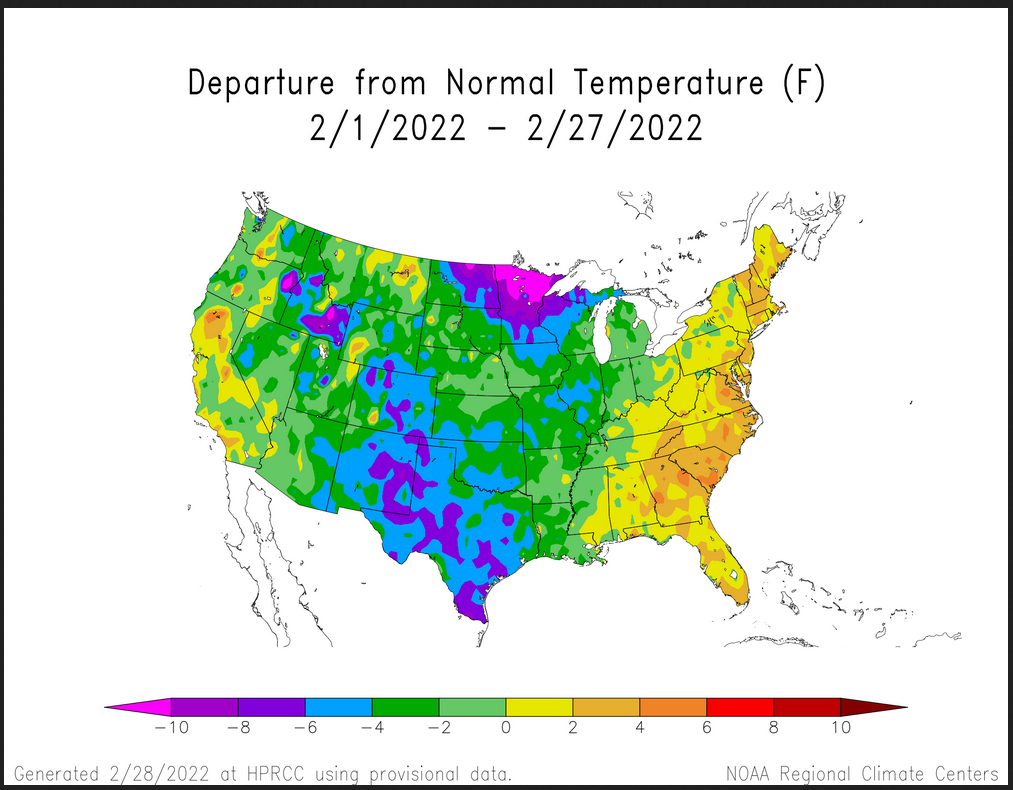 |
 |
| Precipitation | 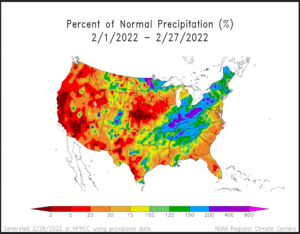 |
|
There seems to be quite a bit of persistence meaning that March is expected to be somewhat similar to February in terms of variation from Normal. Of course, Normal for March is different than Normal for February.
The images above are frozen. But if you want to find month-to-date temperature or precipitation there are the links.
Month to date Temperature can be found at https://hprcc.unl.edu/products/maps/acis/MonthTDeptUS.png
Month to date Precipitation can be found at https://hprcc.unl.edu/products/maps/acis/MonthPNormUS.png