At the end of every month, NOAA updates its Outlook for the following month which in this case is March of 2023. We are reporting on that tonight.
There have been some significant changes in the Outlook for March and these are addressed in the NOAA Discussion so it is well worth reading. We highlighted some of the important changes within the NOAA Discussion. We also provided the prior Mid-Month Outlook for March for comparison. From the NOAA Discussion:
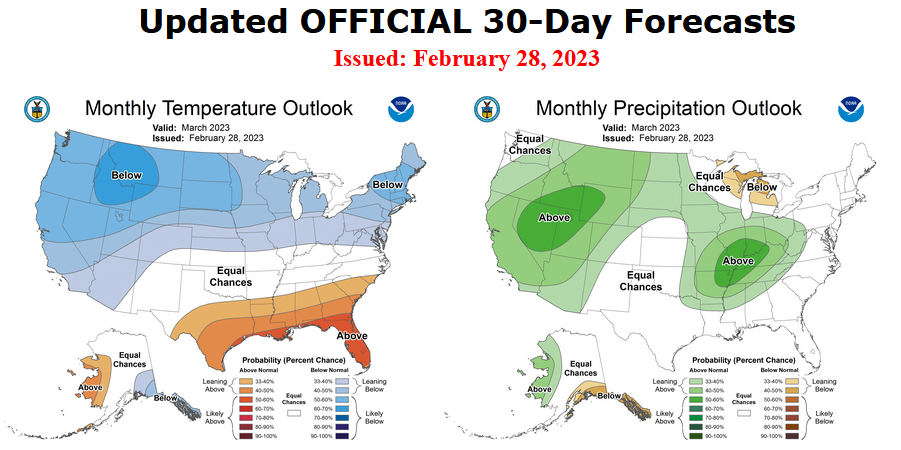
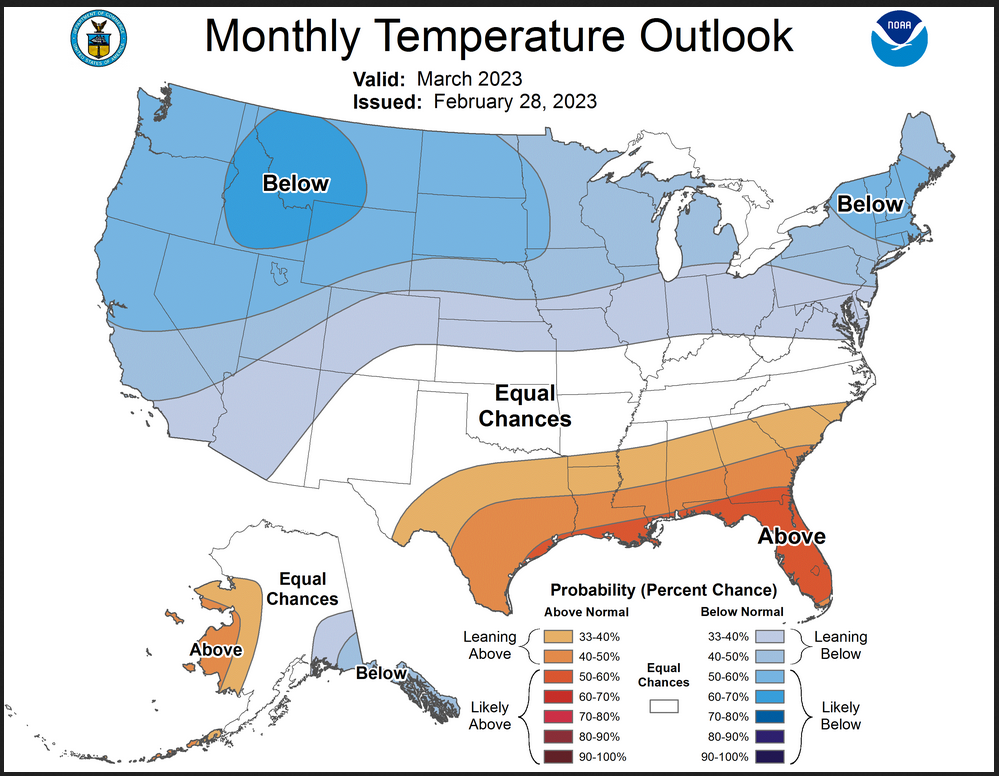
- “the updated temperature outlook has increased forecast coverage and probabilities for below-normal temperatures for the western CONUS and for the northern Plains, Midwest, Great Lakes, mid-Atlantic and Northeast.”
- “Stronger support for favored below-normal monthly mean temperatures for more of the central and eastern CONUS resulted in a reduction in the depicted area for favored above-normal temperatures which are now forecast from Texas eastward to the lower Atlantic seaboard.”
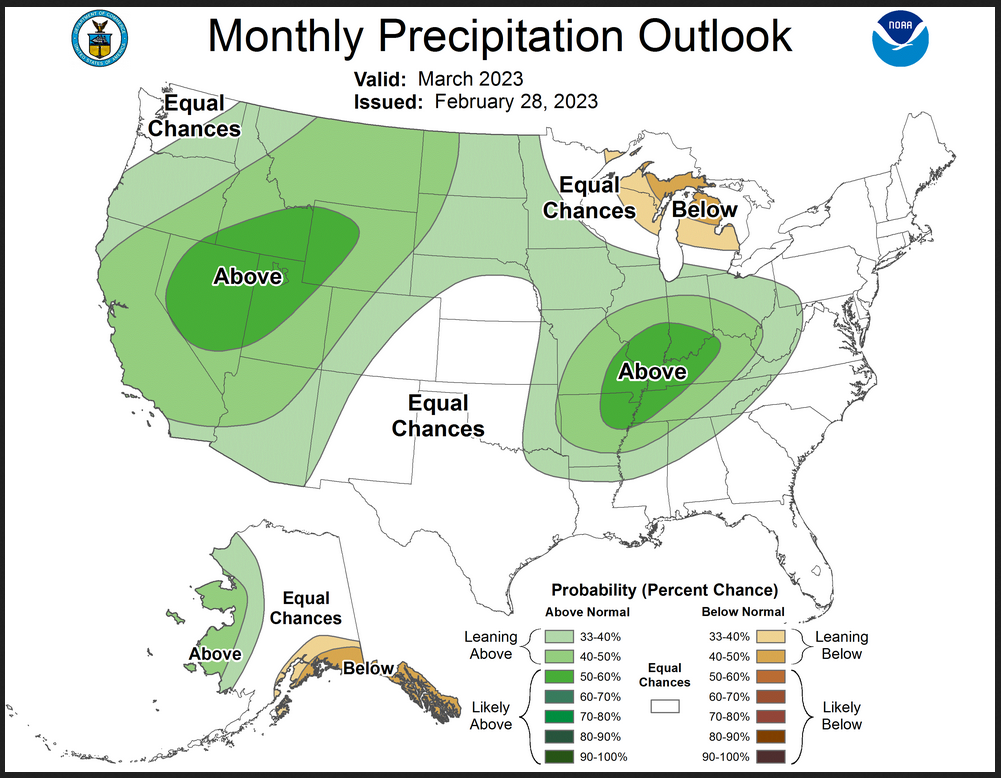
- “a somewhat southward displaced overall anomalous precipitation forecast pattern.”
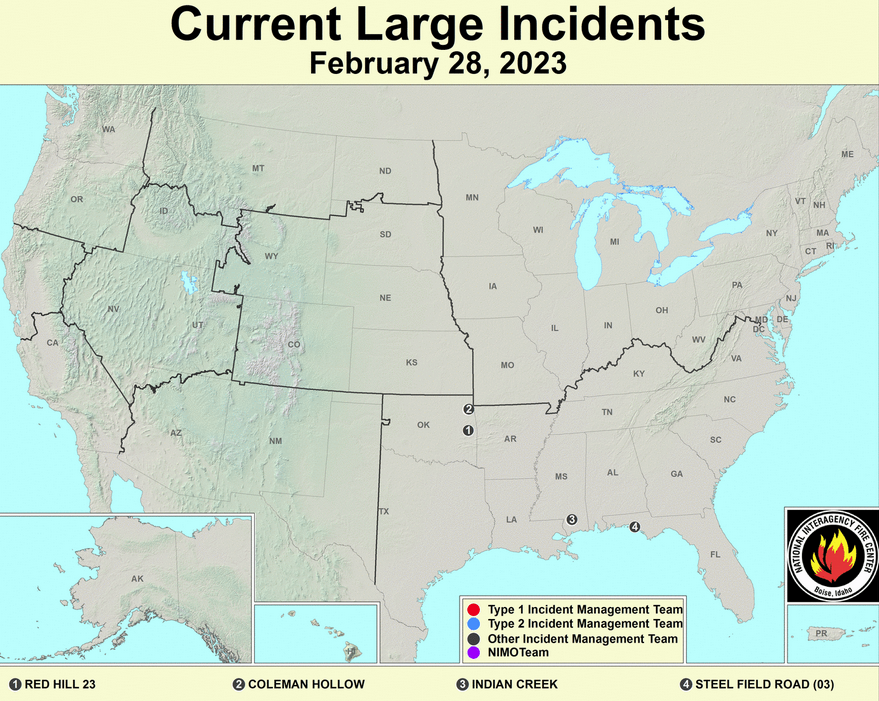
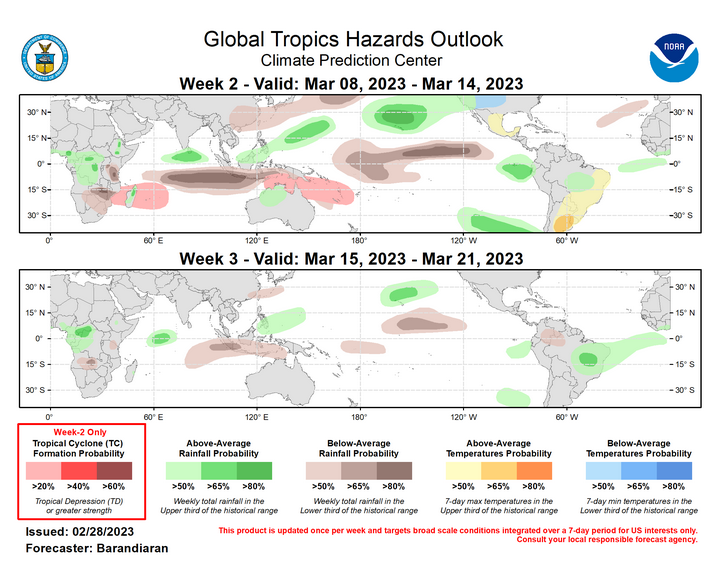
The article includes the Drought Outlook for March. We have also included the current fire incidents (not many) and four months of Wildland Fire Potential Outlooks and also a map showing the year-to-date snowpack in the West. We also provide the Week 2/3 Tropical Outlook for the World.
| Tonight’s regular Daily Weather article can be found HERE. |
Here is the updated Outlook for March, 2023
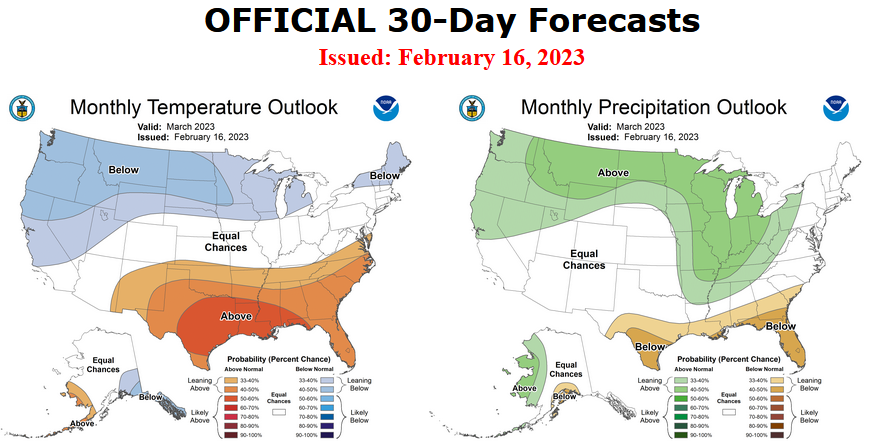
Fro Comparison Purposes, Here is the Mid-Month Outlook for March
| There has been a substantial change. Remember, it is the top set of maps that are the current outlook for March. |
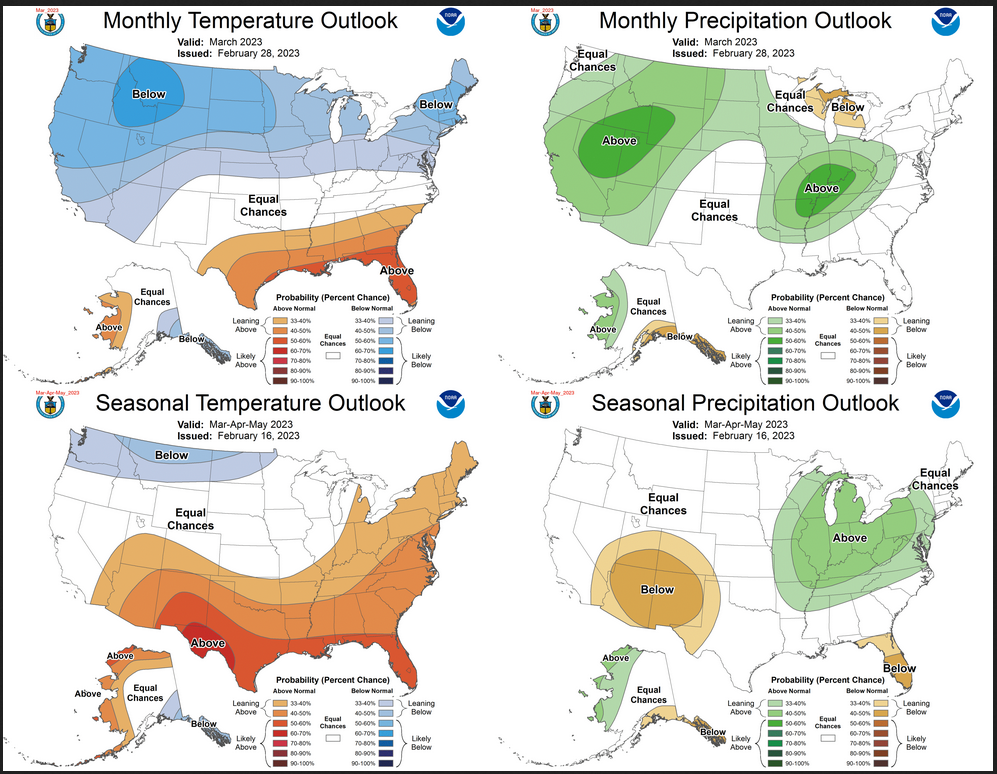
Combination of the Updated Outlook for March and the Three-Month Outlook
ANALYSIS
| For both temperature and precipitation, if you assume the colors in the maps are assigned correctly, it is a simple algebra equation to solve the month two/three anomaly probability for a given location = (3XThree-Month Probability – Month One Probability)/2*. So you can derive the month two/three outlook this way. You can do that calculation easily for where you live or for the entire map. |
It is important to remember that the Outlook for next month was updated on the last day of the current month and the three-month Outlook was issued on the third Thursday. So the period of time between the Mid-Month and End of Month Update varies from month to month from 10 days to 16 days. So there sometimes is a substantial change in the Next Month’s Outlook from the Mid-Month prediction. In such cases, we wonder if a change in the one-month outlook suggests that the three-month outlook would need to also be adjusted. I think that in this case, the answer is that it might be wise to review that but it will not happen until the third Thursday in the coming month. We will get a hint of that a week earlier when the ENSO Update is issued on the Second Thursday of this coming month which is not far from now.
Here are larger versions of the Temperature and Precipitation Outlook maps
NOAA (Really the National Weather Service Climate Prediction Division CPC) Discussion (I have shown certain important points in bold type. my comments if any are in brackets [ ])
30-DAY OUTLOOK DISCUSSION FOR MARCH 2023
The updated March 2023 temperature outlook utilizes the latest status of the MJO and the SSW along with short-, extended- and subseasonal-range dynamical model guidance to adjust the original mid-February outlook release. The evolution and thinking outlined in the mid-month discussion (see below) with respect to both the MJO and SSW remain valid.
For the MJO, observational indicators as depicted in several variables and model predictions of the RMM index from multiple operational centers continue to predict the MJO entering and passing through phases that are consistent with a pattern change across the central and eastern CONUS during the middle two weeks of March. More frequent troughing and below-normal 500-hPa height anomalies, consistent with the forecast evolution of the MJO, favors below-normal temperatures to expand eastward to include the north-central and eastern U.S. after the first week in March (Week-2) and most likely through Week-3 as well, before easing. Model forecast guidance from the ECMWF, GEFSv12 and ECCC have come into better agreement with a solution favoring, on average, below-normal temperatures for much of the middle two weeks of March. So the updated temperature outlook has increased forecast coverage and probabilities for below-normal temperatures for the western CONUS and for the northern Plains, Midwest, Great Lakes, mid-Atlantic and Northeast.
Stronger support for favored below-normal monthly mean temperatures for more of the central and eastern CONUS resulted in a reduction in the depicted area for favored above-normal temperatures which are now forecast from Texas eastward to the lower Atlantic seaboard.
The reason the depicted probabilities are modest, including a forecast area of Equal-Chances (EC), is depicted from the central Plains, Ohio Valley and mid-Atlantic southward to the southern Plains and Southeast is due to a likely warmer than normal start (Week-1) for many areas across this region as well as the potential for warmer temperatures to be present later in the month (Week-4).
The forecast for Alaska remains largely unchanged from the mid-February original outlook.
The March precipitation outlook, to first order, also remains largely unchanged with the primary difference being a somewhat southward displaced overall anomalous precipitation forecast pattern. For example, the area of favored above-normal monthly total precipitation amounts now includes the southern half of California, the central and southern Great Basin, the central Rockies and parts of the Southwest as an amplified trough is favored across the western CONUS early in the month. Probabilities are also increased with highest odds for the central Great Basin and central Rockies.
Elevated odds for above-normal precipitation remains forecast for the northern Plains, parts of the Midwest, Ohio Valley and central Mississippi Valley. Conflicting signals from the guidance in anomalous precipitation across time scales for the Gulf coast warranted removal of the favored below-normal precipitation depicted at mid-month. Alternatively, elevated odds for below-normal precipitation is now forecast for parts of Wisconsin and Michigan as anomalous drier northwesterly flow associated with a potential southward shift of the storm track may decrease prospects for precipitation.
The forecast for Alaska remains largely unchanged from the mid-February outlook except for an extension of favored below-normal precipitation that now includes Southeast Alaska.
Drought Outlook
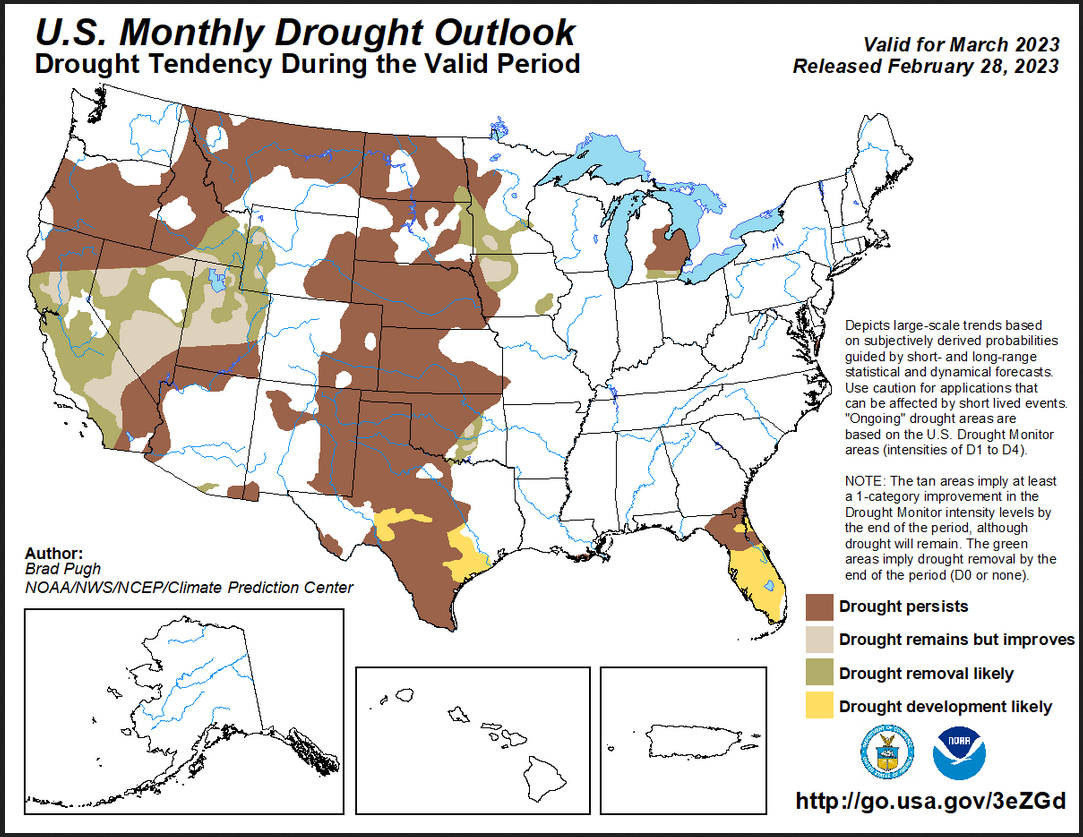
Here is the newly issued Drought Outlook for next month.
–
| You can see where drought development or reduction is likely. There is a significant reduction in the area that is forecast to be in drought. The summary and detailed discussions that accompany this graphic can be accessed HERE |
Here is the short version of the drought summary
Latest Monthly Assessment – According to the U.S. Drought Monitor, drought coverage across the contiguous U.S. (CONUS) peaked at 62.95 percent during late October 2022. Since that time, a steady decrease in drought coverage and intensity occurred across much of the West, northern Great Plains, and Midwest. The coverage of severe (D2) to exceptional (D4) drought is at its lowest since August 2020. Based on an above-average snowpack and the March outlook favoring above-normal precipitation and below-normal temperatures, continued drought improvement or removal is forecast for much of California and the Great Basin. Farther to the north across the northwestern CONUS, water-year-to-date precipitation (October 1, 2022 to February 27, 2023), has averaged below-normal which supports the persistence of long-term drought. Broad-scale persistence is also the most likely outcome for a majority of the ongoing drought across the Great Plains, since March is a relatively dry time of year. Recent wetness and additional precipitation at the beginning of March support improvement or removal across east-central Oklahoma. Increasing short-term precipitation deficits along with mostly dry weather early in the month favors development for parts of Texas. The highest forecast confidence for development exists across the Florida Peninsula due to an unseasonably warm, dry February and a likely dry start to March.
February precipitation averaged more than 200 percent of normal across much of the Midwest. This anomalous wetness along with elevated probabilities for above-normal precipitation forecast during March support drought improvement or removal for southern Minnesota and much of Iowa. Although February was drier-than-normal throughout the Northeast, this region is expected to remain drought-free. Alaska, Hawaii, and Puerto Rico are also likely to remain drought-free through the end of March.
Worldwide Tropical Forecast
 –
–
| To update this forecast (which updates on Tuesdays) click HERE |
Month-to-date Temperature as the current month evolves can be found at https://hprcc.unl.edu/products/maps/acis/MonthTDeptUS.png
Month-to-date Precipitation as the current month evolves can be found at https://hprcc.unl.edu/products/maps/acis/MonthPNormUS.png
CLIMAS Podcast
Click HERE to get the CLIMAS Dashboard and then click the “START” arrow to hear the podcast.
Water-Year to Date SWE and Precipitation
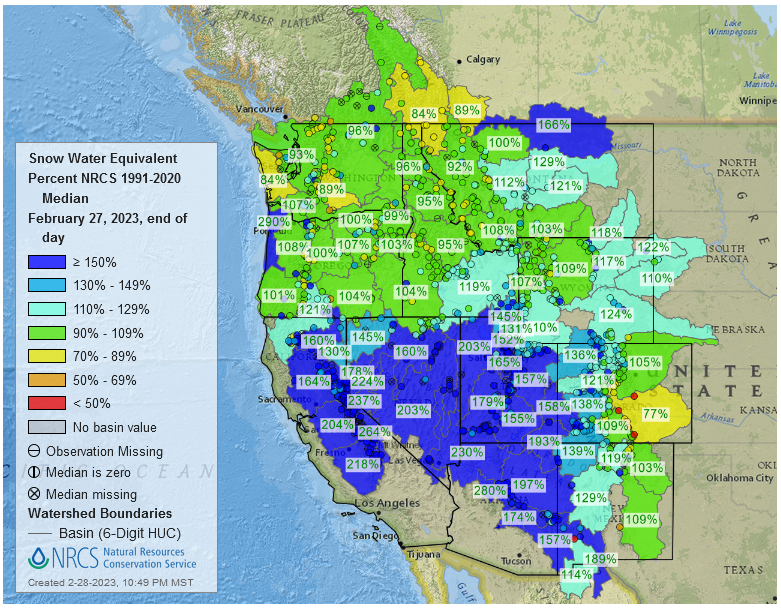
Water year-to-date SWE can be found by clicking HERE I provided a map current as of the day before this article was published.
Fire Outlook: Current and Forecast
Updates to the major fire situation can be found by clicking here https://fsapps.n wcggov/afm/index.php
Now looking at the wildland fire potential Outlooks. (These maps will update in the afternoon of the first day of the month). Since they are set to auto-update, if you look at a prior version of this article, these four maps will not be the original maps but the updated maps.
If you read this article a month from now and if the maps did not auto-update, you can update these graphics by clicking here https://www.ni fc.gov
| I hope you found this article interesting and useful |
