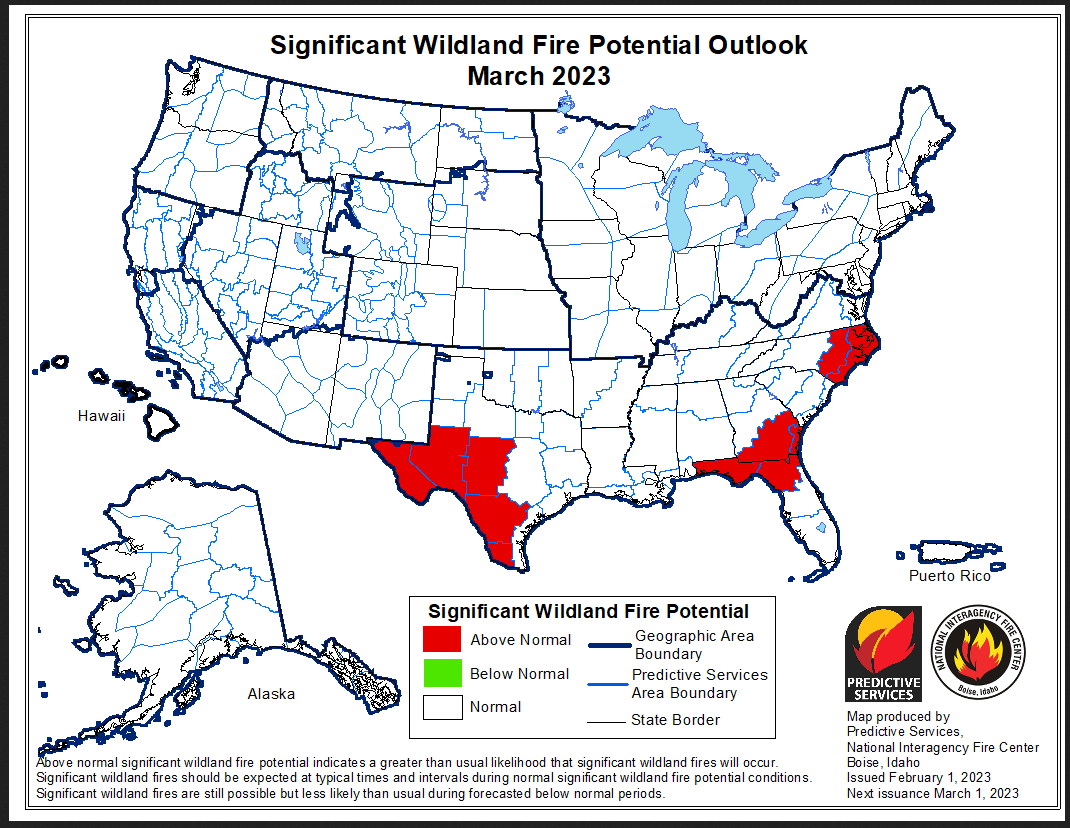
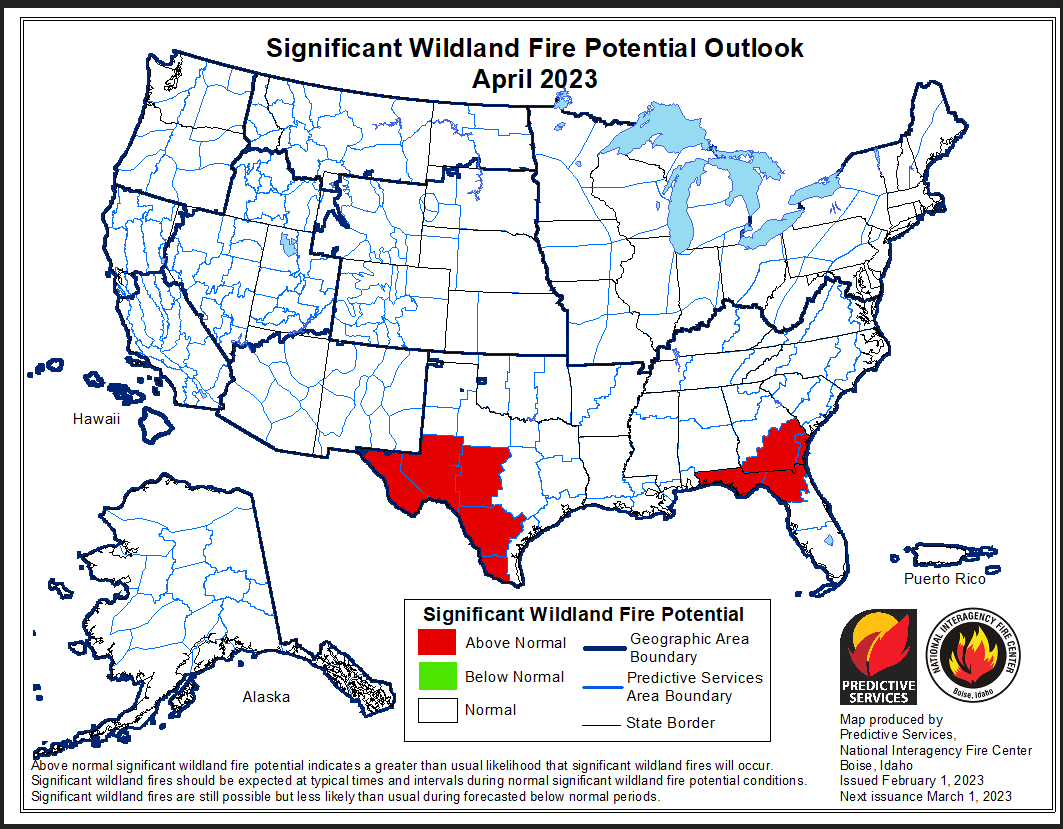
Updated at 11:45 p.m. EST February 11 to update the wildfire potential maps that should have been updated early in the month.
At the end of every month, NOAA updates its Outlook for the following month which in this case is February of 2023. We are reporting on that tonight.
There have been some significant changes in the Outlook for February and these are addressed in the NOAA Discussion so it is well worth reading. We highlighted some of the important changes within the NOAA Discussion. We also provided the prior Mid-Month Outlook for February for comparison. Although we remain in weak La Nina conditions, other facts now play a large and perhaps a larger role in the outlook for February.
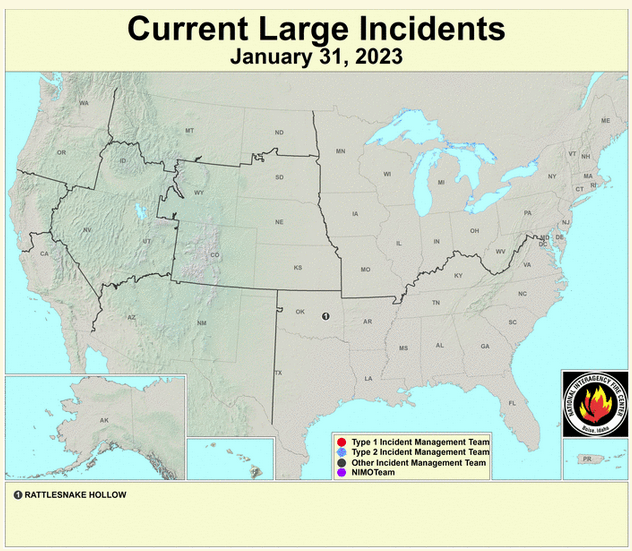
The article includes the Drought Outlook for February. We have also included the current fire incidents (not many) and four months of Wildland Fire Potential Outlooks and also a map showing the year-to-date snowpack in the West. We also provide the Week 2/3 Tropical Outlook for the World.
| Tonight’s regular Daily Weather article can be found HERE. |
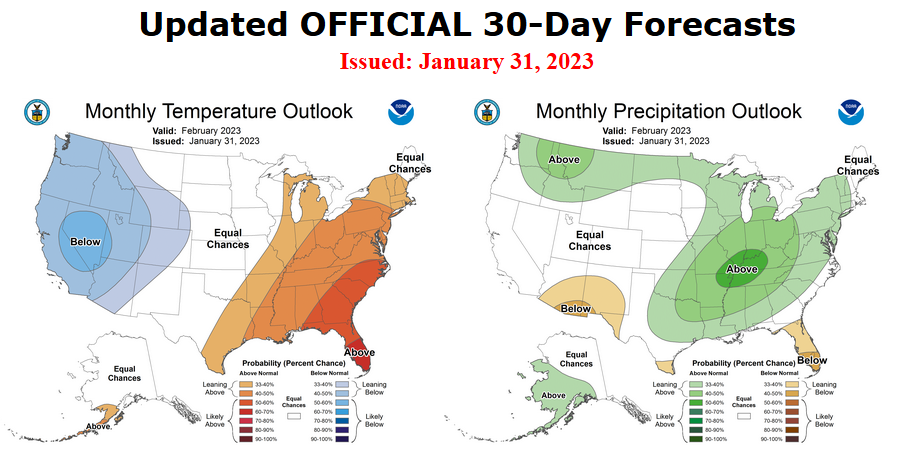
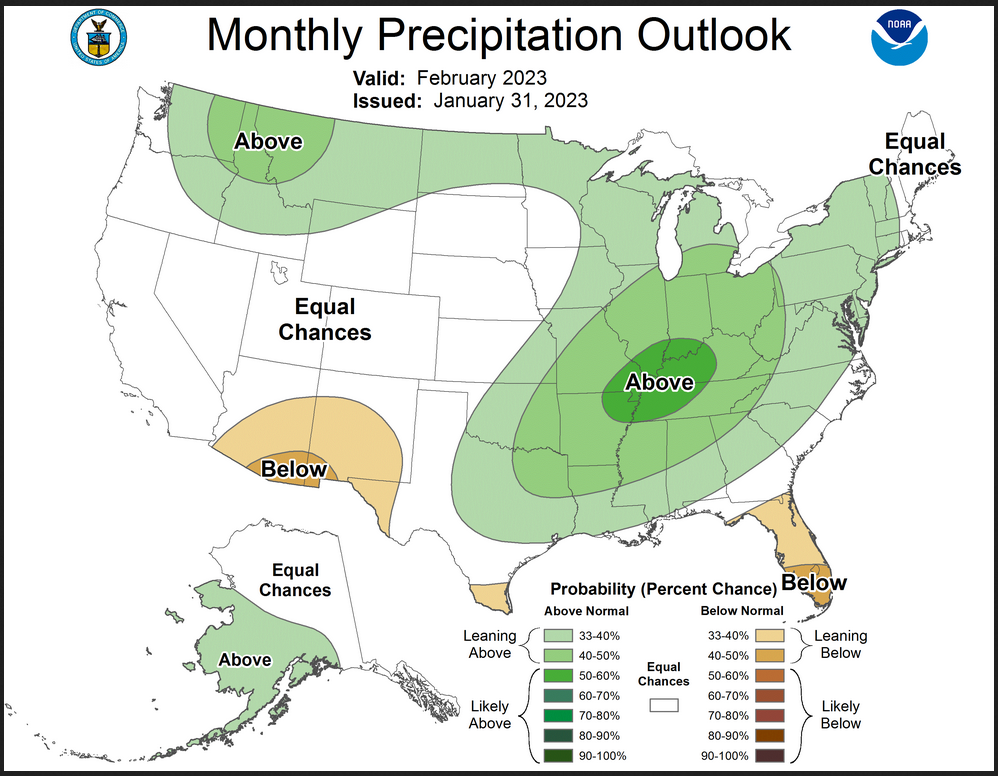
Here is the updated Outlook for February
Mid-Month Outlook for February
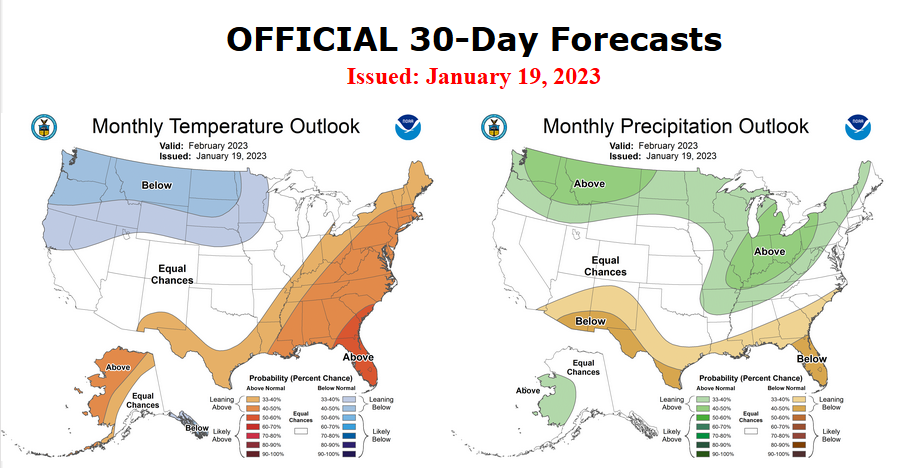
| There has been a substantial change. Remember, it is the top set of maps that are the current outlook for February. |
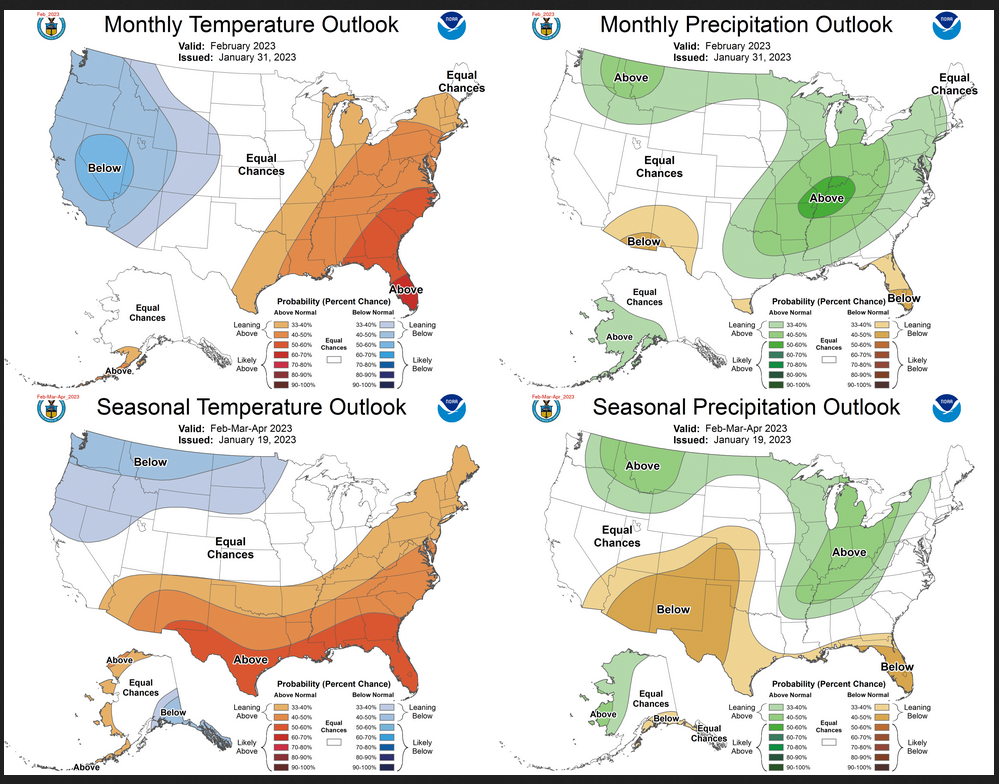
Combination of the Updated Outlook for February and the Three-Month Outlook
ANALYSIS
| For both temperature and precipitation, if you assume the colors in the maps are assigned correctly, it is a simple algebra equation to solve the month two/three anomaly probability for a given location = (3XThree-Month Probability – Month One Probability)/2*. So you can derive the month two/three outlook this way. You can do that calculation easily for where you live or for the entire map. |
It is important to remember that the Outlook for next month was updated on the last day of the current month and the three-month Outlook was issued on the third Thursday. So the period of time between the Mid-Month and End of Month Update varies from month to month from 10 days to 16 days. So there sometimes is a substantial change in the Next Month’s Outlook from the Mid-Month prediction. In such cases, we wonder if a change in the one-month outlook suggests that the three-month outlook would need to also be adjusted. I think that in this case, the answer is that it might be wise to review that but it will not happen until the third Thursday in the coming month. We will get a hint of that a week earlier when the ENSO Update is issued on the Second Thursday of this coming month which is not far from now.
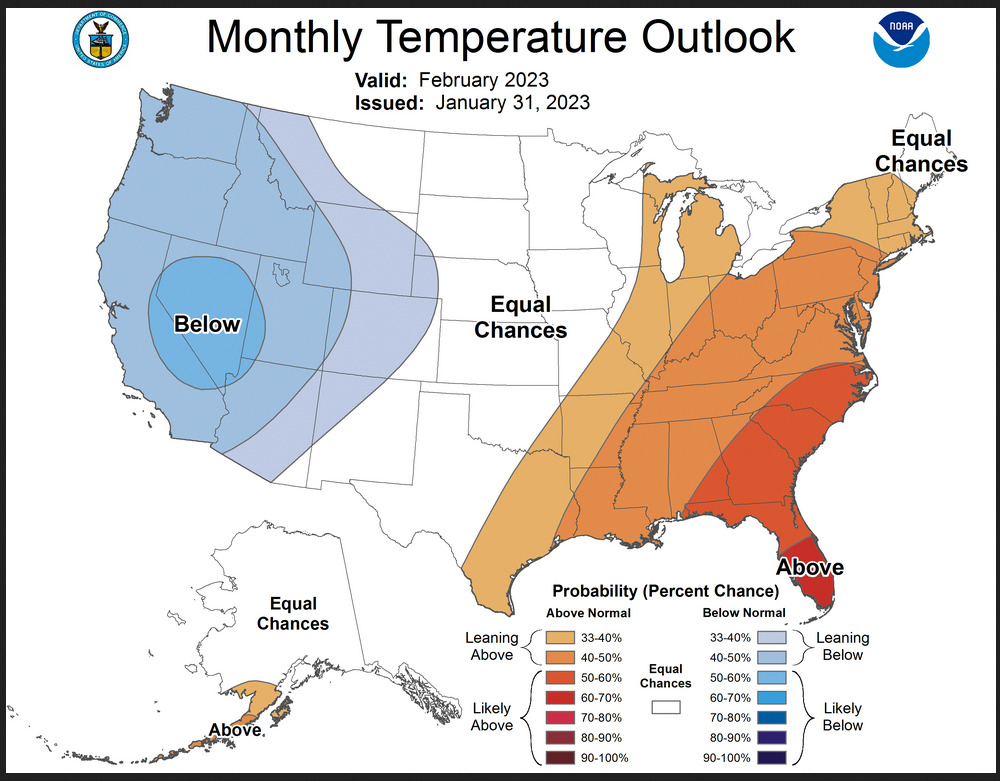
Here are larger versions of the Temperature and Precipitation Outlook maps
NOAA (Really the National Weather Service Climate Prediction Division CPC) Discussion (I have shown certain important points in bold type. my comments if any are in brackets [ ])
30-DAY OUTLOOK DISCUSSION FOR FEBRUARY 2023
The current state of the El Niño Southern Oscillation (ENSO) remains in the negative phase with the latest weekly observed Niño 3.4 Index value standing at -0.6 degrees Celsius. Meanwhile, the amplitude of the Madden Julian Oscillation (MJO) has increased during late January over the east-central Indian Ocean and is forecast to propagate eastward to the Maritime Continent and West Pacific through mid-February. The Arctic Oscillation (AO) and North Atlantic Oscillation (NAO) have both been in the positive phase in recent days while the Pacific North American (PNA) pattern has transitioned to the negative phase. Composites derived from the recent evolution of ENSO and extra-tropical indices depict anomalous ridging off the west coast of North America as well as over the southeastern Contiguous United States (CONUS). Anomalous troughing is indicated across the Northern Plains to much of the Interior West. However, MJO composites show anomalous ridging over the eastern CONUS stretching westward across much of the Plains. Additionally, MJO composites depict increased troughing over Alaska relative to composites derived from ENSO. The competing influences from ENSO and the MJO introduces increased uncertainty across large portions of the forecast domain. The current robust MJO event is expected to be a significant driver for the evolution of the overall pattern during the month of February and is a major factor in contributing to modifications in the current updated outlooks as compared to the February Outlooks issued on January 19 (herein referred to as the mid-month outlooks). In addition to analysis of the current evolution of ENSO, the MJO, and extratropical indices such as the AO, NAO, and PNA, short term dynamical model guidance is relied upon with the official short and medium range outlooks from the Weather Prediction Center (WPC), 6-10 Day and 8-14 Day Outlooks from the Climate Prediction Center (CPC), and Weeks 3-4 Outlooks from CPC contributing significantly to the updated February 2023 outlooks. Dynamical model guidance from the Climate Forecast System Version 2 (CFSv2), the Global Forecast System (GFS), the European Centre for Medium Range Weather Forecasts (ECMWF), and Environment and Climate Change Canada (ECCC) were utilized to supplement the official outlooks. Antecedent conditions such as extratropical Sea Surface Temperatures (SSTs), sea ice extent, and snow cover anomalies also were factors in the construction of the February Outlooks where appropriate.
Short and medium range outlooks from WPC and CPC as well as ENSO-based statistical guidance are in good agreement in favoring above normal temperatures across much of the eastern CONUS. MJO composites also support an expansion of milder than normal conditions westward across most of the Plains. Therefore, the areal extent of enhanced above normal temperature probabilities is increased relative to the mid-month outlook and now covers most of the eastern third of the CONUS. One exception is for northern New England, where EC is indicated due to the potential for a brief cold snap early in the month. Due to the warm signal shown by MJO-based composites over the central CONUS, enhanced below normal temperatures depicted in the mid-month outlook over the Northern Plains has been removed and Equal Chances (EC) is now depicted across this region. Conversely, dynamical model guidance from the CFSv2 is much colder across the southwestern CONUS relative to guidance available in mid-January.
This trend in the CFSv2 as well as support from CPC’s 6-10 Day, Week-2, and Weeks 3-4 outlooks led to an expansion of enhanced below normal temperature probabilities across the CONUS from the Rockies westward. Anomalous snow cover is also a contributing factor in increasing chances of below normal temperatures across parts of the West. Uncertainty is very high for the temperature outlook across the state of Alaska. Composites derived from MJO and ENSO yield conflicting signals with the former producing a much colder signal across western parts of the state. Conflicting signals are also evident across time scales as the CPC 6-10 Day and Week-2 outlooks tilt cold across northern and western Alaska while the CPC Weeks 3-4 outlooks depict the opposite. Due to these uncertainties, EC is indicated across much of Alaska. The lone exception is across the Aleutians and Alaska Peninsula, where a slight tilt toward above normal temperatures is indicated based primarily on current observations of above normal SSTs and below normal sea ice extent.
An active pattern is likely across much of the eastern CONUS as short and medium range guidance from WPC and CPC generally support above normal precipitation across much of the region. Guidance from the CFSv2 has trended south in bringing increased chances of above normal precipitation chances across much of the Southeast and Lower Mississippi Valley, and Southern Plains, in-line with current WPC and CPC short and medium range outlooks. Therefore, the area of enhanced above normal precipitation chances has expanded across the eastern and central CONUS relative to the mid-month outlook and now extends southward to the Southeast, Gulf Coast, Lower Mississippi Valley, and Southern Plains. Correspondingly, areas of enhanced below normal precipitation probabilities are suppressed to the Florida Peninsula and southern Texas.
Increased uncertainty is evident farther to the west, along the West Coast of the CONUS. The CFSv2 has trended drier along the West Coast relative to mid-month and ENSO and MJO-based composites yield conflicting signals . These factors, combined with relatively weak probabilities depicted in CPC’s 6-10 Day, Week-2, and Weeks 3-4 outlooks resulted in a forecast of EC along the West Coast of the CONUS. Above normal precipitation is still favored for the Northern Rockies, where CPC outlooks at various time scales within the month of February are in general agreement. Conversely, a tilt toward below normal precipitation is indicated for parts of the Southwest, consistent with the CPC Weeks 3-4 outlooks and with recent February trends . A tilt toward above normal precipitation is indicated for much of western and southern Alaska, consistent with ENSO composites, CPC official Week-2 and Weeks 3-4 outlooks, and the latest CFSv2 guidance.
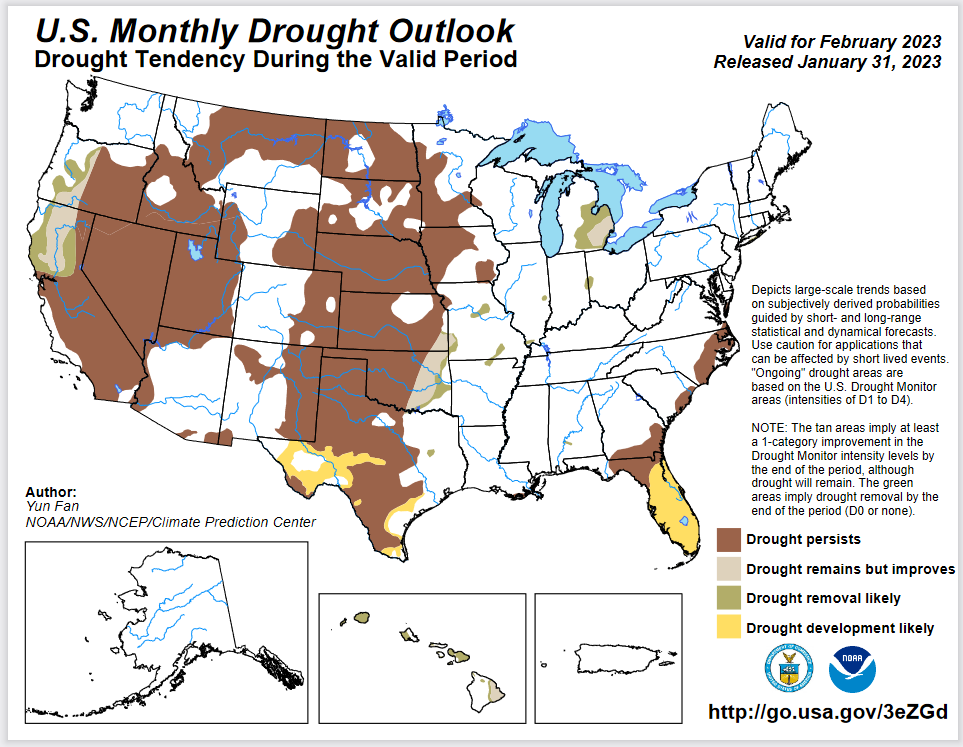
Drought Outlook
Here is the newly issued Drought Outlook for next month.
–
| You can see where drought development or reduction is likely. The changes are fairly small and the increases and decreases are pretty much the same size. The summary and detailed discussions that accompany this graphic can be accessed HERE |
Here is the short version of the drought summary
Latest Monthly Assessment – During late December 2022 and early January 2023, several atmospheric river storms brought heavy precipitation across much of the Sierra Nevada, the Cascades, and the Pacific Coast from southwestern California to the Canadian Border. Substantial portions of the Sierra Nevada, much of California, western Oregon and Washington coastline recorded over 20 inches of precipitation. 1- to 3-category drought improvement was observed over the region since late December 2022. Heavy precipitation also brought major improvement to drought areas from the western Florida Panhandle through parts of the Mississippi Valleys, much of the Tennessee and Ohio Valleys. Precipitation totaled 5 to locally over 10 inches from far eastern Texas through much of the lower Mississippi and Tennessee Valleys. The U.S. Drought Monitor depicted 2- to 3-category improvements across parts of the above regions. Most other areas across the interior West, Southwest and Central High Plains showed more modest improvements, along with parts of the central and northern Atlantic Seaboard, the northern and southern Plains. There were a few areas where drought deterioration prevailed. From the interior western Oregon, western and southern Montana through southern Colorado and eastern New Mexico, portions of the Southern and Central Plains, and the Central and South Atlantic Coastal Region saw 1-category degradations in the U.S. Drought Monitor, with 2- to 3-category declines noted for parts of extreme southern Texas.
Existing drought is expected to improve over northern California and west-central Oregon, to persist over the rest of the West, Northern Rockies and Great Plains, with potential drought development over parts of southern and western Texas. Between 2 and 5 inches of precipitation are forecast for the first week of February from eastern Texas eastward to northern South Carolina, with more wet signals favored over Oklahoma and Arkansas. Existing drought is expected to improve in parts of the above region. Due to the likelihood of above normal precipitation across much of the Mississippi, Tennessee and Ohio Valleys during February, 1 class drought improvement is likely over those areas. Near to below normal precipitation and above normal temperatures are anticipated from the Mid-Atlantic coastal region southward through the Florida Panhandle during this period. Existing drought conditions across the Southeast are expected to persist with drought development likely throughout the Florida Peninsula by the end of the month.
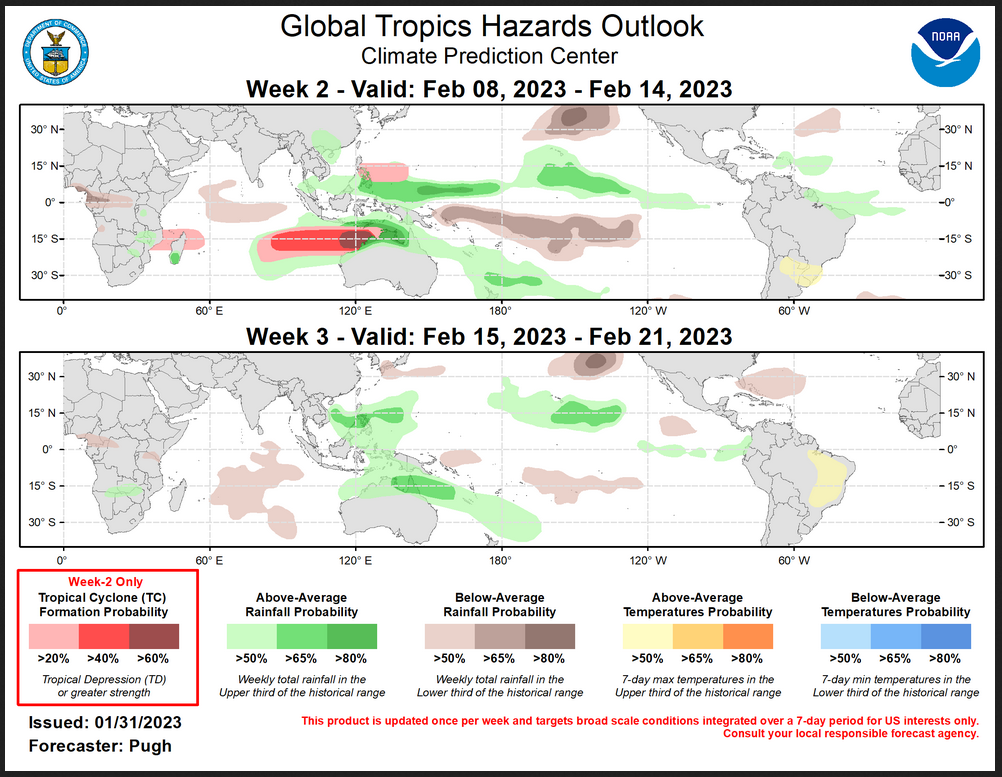
Worldwide Tropical Forecast
–
| To update this forecast (which updates on Tuesdays) click HERE |
Month-to-date Temperature as the current month evolves can be found at https://hprcc.unl.edu/products/maps/acis/MonthTDeptUS.png
Month-to-date Precipitation as the current month evolves can be found at https://hprcc.unl.edu/products/maps/acis/MonthPNormUS.png
CLIMAS Podcast (Sorry, we do not have one this month)
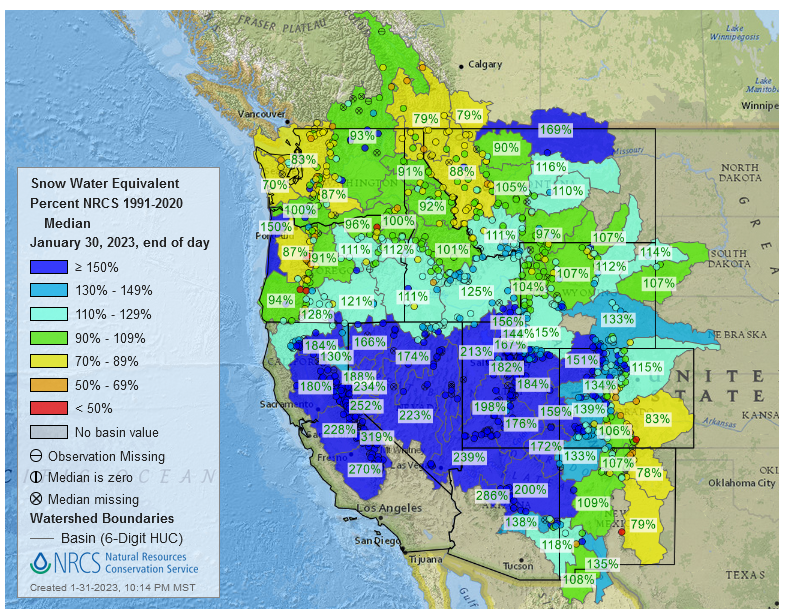
Water-Year to Date SWE and Precipitation
Water year-to-date SWE can be found by clicking HERE I provided a map current as of the day before this article was published.
Fire Outlook: Current and Forecast
Updates to the major fire situation can be found by clicking here https://fsapps.n wcggov/afm/index.php
Now looking at the wildland fire potential Outlooks. (These will be updated when NIFE issues the updated maps on day 1 or 2 of the new month.
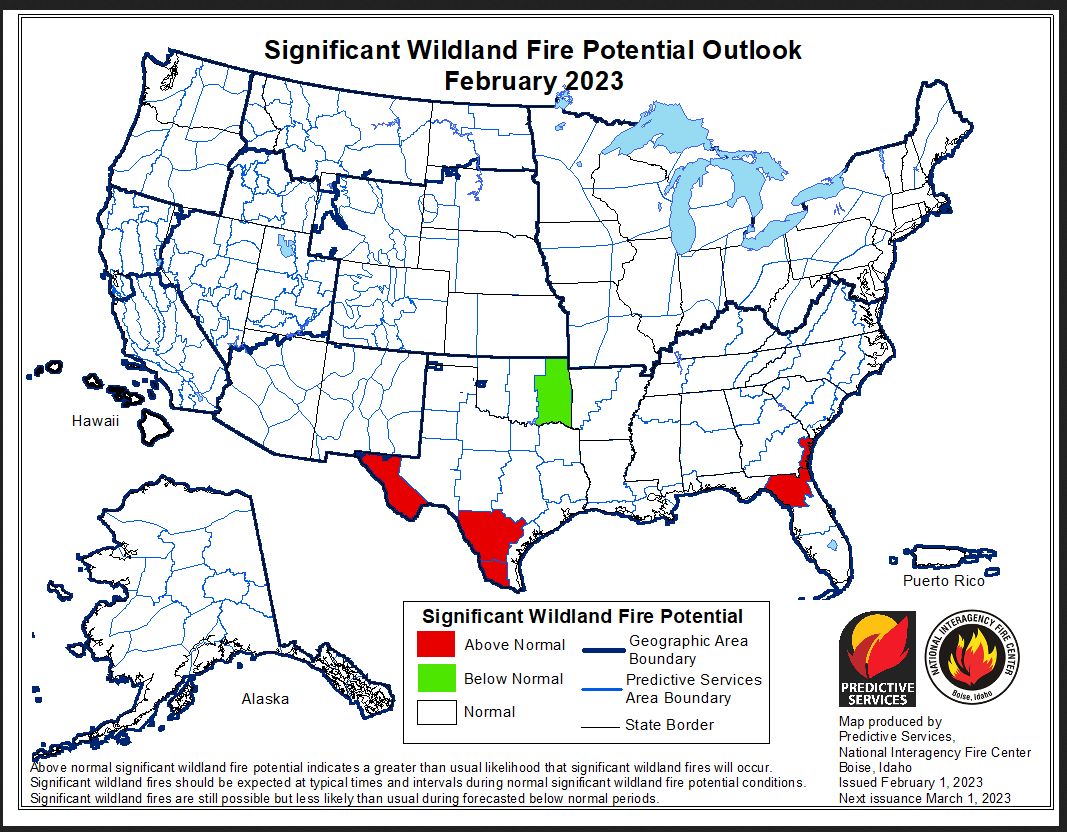
By then, I will have updated the above maps. If you read this article a month from now, you can update these graphics by clicking here https://www.ni fc.gov
| I hope you found this article interesting and useful |
